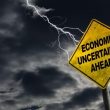
In today’s edition of the Daily Stock Report, we explore Bunge Ltd. (BG), a grain trading and food processing company. Bunge resides in the favoured zone of many SIA reports in which it is a component. Recently, BG also moved into the favoured zone of the SIA S&P 500 Index Report. This move continues an upward trend that began in October when BG exited the red unfavoured zone after remaining there for more than a year. Given recent market volatility, this may indicate some rotation into commodity and defensive sectors. As of Thursday’s close, Bunge sits in the favoured zone at the 118th spot, up 7 places from last week, 36 over the past month, and 262 over the past quarter. This demonstrates the value of SIA Charts’ relative strength rankings in helping investors identify stocks and sectors outperforming their peers or index benchmarks. Outperformance typically reflects positive investor expectations for a company or sector.
Turning to the candlestick chart, we see a major breakout underway in Bunge shares after the price moved above the $87 area, as shown by the long bullish candle in mid October. Since bottoming in February in the high $60 range, the shares have formed a pattern of higher highs and higher lows, ultimately meeting resistance just below the $100 round number. Following the strong weekly move in mid October, the shares have begun to pull back slightly to consolidate recent gains. They are currently moving toward support near $90, with additional support around $87, the prior peak from late summer. The trend remains intact, and resistance is still just below the $100 level. If the shares push above this psychological mark, they appear potentially positioned to challenge the longer-term highs near the $110.00 area.
When analysing the Point and Figure chart at a 2% scale to identify more precise support and resistance levels, we see an initial bottom at $66.89, which closely aligns with the longer-term low from 2021. From there, the shares formed a pattern of higher highs and higher lows, consistently using the long-term green uptrend line as support. The shares are currently in a strong rising column of X’s lasting 11 boxes, with no 3-box reversal yet in place. A move down to $88.26 would confirm a 3-box reversal and mark the first line of support. If that level does not hold, the next support is at $84.83, representing a 50% retracement. Should the uptrend continue, resistance is close at $97.45, followed by $109.74, and then the all-time high at $114.18. The shares currently exhibit a positive Spread Triple Top pattern and hold an SMAX score of 9 out of 10, indicating strong near-term performance across asset classes.
Bunge Ltd. is a global agribusiness and food company operating through four segments: Agribusiness, Refined and Specialty Oils, Milling, and Sugar and Bioenergy. The Agribusiness segment is an integrated global operation focused on purchasing, storing, transporting, processing, and selling agricultural commodities and related products, with assets located across the Americas, Europe, and Asia-Pacific. The Refined and Specialty Oils segment includes businesses producing vegetable oils and fats, such as cooking oils, shortenings, specialty ingredients, and renewable diesel feedstocks. The Milling segment offers wheat flours, bakery mixes, and corn-based products. The Company also produces sugar and ethanol in Brazil through its 50% interest in BP Bunge Bioenergia, a joint venture with BP p.l.c. (BP).
Disclaimer: SIACharts Inc. specifically represents that it does not give investment advice or advocate the purchase or sale of any security or investment whatsoever. This information has been prepared without regard to any particular investors investment objectives, financial situation, and needs. None of the information contained in this document constitutes an offer to sell or the solicitation of an offer to buy any security or other investment or an offer to provide investment services of any kind. As such, advisors and their clients should not act on any recommendation (express or implied) or information in this report without obtaining specific advice in relation to their accounts and should not rely on information herein as the primary basis for their investment decisions. Information contained herein is based on data obtained from recognized statistical services, issuer reports or communications, or other sources, believed to be reliable. SIACharts Inc. nor its third party content providers make any representations or warranties or take any responsibility as to the accuracy or completeness of any recommendation or information contained herein and shall not be liable for any errors, inaccuracies or delays in content, or for any actions taken in reliance thereon. Any statements nonfactual in nature constitute only current opinions, which are subject to change without notice.