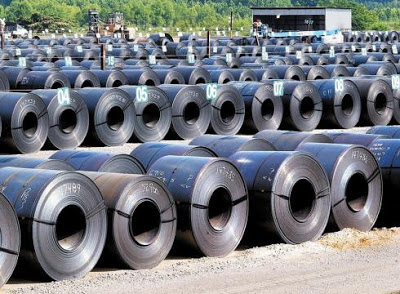
Shares of ArcelorMittal SA ADR (MT) have been marching higher, with performance now standing at 13.73% over the past month, up 19.24% over the last quarter, and a whopping 69.78% YTD. In doing so, shares have also climbed up the SIA relative strength matrixes, specifically in the SIA International ADR Report, where the stock has now entered the favored zone and currently sits at position #55. This follows a long stretch from 2022 to early 2025, when MT was buried deep in the unfavored zone, before beginning to climb through the neutral yellow zone and into the favored zone once again.
What is potentially most exciting about the recent move is that it corresponds with a multi-year breakout on the point and figure chart that dates back to 2015, making it a decade-long formation and a significant event for SIA point and figure technicians. This resistance, now turned support, is marked in light green on the chart with a support line drawn at $31.68, with additional support at the $24.82 level near the positive trend line. While shares of MT show strength, they are not without challenges on the upside, especially given the headwinds facing steel and iron ore stocks. Resistance extends back to 1999 and is marked in red on the chart, with the $59.73 level acting as a stopping point for bullish investors multiple times over the past three decades, and the $88.25 level also presenting resistance that dates back to 2005. MT is a member of the Metals and Mining sector, which remains favored in the SIA Sector Report, and the shares carry an SMAX reading of 8 out of 10, further underscoring their growing relative strength position.
While the first chart is a long-term point and figure chart that highlights the magnitude of the breakout in MT stock on both a relative and absolute basis, the second chart focuses on the recent move through the $33 to $35 resistance zone. Below the candlestick chart, we have added the Average Directional Index (ADX) to provide additional insight into trend strength. The ADX indicator consists of three lines: the ADX line itself, which measures trend strength, and the +DI and -DI lines, which signal directional movement. In our system, the red +DI line has moved higher while the green -DI line has declined, creating a divergence that suggests increasing bullish momentum behind the move.
There’s a bit of serendipity in the fact that just last week we highlighted Xcel Energy (XEL) as a "gro-tility" making waves with its partnership with Form Energy, positioning itself at the forefront of long-duration energy storage. Now, we find ArcelorMittal—one of the world’s largest steel and mining companies—also deeply connected to Form Energy through both investment and material supply. This unexpected overlap underscores how Form’s iron-air battery technology is quietly becoming a common thread between industrial and utility leaders. For ArcelorMittal, the partnership supports its decarbonization goals and opens new opportunities for its core materials to power the next generation of clean energy solutions.
Disclaimer: SIACharts Inc. specifically represents that it does not give investment advice or advocate the purchase or sale of any security or investment whatsoever. This information has been prepared without regard to any particular investors investment objectives, financial situation, and needs. None of the information contained in this document constitutes an offer to sell or the solicitation of an offer to buy any security or other investment or an offer to provide investment services of any kind. As such, advisors and their clients should not act on any recommendation (express or implied) or information in this report without obtaining specific advice in relation to their accounts and should not rely on information herein as the primary basis for their investment decisions. Information contained herein is based on data obtained from recognized statistical services, issuer reports or communications, or other sources, believed to be reliable. SIACharts Inc. nor its third party content providers make any representations or warranties or take any responsibility as to the accuracy or completeness of any recommendation or information contained herein and shall not be liable for any errors, inaccuracies or delays in content, or for any actions taken in reliance thereon. Any statements nonfactual in nature constitute only current opinions, which are subject to change without notice.


