


by Craig Basinger, Derek Benedet, & Brett Gustafson, Purpose Investments
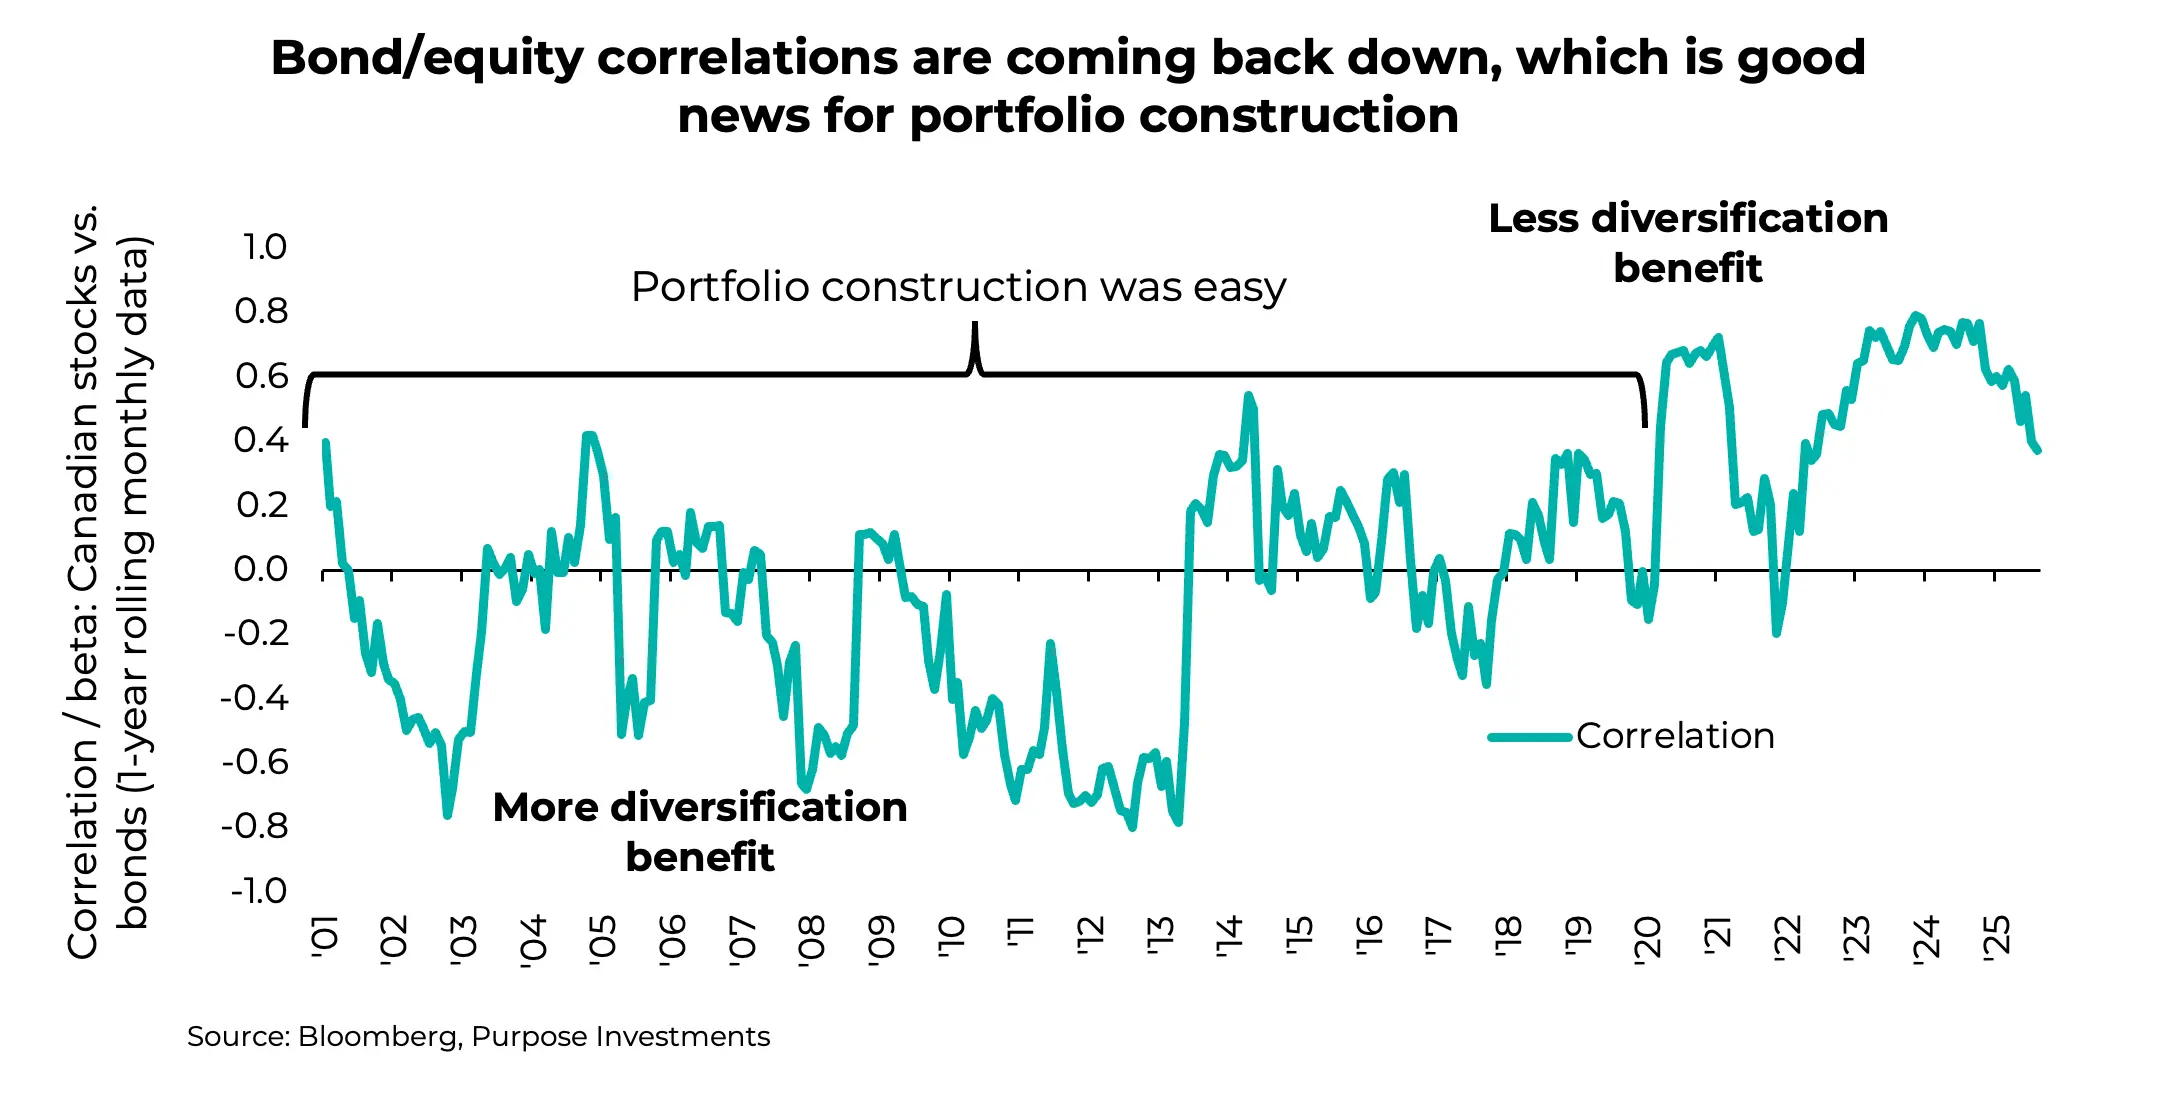
Diversification across different investment asset classes sits as the foundation of portfolio construction. Combining different assets that behave differently in various market regimes provides greater portfolio stability and thus reduces both risk and the likelihood of making a behavioural mistake. We can all remember the 2000-2020 period that witnessed reliable negative correlations between equities and bonds, the cornerstones of most portfolios. And we can all remember the past few years when those correlations moved higher, causing greater portfolio volatility and making diversification harder to find.
One of the reasons correlations moved higher in recent years was the return of a higher inflationary environment. Inflation hasn’t gone away, but it has cooled enough for most central banks to gradually reduce short-term rates. The good news is that the strongly positive correlation between equities and bonds is starting to come back down. Just look at Canadian bonds – measured by the Bloomberg Canada Aggregate – which have declined for six months in a row, precisely what they’re supposed to do when equity markets are moving higher during this period. As a result, the one-year trailing correlation between Canadian equities and Canadian bonds has started to come back down.
We could celebrate this improving correlation trend, but it may be way too soon to pop the cork. Historically, when monetary policy (short-term rates) has been more driven by economic data, mainly focused on price stability, bond/equity correlations have been lower. And when monetary policy has been set more by other factors, correlations have been higher.
Over the past year in the U.S., the spread between actual Fed Funds rates and the Taylor rule has been much higher than normal. The Taylor rule is a guideline for short-term rates based on inflation and economic growth. Even today, the Taylor rule suggests a Fed Funds rate of 6%, a full 1.5% above the current rate. And there’s mounting pressure to cut short-term rates, despite the U.S. economy growing by over 3% and inflation remaining elevated.
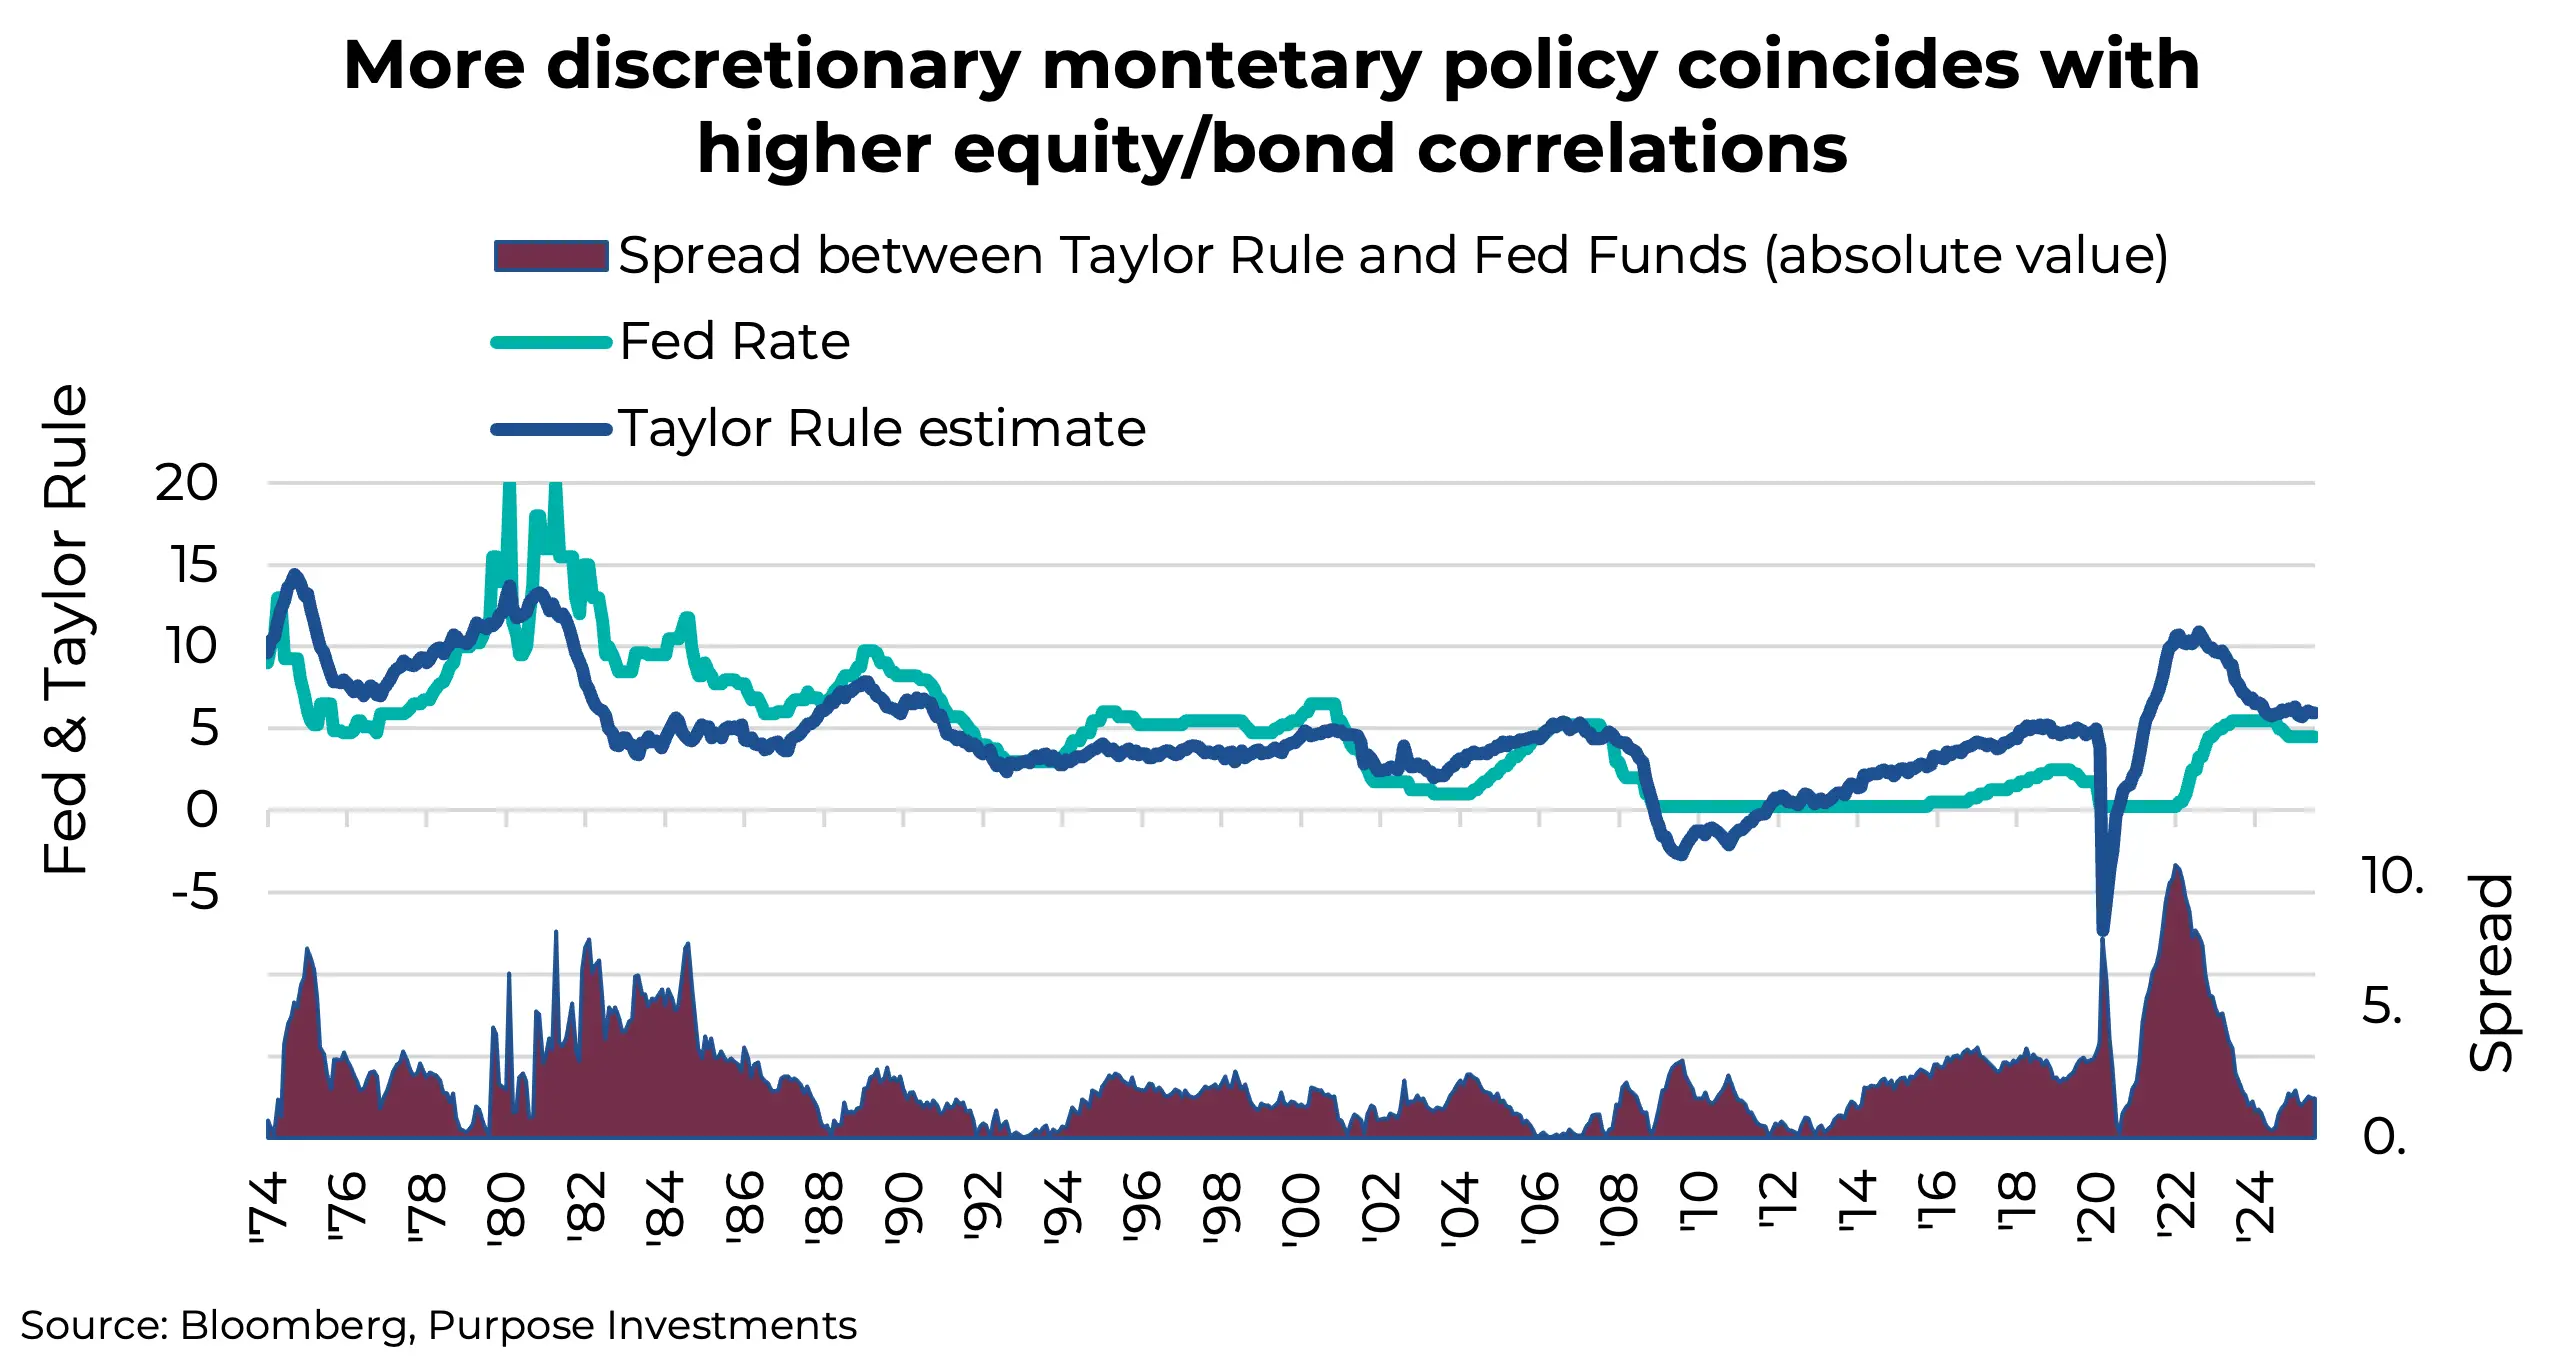
The conclusion is that central bank policy is being driven by other factors outside the economic data. This is not an environment where we should expect bond/equity correlations to move back into negative territory, even though they are improving of late. We believe this also highlights the need to find diversification for portfolios from other sources. On this, there’s good and bad news.
In Search of Portfolio Diversifiers
The tools for constructing well-balanced portfolios have always evolved over time as different strategies with different performance characteristics continue to increase in availability. But correlations are not stable over time, and some investments that were great diversifiers can change to become less so. And if you wait long enough, older options may become great diversifiers once again.
Because of this evolving availability and shifting market correlations, diversifying across different asset classes remains prudent. Bonds were once great diversifiers, then not at all, and are now showing some signs of improvement. The good news is that there are other asset classes that have started to become better diversifiers than in years past, and some that have gone the other way. Here are a few examples:
International equities – The benefits of international equity diversification were extremely strong in the 1980s to 2000 as individual equity markets moved to their own beat. However, as markets became more intertwined, this diversification benefit softened, and then in 2019, correlations between markets were very strong. This greatly reduced the benefits of going more global in portfolios, from a diversification perspective.
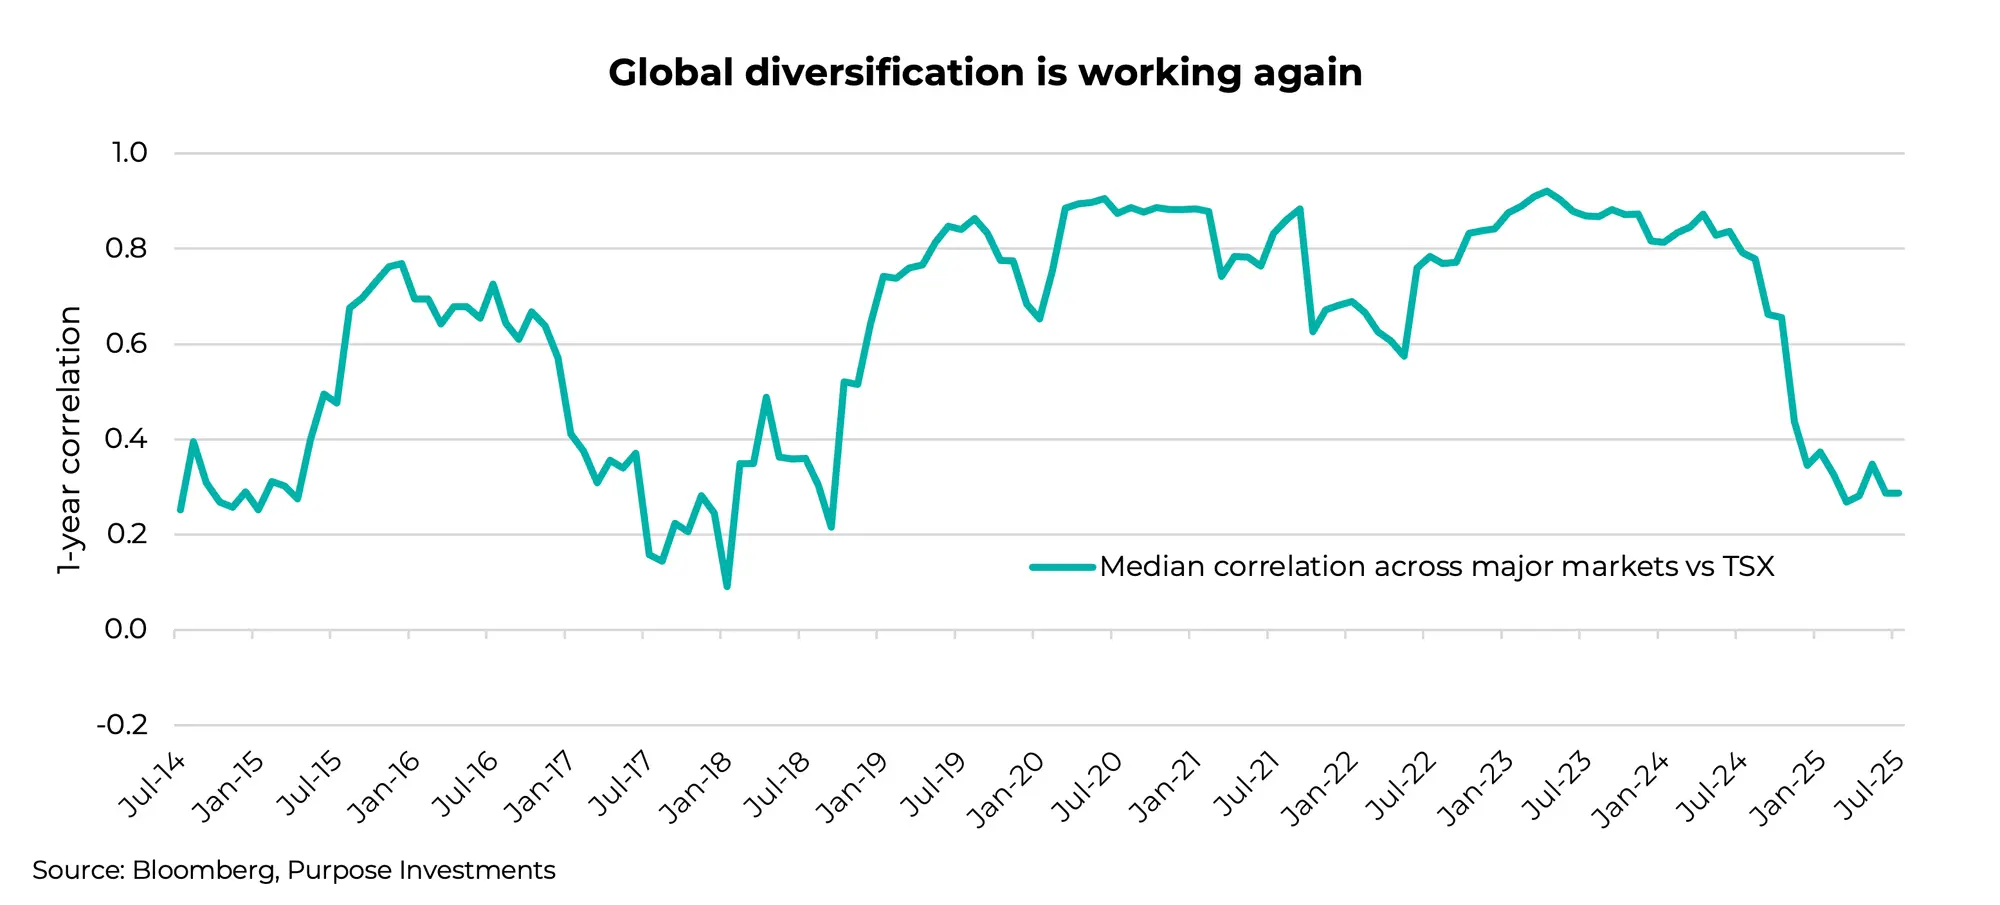
However, this intermarket correlation has dramatically fallen in the past year. Across major equity indices, the median correlation with the TSX has fallen to about 0.3, roughly the lowest correlation in the past 15 years. That certainly adds one more solid reason investors may benefit from increasing international diversification. And while a broad market sell-off certainly drags down all markets, even during the turmoil earlier this year, there were material differences in the pain felt across different markets. Year-to-date performance at the global equity market bottom on April 8th had global equities down -12%, S&P -15%, TSX -9%, UK -3%, Germany +2%, and Hong Kong flat.
In a more polarized world, markets do appear to be diverging, and we believe this provides support for international diversification.
Alternatives – We’re just going to scratch the surface here and have our own disclaimer that, given the diversity of strategies in this space, any sort of aggregation insights have their limits. That being said, alternatives should be better. Scotia’s index is an equal-weight among hedge funds managed by Canadian-domiciled managers. The Liquid Alt line in the chart below is a large selection of liquid alts available in Canada (48) with very different strategies. This is the rolling median correlation among them vs the TSX
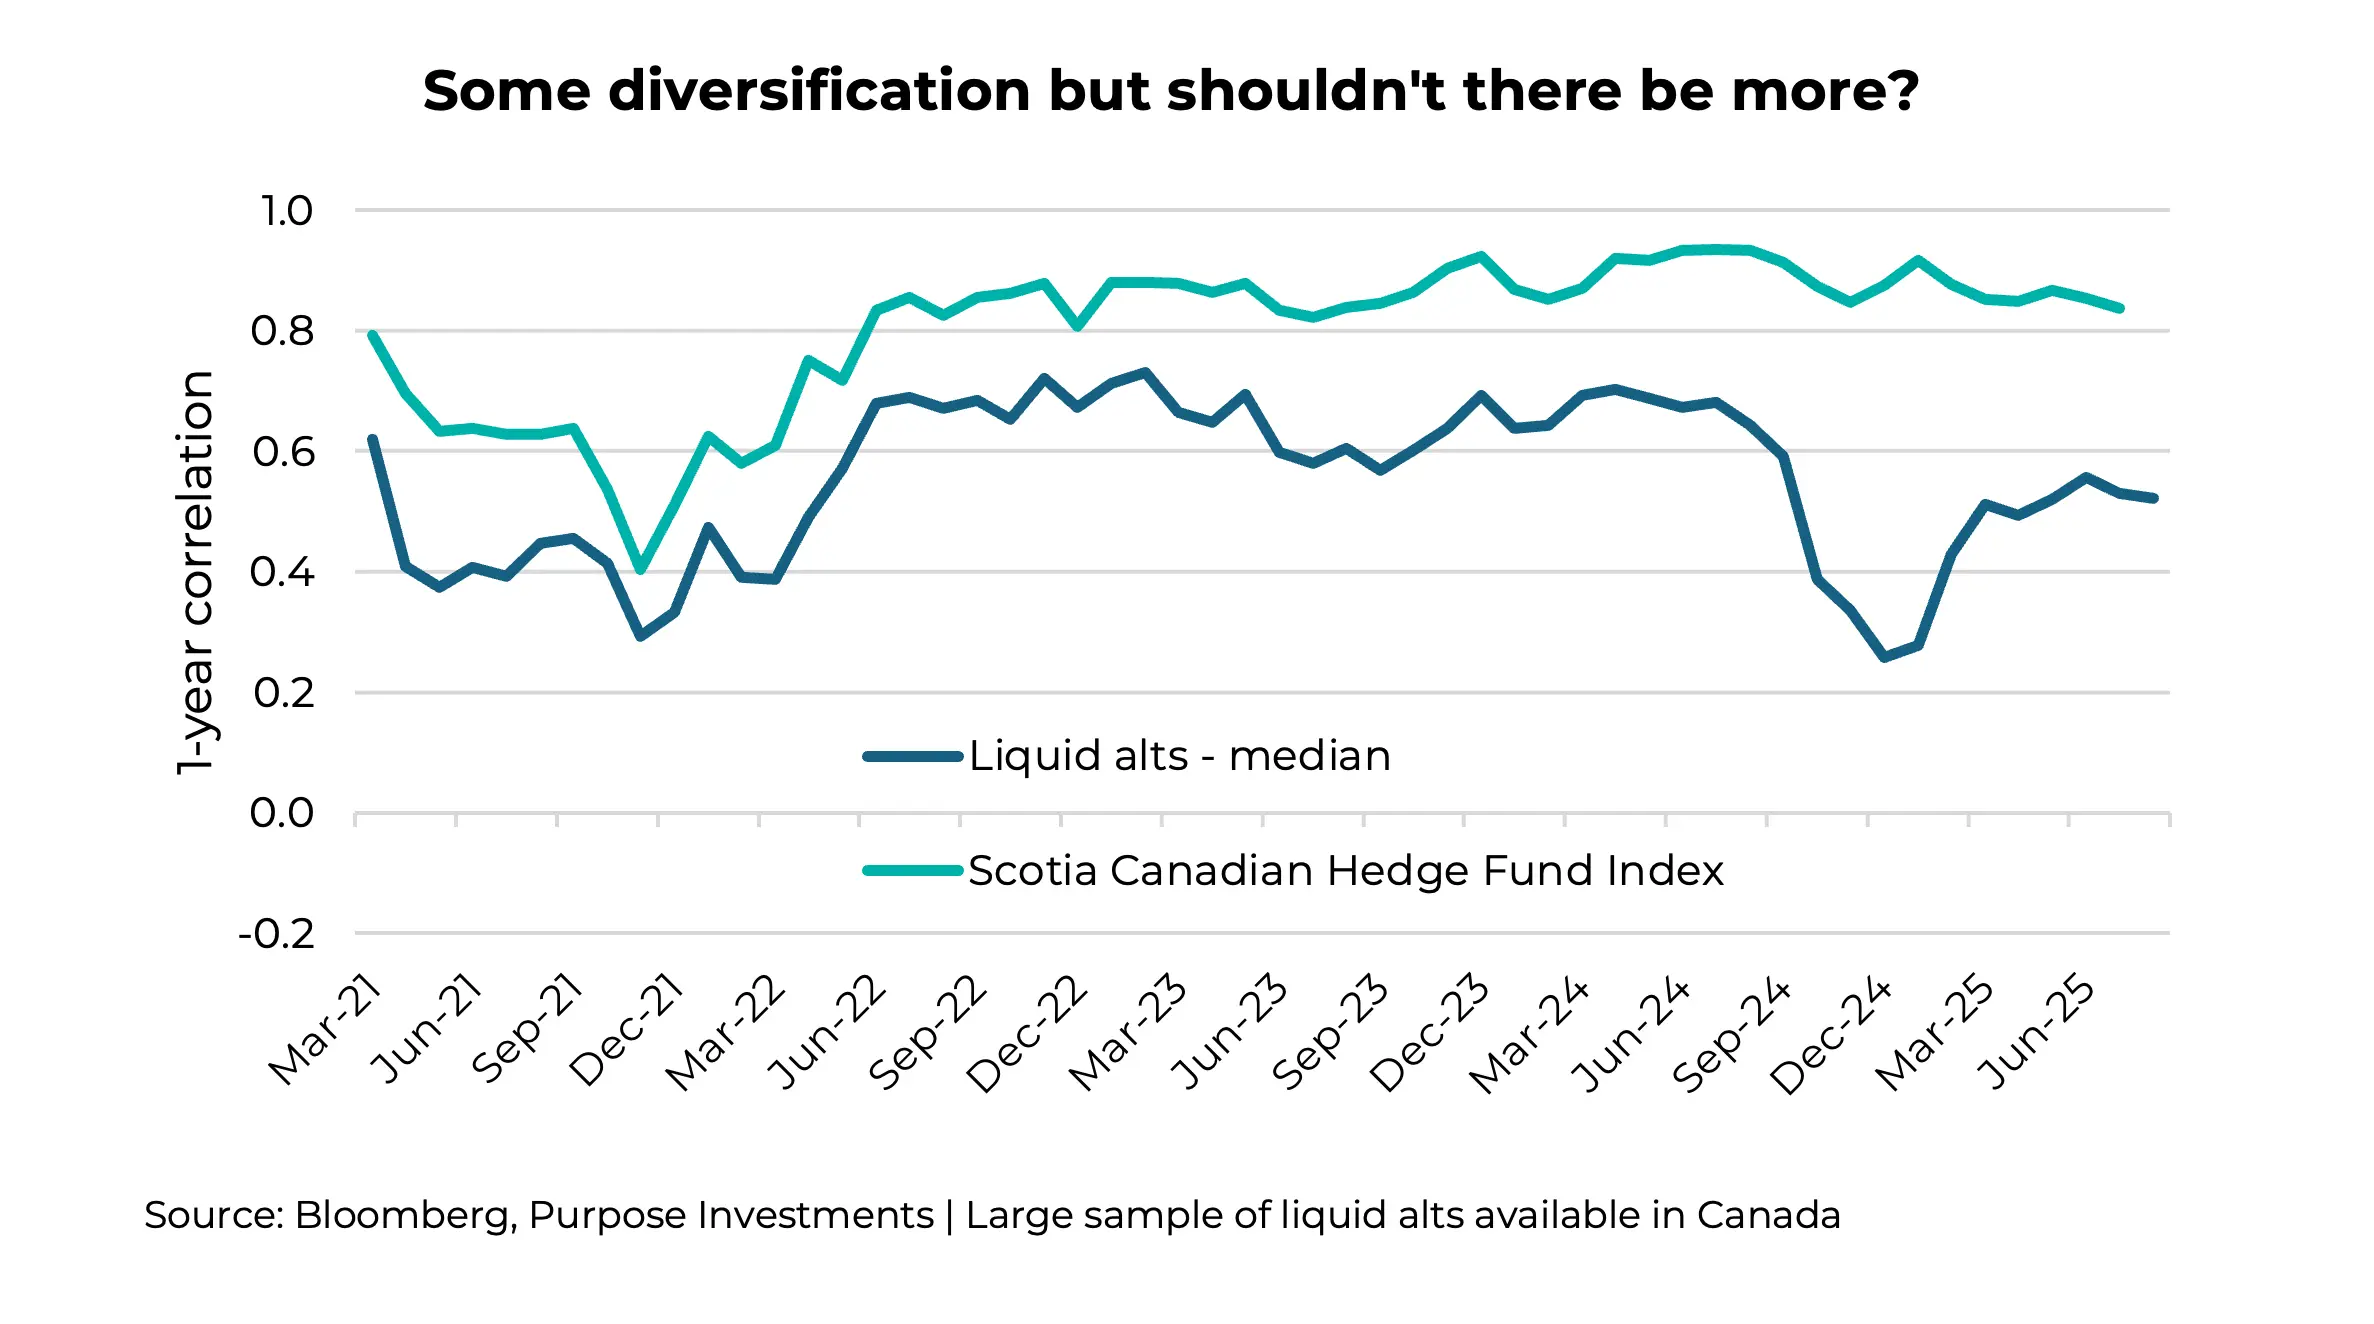
The variance among different strategies is large. There are many that are great diversifiers against market risks, and there are many that are really just equity exposure with a few twists. A higher level of due diligence is required, and understanding a position’s purpose within a portfolio is critical.
We believe alternatives are certainly a source of diversification for portfolios, but with extra research and due diligence required.
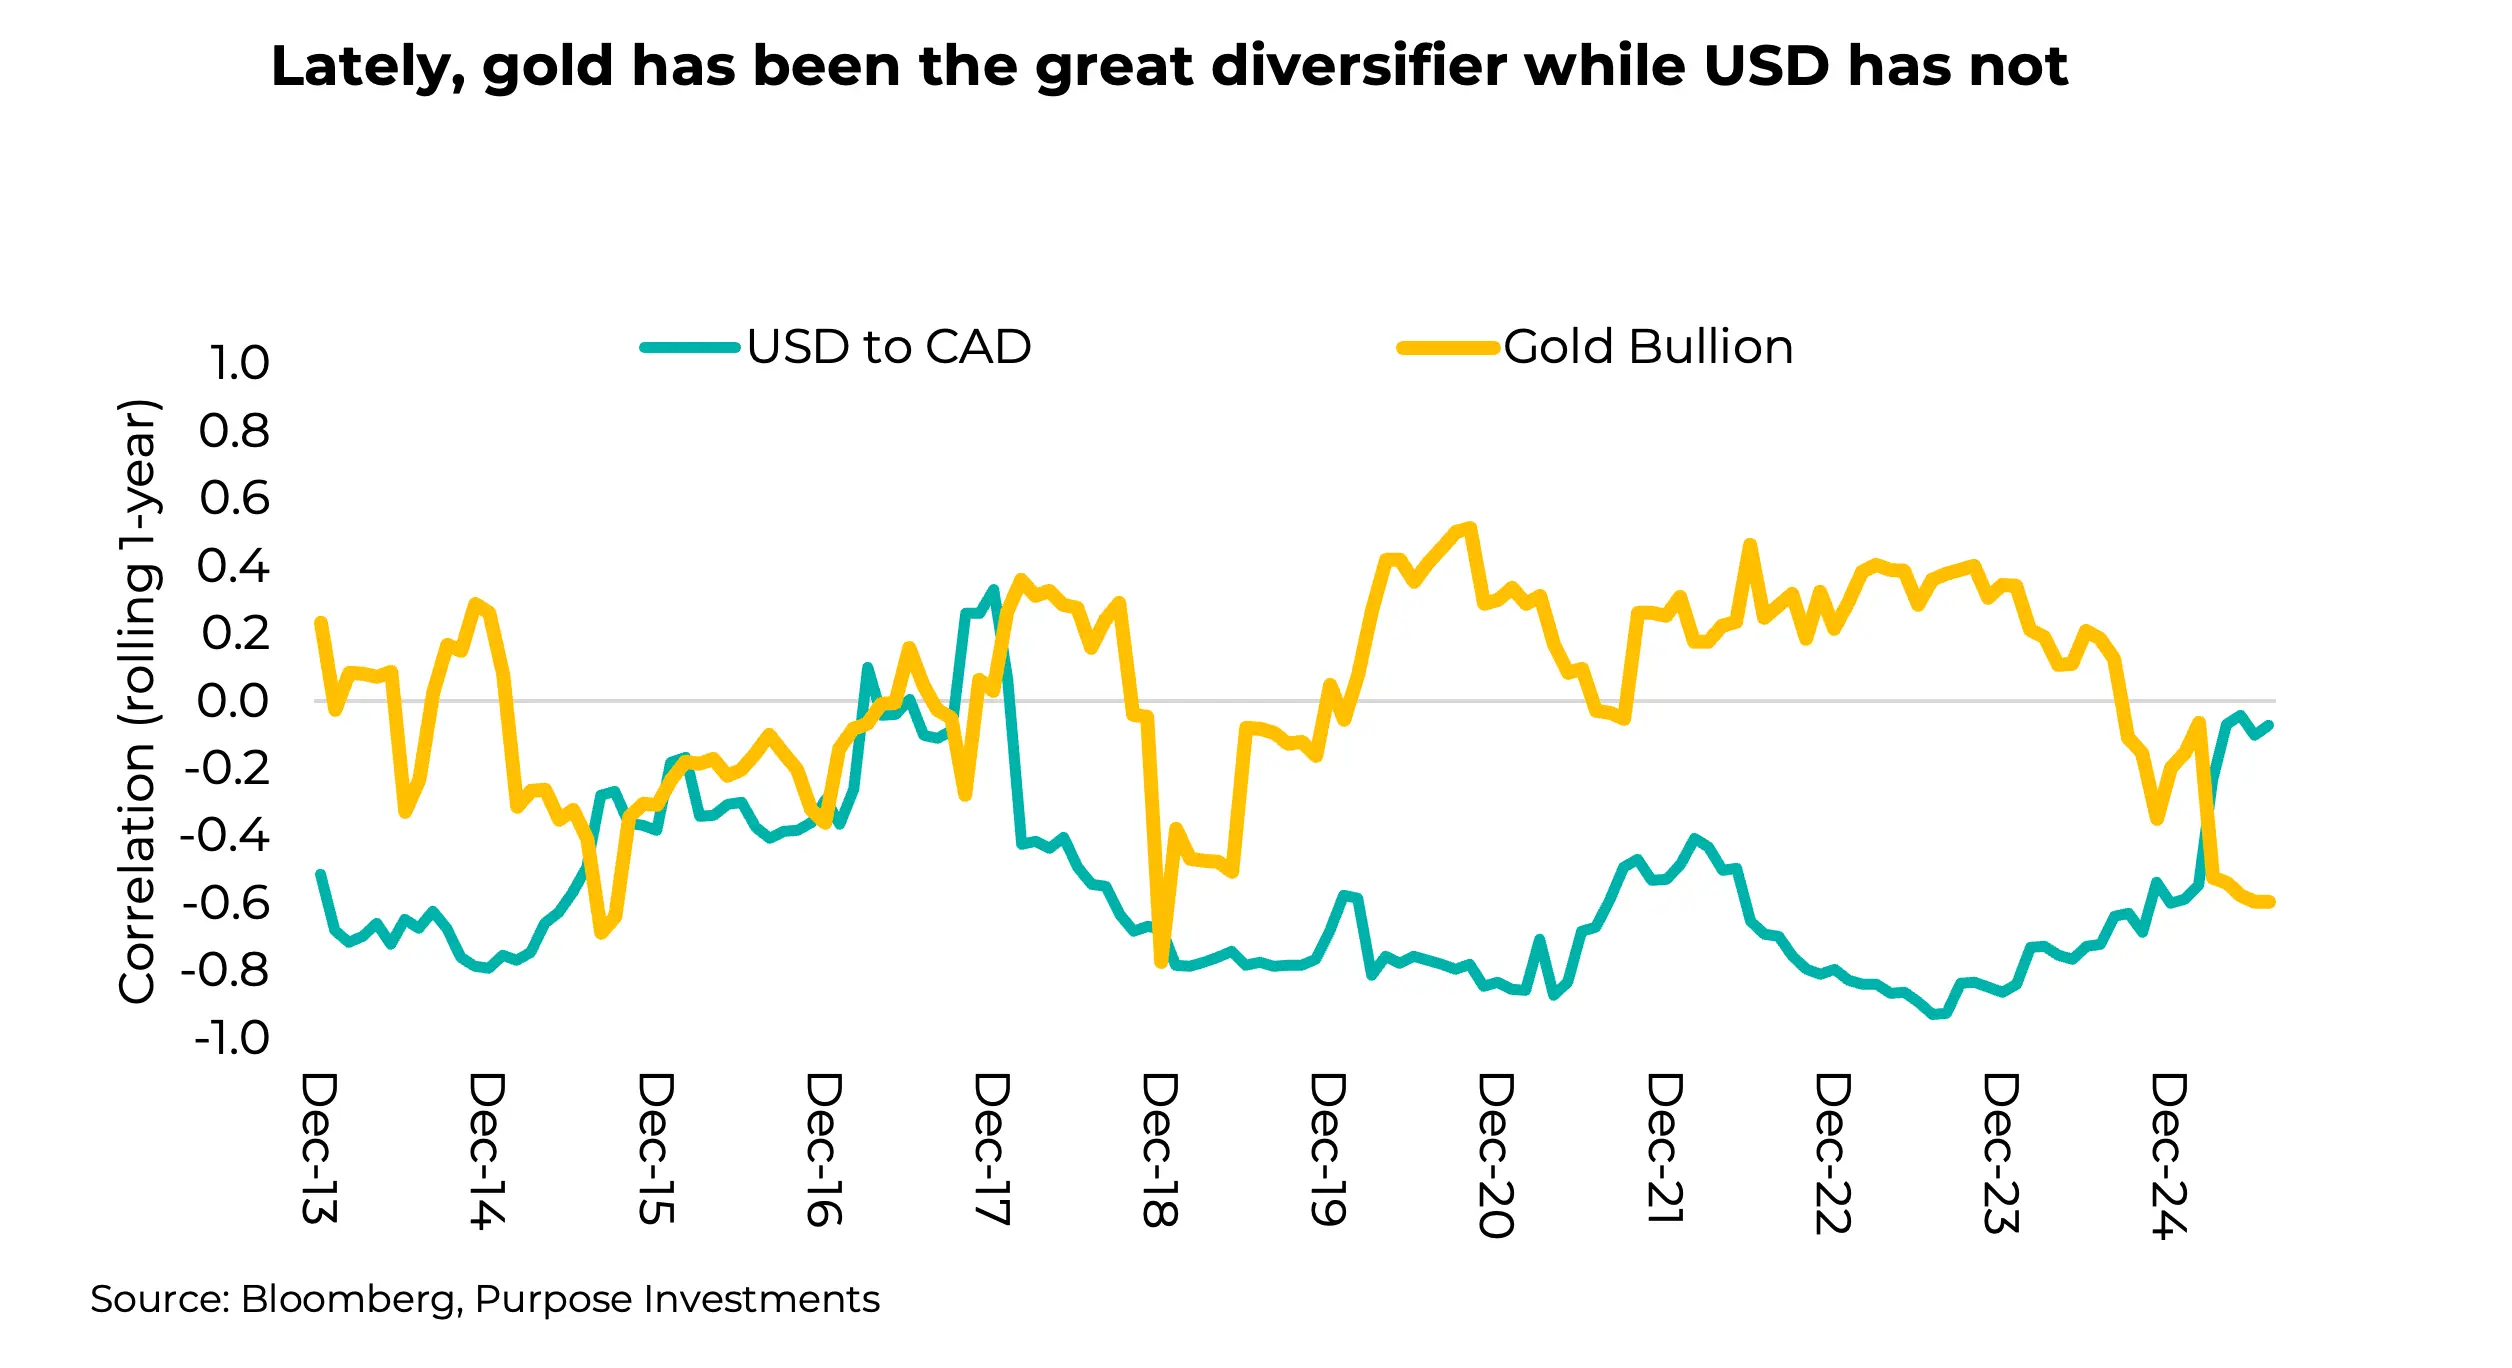
Currencies & Gold – There’s a general rule for Canadian portfolios: the U.S. dollar is great. History has shown that when there are periods of market weakness, the U.S. dollar often rises in value, providing a very valuable source of portfolio diversification. This happens for a few reasons. Most periods of market weakness can be traced back to concerns over economic growth. Given that the U.S. is less sensitive to global trade than other nations (including Canada), is the global reserve currency, and when trouble comes, many investors bring their money back home to America, the U.S. dollar tends to rise during times of trouble.
However, since recent central bank independence questions and policy uncertainty are homegrown in America, this diversification benefit is offset. So it’s not too surprising that, with the volatility of the past year, the U.S. dollar has not been a good diversifier. In fact, it’s been the opposite. Taking its place has been gold, which has done really well as a diversifier during periods of policy uncertainty.
Final Note – We would say that bonds may not be as good a diversifier as during the previous decade, but they still do provide a reasonable amount. And given that yields are now higher, they also have more of a potential contribution to overall performance. The good news is that there are other sources of diversification from greater international allocations, alternatives, commodities, and even the U.S. dollar.
Choosing the right diversifier will really depend on what the next period of weakness looks like. If it’s a period of economic weakness, bonds and USD may work best; less so for gold and international. Or if it’s another flare-up in policy uncertainty, it could be the exact opposite.
Best to find diversification from a few key sources to best diversify your diversification.
The Great Canadian Disconnect
From an investment perspective, Canada presents a puzzling picture so far this year. On one hand, the stock market is enjoying significant gains, but on the other, the country’s economic health remains rather weak. The S&P/TSX Composite Index has risen approximately 17% year-to-date, better than many global markets; meanwhile, the Canadian economy continues to limp along. This disconnect highlights that the market’s performance is less a reflection of a strong Canadian recovery and more a function of global commodity trends and data that have bested overly pessimistic expectations. “The market is not the economy” is a common saying, but the experience this year in Canada is especially true.
Canada’s economy contracted 1.6% annualized in Q2, the sharpest decline in GDP since the pandemic and worse than the 0.7% decline expected. This slowdown was primarily driven by weaker exports due to trade tariffs, slower local spending, and ongoing issues with low productivity and a lack of business investment. June marked the third straight monthly decline in GDP. None of these drivers appears to be turning the corner very quickly, which puts Q3 on a knife-edge.
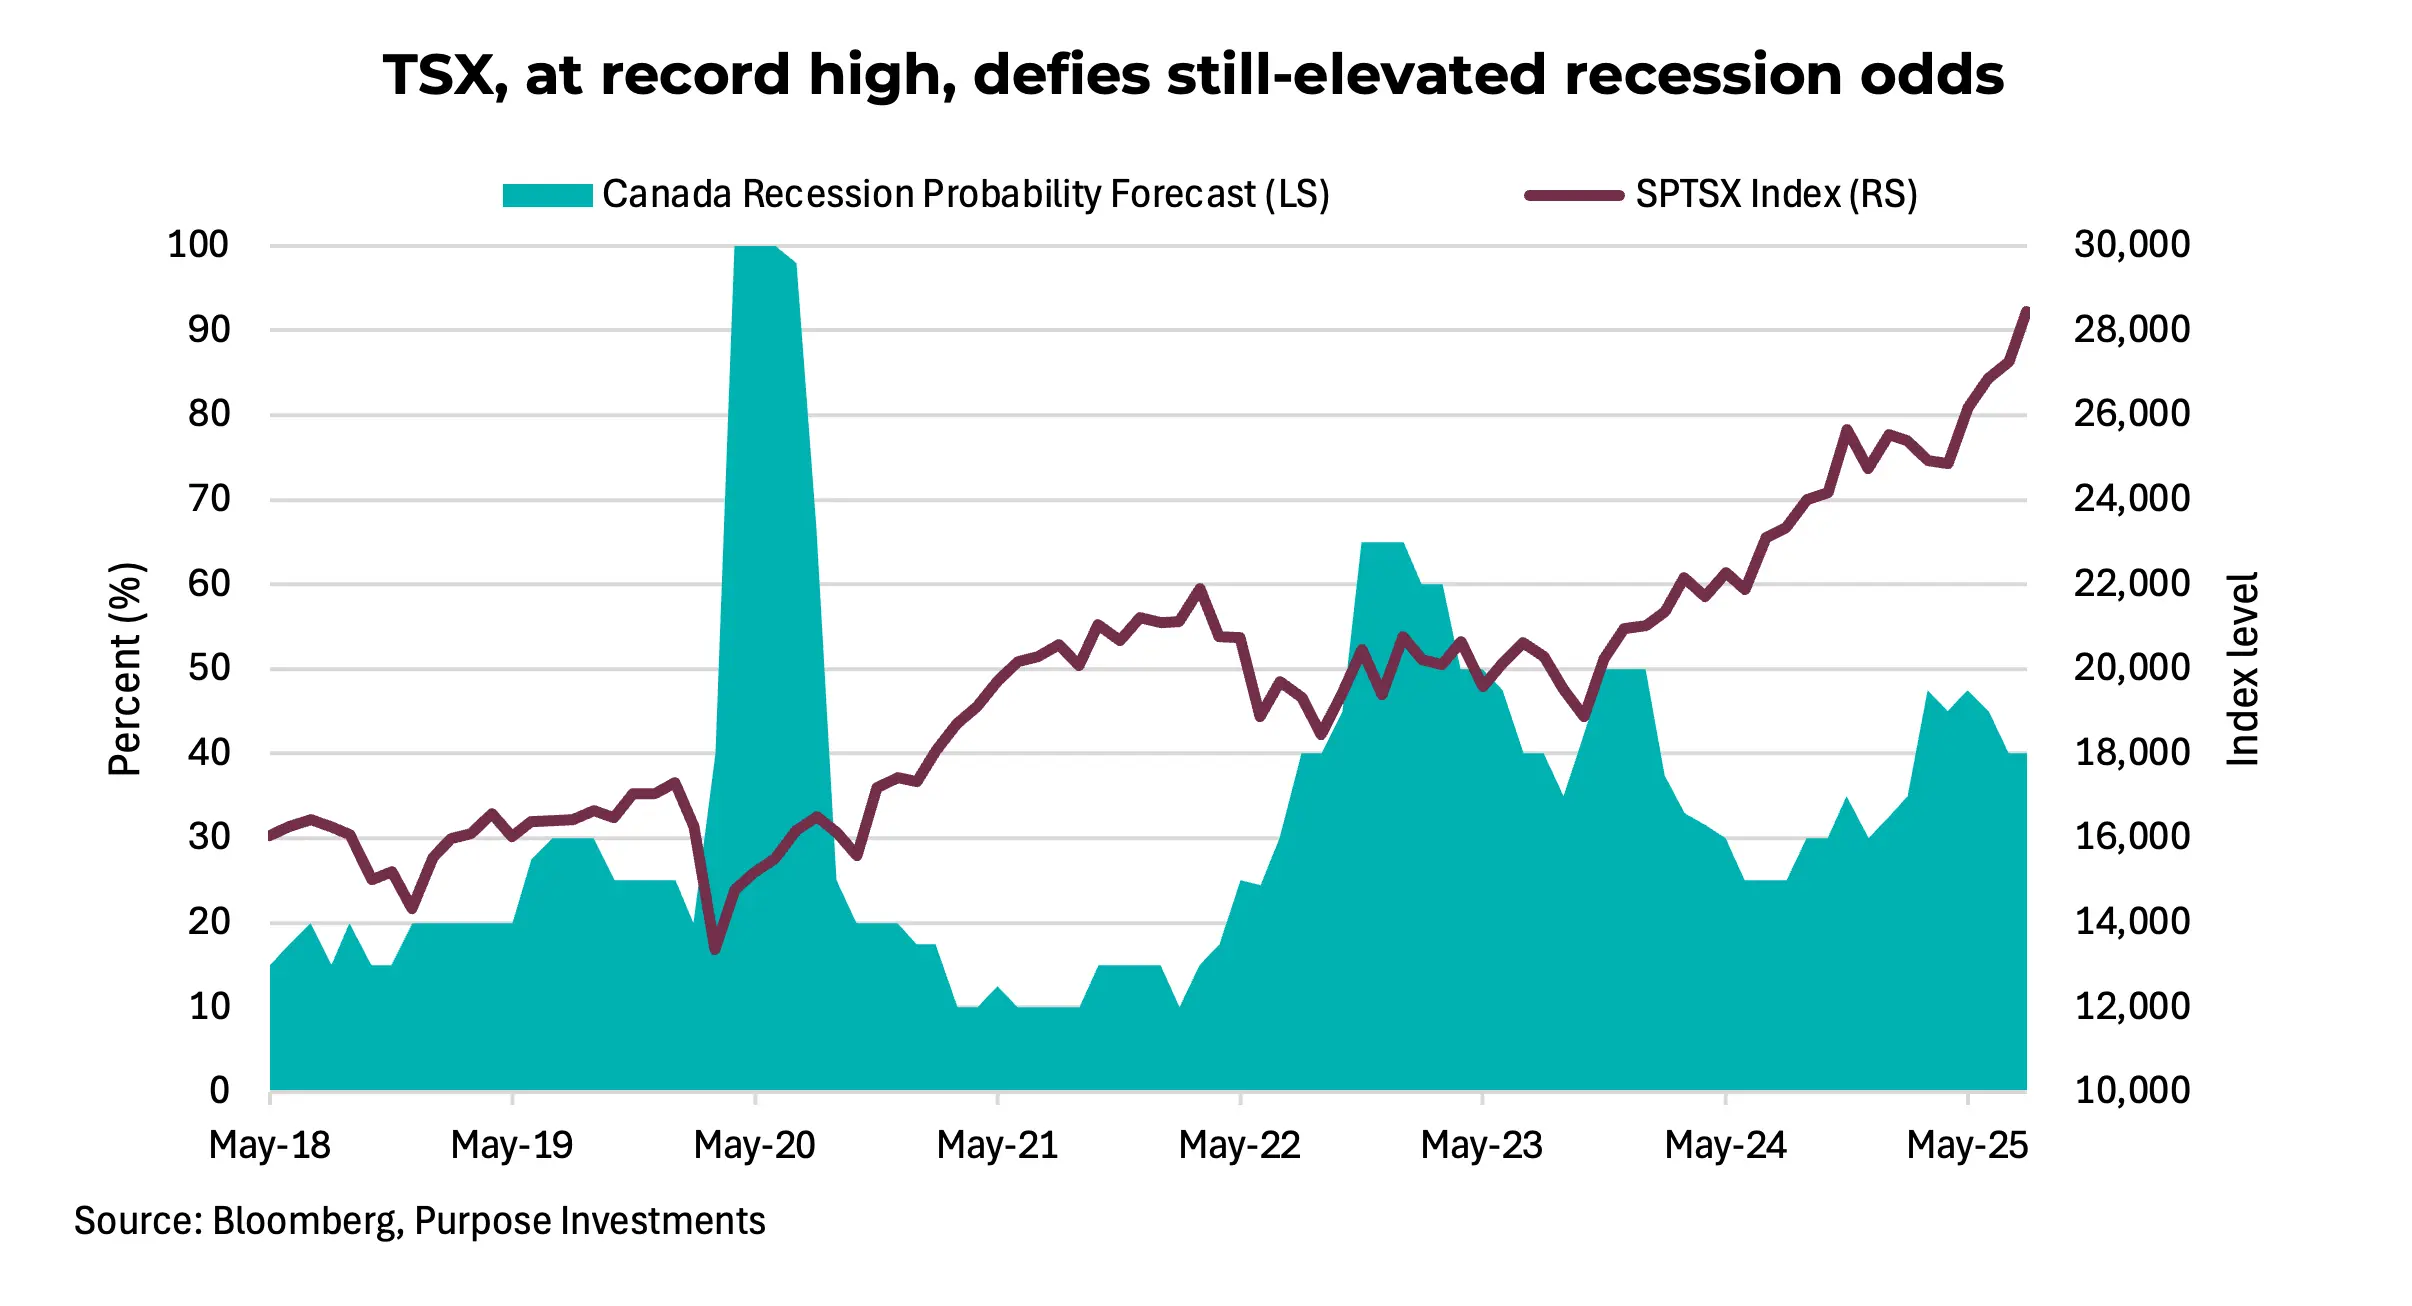
The median forecast currently stands at just 0.2%, with 8 of 19 economists expecting a negative Q3, underscoring the very real risk of a technical recession. The chart below illustrates the dramatic disconnect quite neatly. Recession risk currently stands around 40% over the next twelve months; meanwhile, the TSX is flying high. Typically, when recession risks are this elevated, the market shows some sense of caution or elevated risk aversion. Not so this year.
It’s not all gloom and doom. The story for consumers and the job market is somewhat mixed. Real-time data from credit card transactions and service sector activity point towards some stabilization, but this is still a far cry from a robust reacceleration. StatsCan’s latest retail survey shows that spending on essential consumer categories is holding up, but consumer spending is somewhat uneven across discretionary segments.
The unemployment rate has climbed to 6.9%, the highest since the post-Covid recovery. While high, the unemployment rate has levelled off around the average levels seen between 2013 and 2016. July’s weak employment print (-40k jobs), while subject to Canada’s typical monthly volatility, does point to continued signs of softening. The growth in average weekly earnings has also cooled, which reduces the pressure for inflation caused by higher wages but also signals a tightening pocketbook.
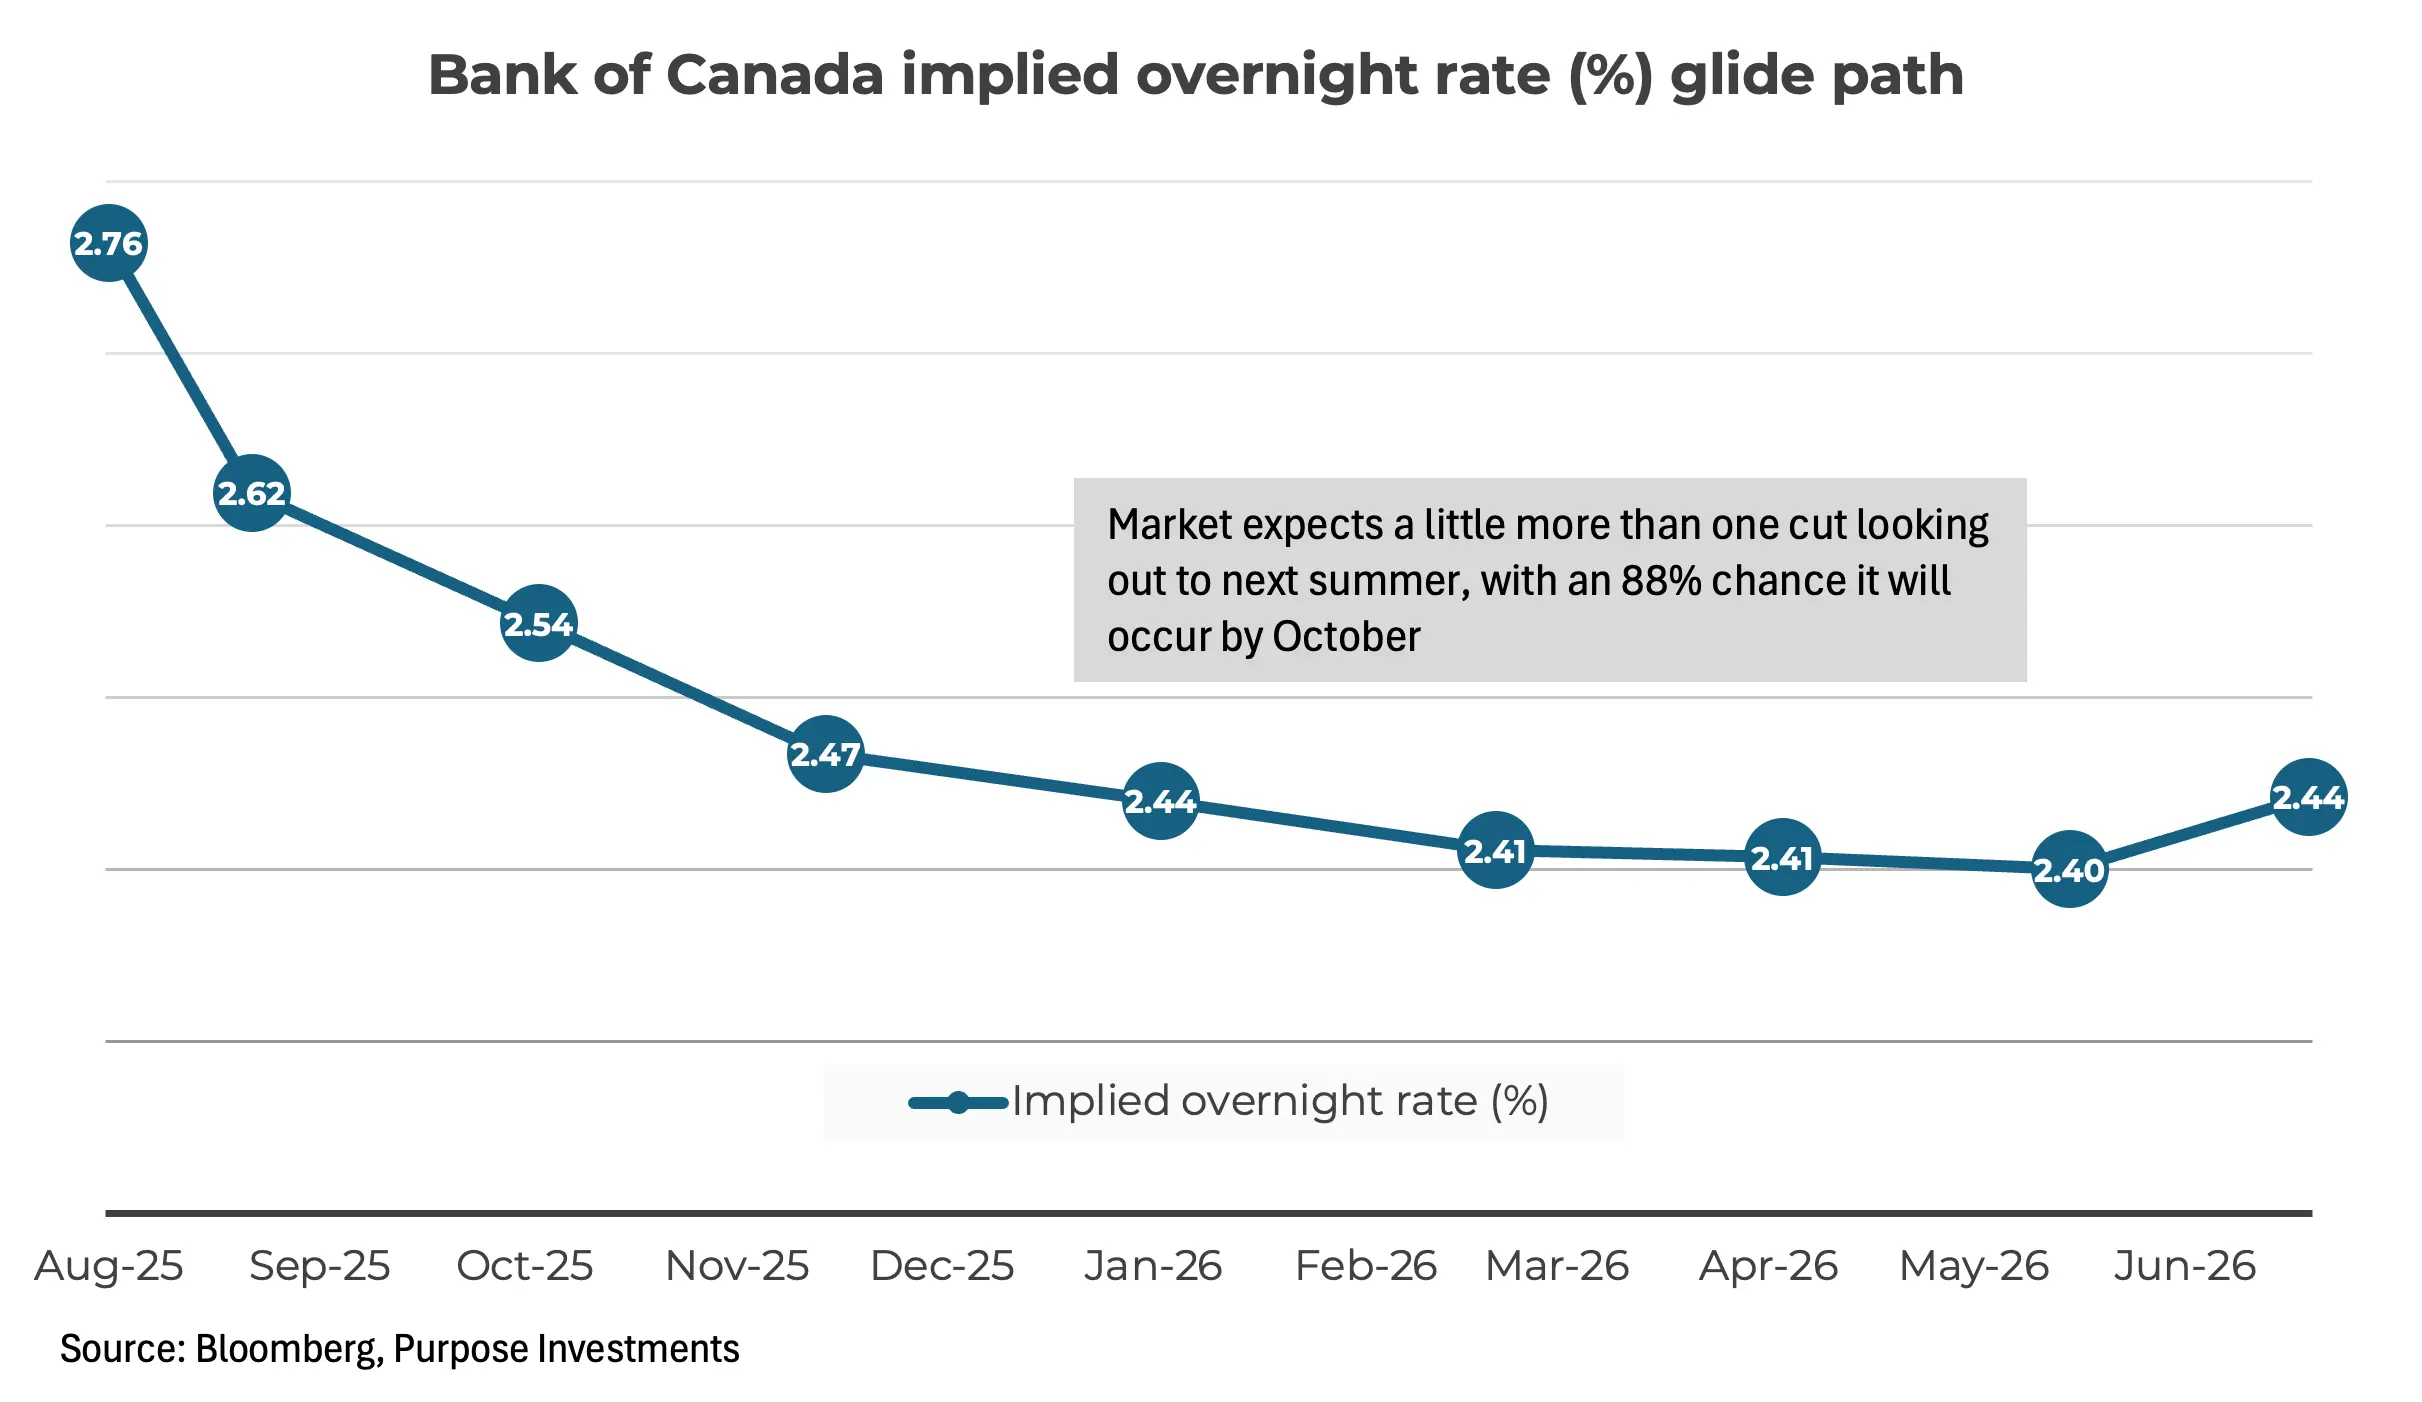
When it comes to monetary policy, inflation is really the only key variable. Overall, headline inflation is now below the Bank of Canada’s 2% target, but core inflation measures are still elevated around 2.5%. The good news is that the disinflationary trend should continue. The Bank of Canada has already cut the overnight lending rate by 225 bps since last June. It’s been on hold since March, but there are increased expectations that the Bank of Canada may cut rates again this year. The market is pricing in a little over one cut looking out to next summer, with the most likely timing coming this year. Despite this, business sentiment remains depressed, with the Business Outlook Survey revealing a lack of confidence impacting capital expenditures and hiring plans. There are some green shoots and efforts to improve interprovincial trade that, while positive, are not a complete fix for the problems facing the economy.
Perhaps the biggest problem remains the housing market, which used to be a key driver of growth. New home prices have been flat since early 2022 and are now starting to drift lower. Developers are struggling with the reality of overpriced units sitting and a reluctance to reprice. While lower interest rates should eventually help with affordability, the full impact of higher debt on households will make housing recovery slow and bumpy well into 2026. This sensitivity to household debt and a fragile housing market continues to be a key risk for the Canadian economy, but the worst-case expectations have thus far failed to materialize.
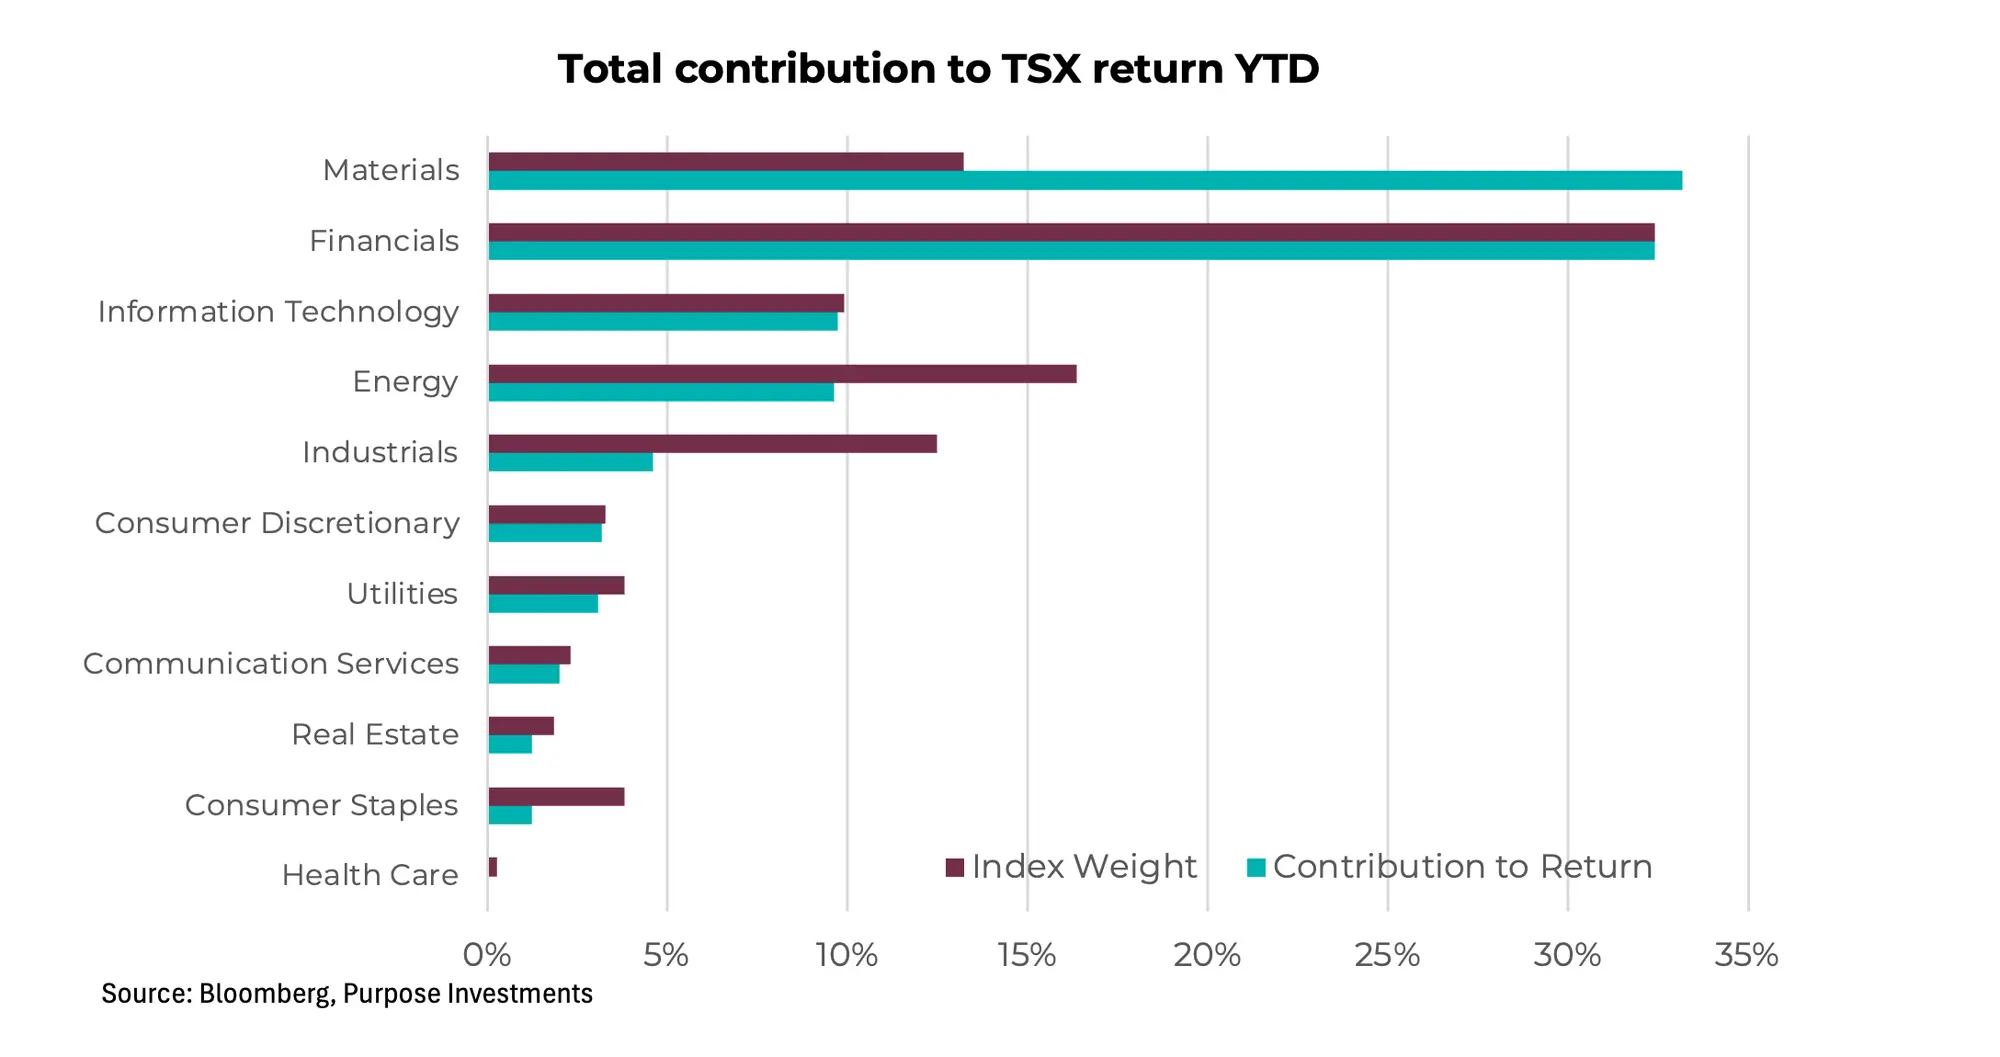
The outsized performance of the TSX this year, therefore, cannot be viewed as a sign of broad-based economic health. Its 17% gain is highly concentrated, with a significant portion attributed to the Materials (33%) and Financial (32%) sectors. Given the high index weight and strong returns across a number of banks this past week, Financials are contributing exactly what would be expected given their 32% weight in the TSX. Miners are punching well above their weight, which has more than offset weaker contributions from Energy and Industrial sectors.
In terms of what’s driving earnings, the majority of growth is coming from the Materials, Energy, and Financial sectors. Roughly 45% of the TSX’s Q3 earnings growth is expected to come from gold producers. Banks rallied on better-than-feared results: lower credit provisions, resilient capital markets revenue, and strong capital ratios. Loan growth is subdued, consistent with soft domestic demand, but the risk of serious credit losses is clearly receding, with gradual easing supporting household and business resilience. These sectors are either tied to global commodity prices or are benefiting from a “soft-landing” narrative rather than robust domestic activity. This reality underscores the key takeaway: while the Canadian stock market has been strong, it is not a good indicator for the domestic economy, which remains soft.
Looking ahead, a close eye must be kept on GDP prints to see if the negative Q2 and near-flat Q3 forecasts are confirmed, which would keep recession talk alive. Labour market trends, particularly the unemployment rate and wage growth, while lagging indicators, are important for gauging consumer health. Overall, the TSX is now trading at 16.5x, still cheap compared to the U.S., but it’s now somewhat expensive compared to the 10-year average PE of 15x.
Ultimately, while Canada has surprised positively in the near term, the economy is not yet out of the woods. Structural imbalances, elevated household leverage, and external headwinds mean that a cautious outlook remains warranted, especially for areas of the market that are domestically exposed.
Market Cycle & Portfolio Positioning
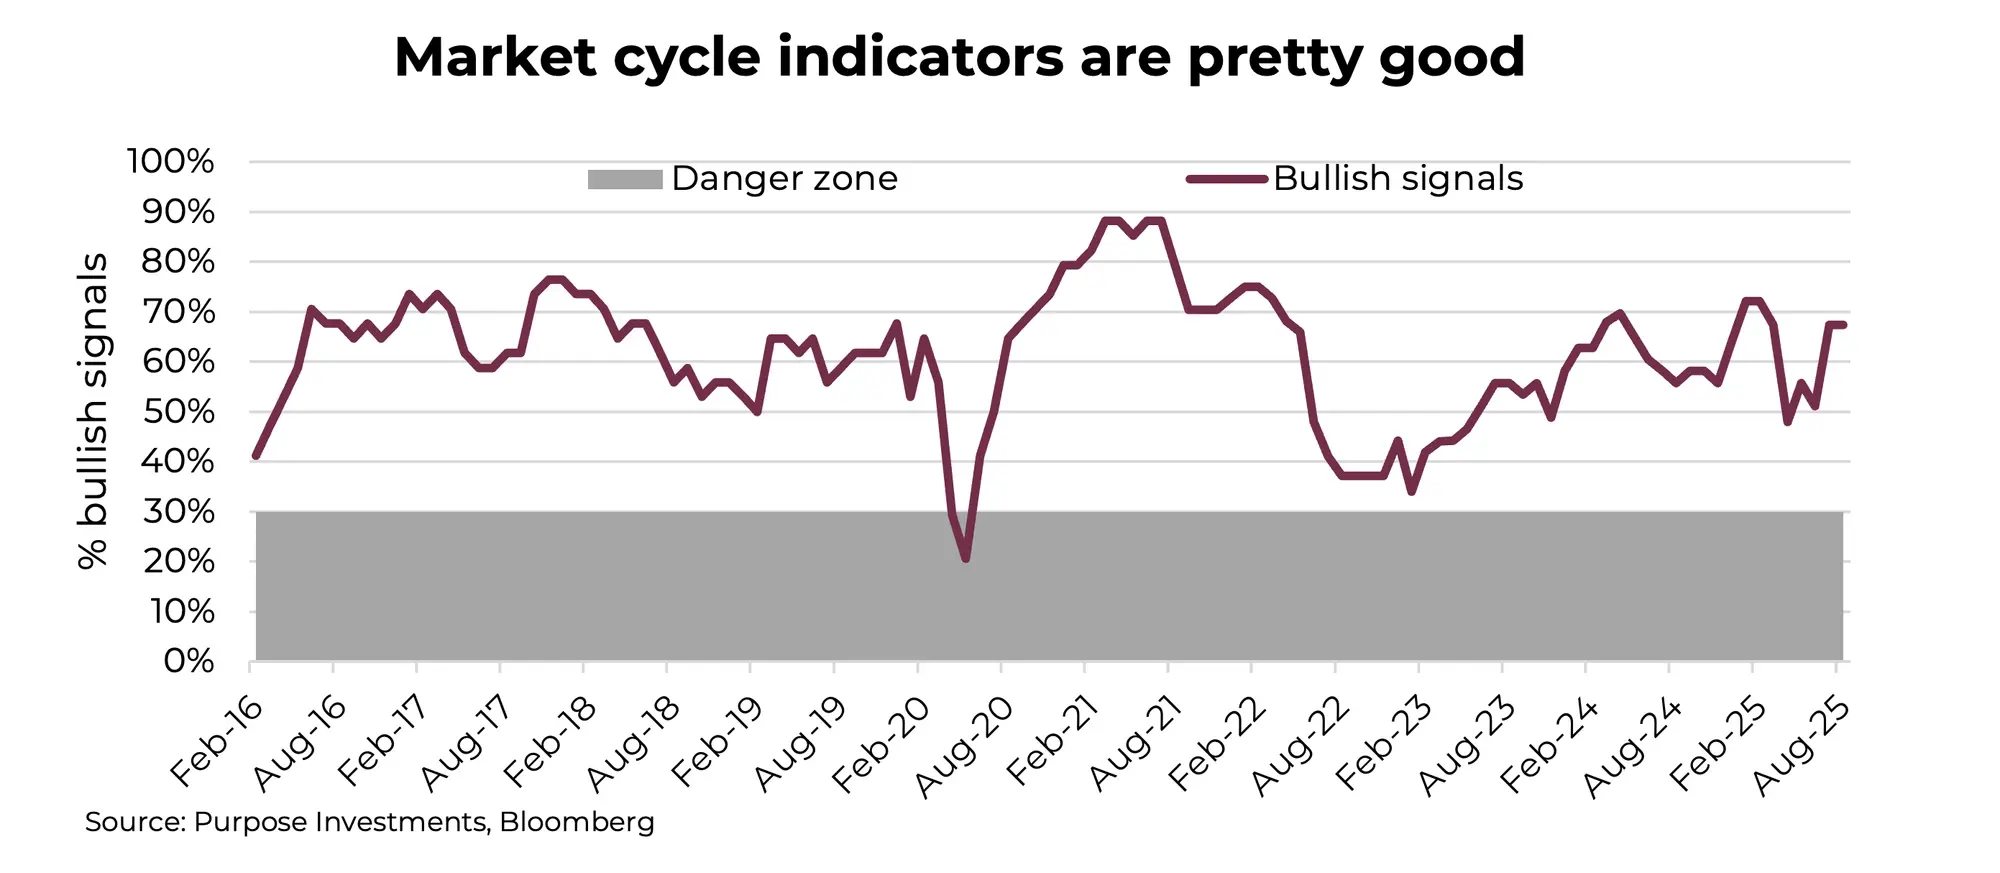
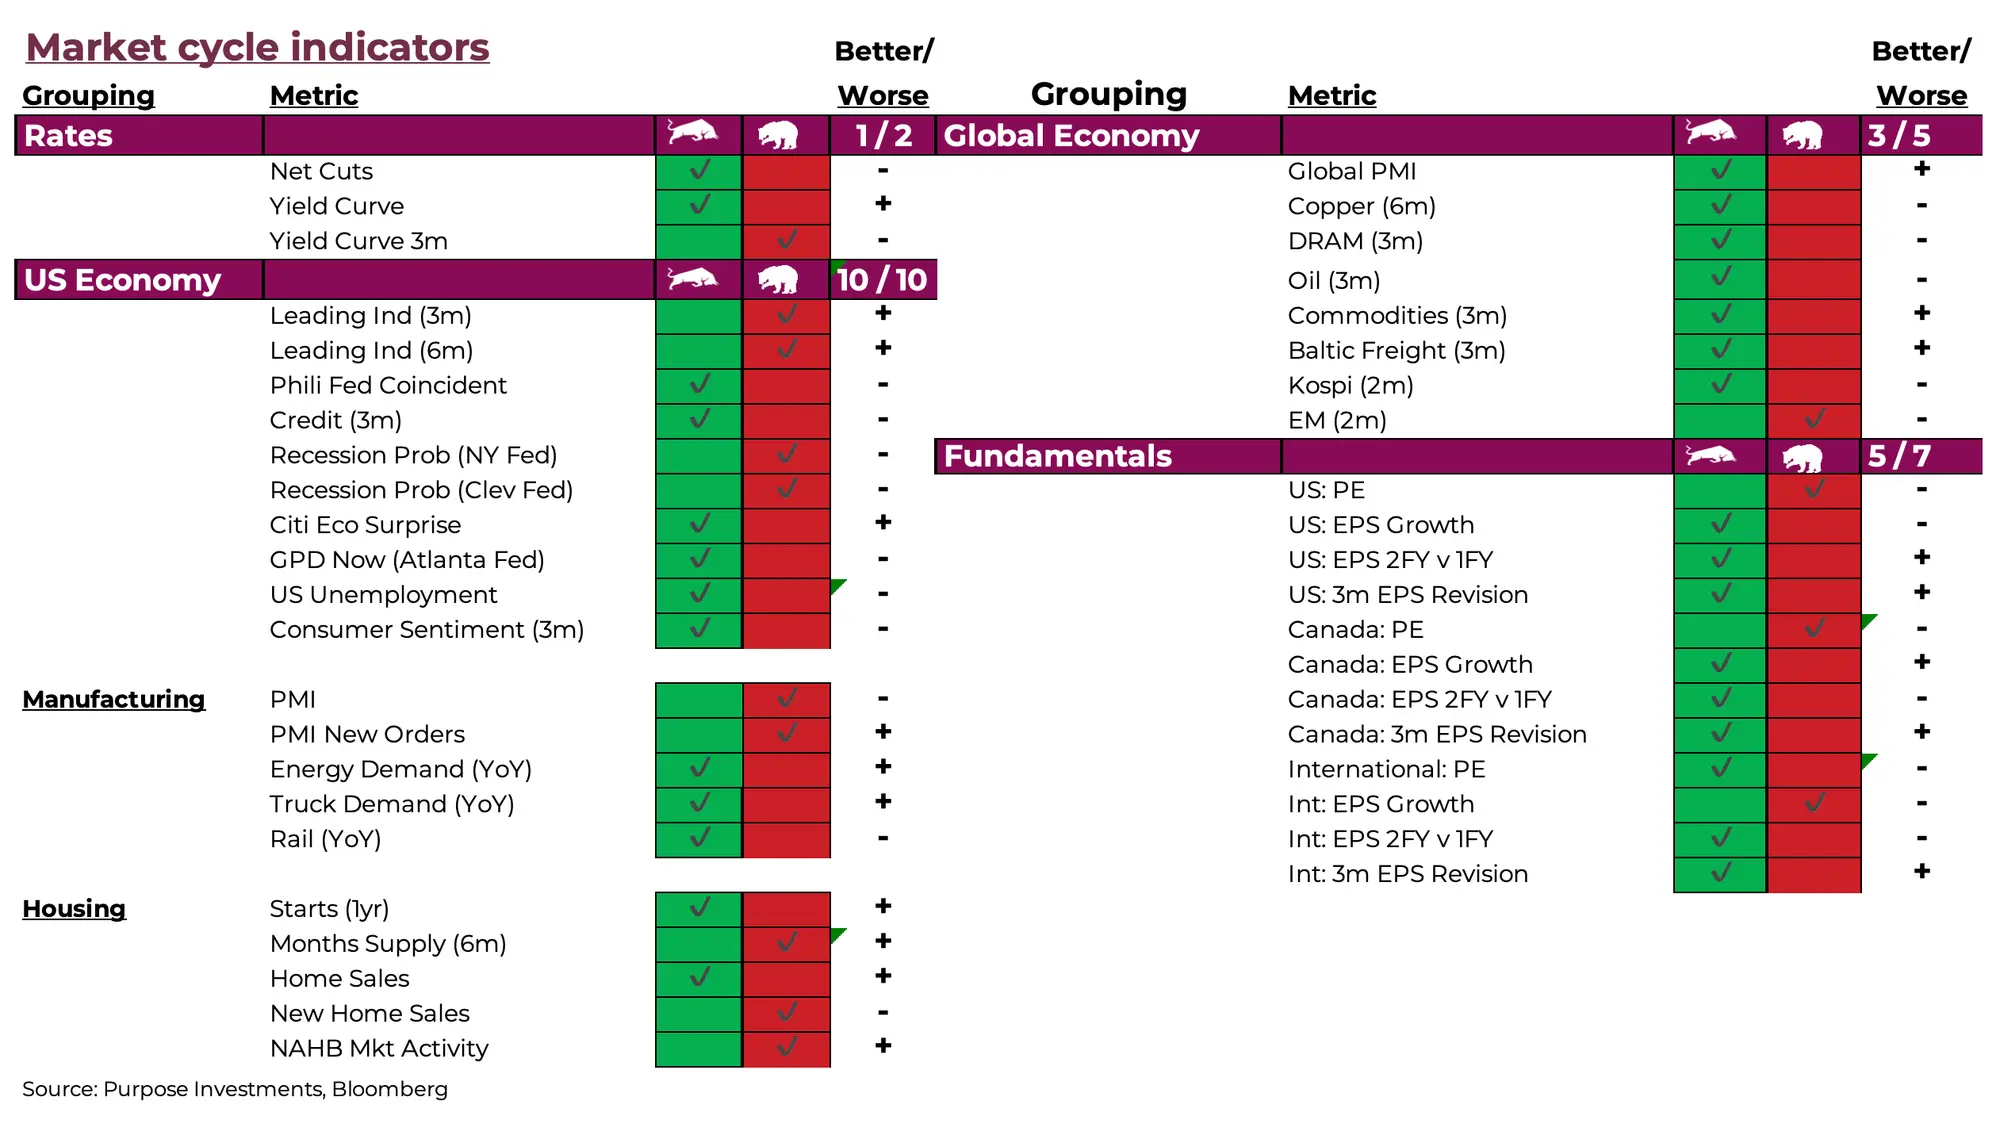
Market cycle indicators were flat with this time last month, but with a few moving pieces beneath the surface. The yield curve signals are rather flip-floppy at the moment, with short and long-term yields in the U.S. just about the same. The yield curve may be positively sloped, but it’s hard to notice with three-month yields at 4.17 and 10-year yields at 4.22. On a positive note for the U.S. economy, housing saw some signs of improvement, as did overall energy demand. It does look like that slowdown we had been expecting later this year is gradually becoming less probable.
With the U.S. net up two signals, there were two negatives elsewhere to get the total back to flat on the month. Emerging markets rolled over a bit after strong gains this year, which gave a bearish signal for global growth. We would not be too concerned, given that all the other global growth indicators are healthy. Plus, international EPS growth slowed a bit.
Overall, things are relatively stable.
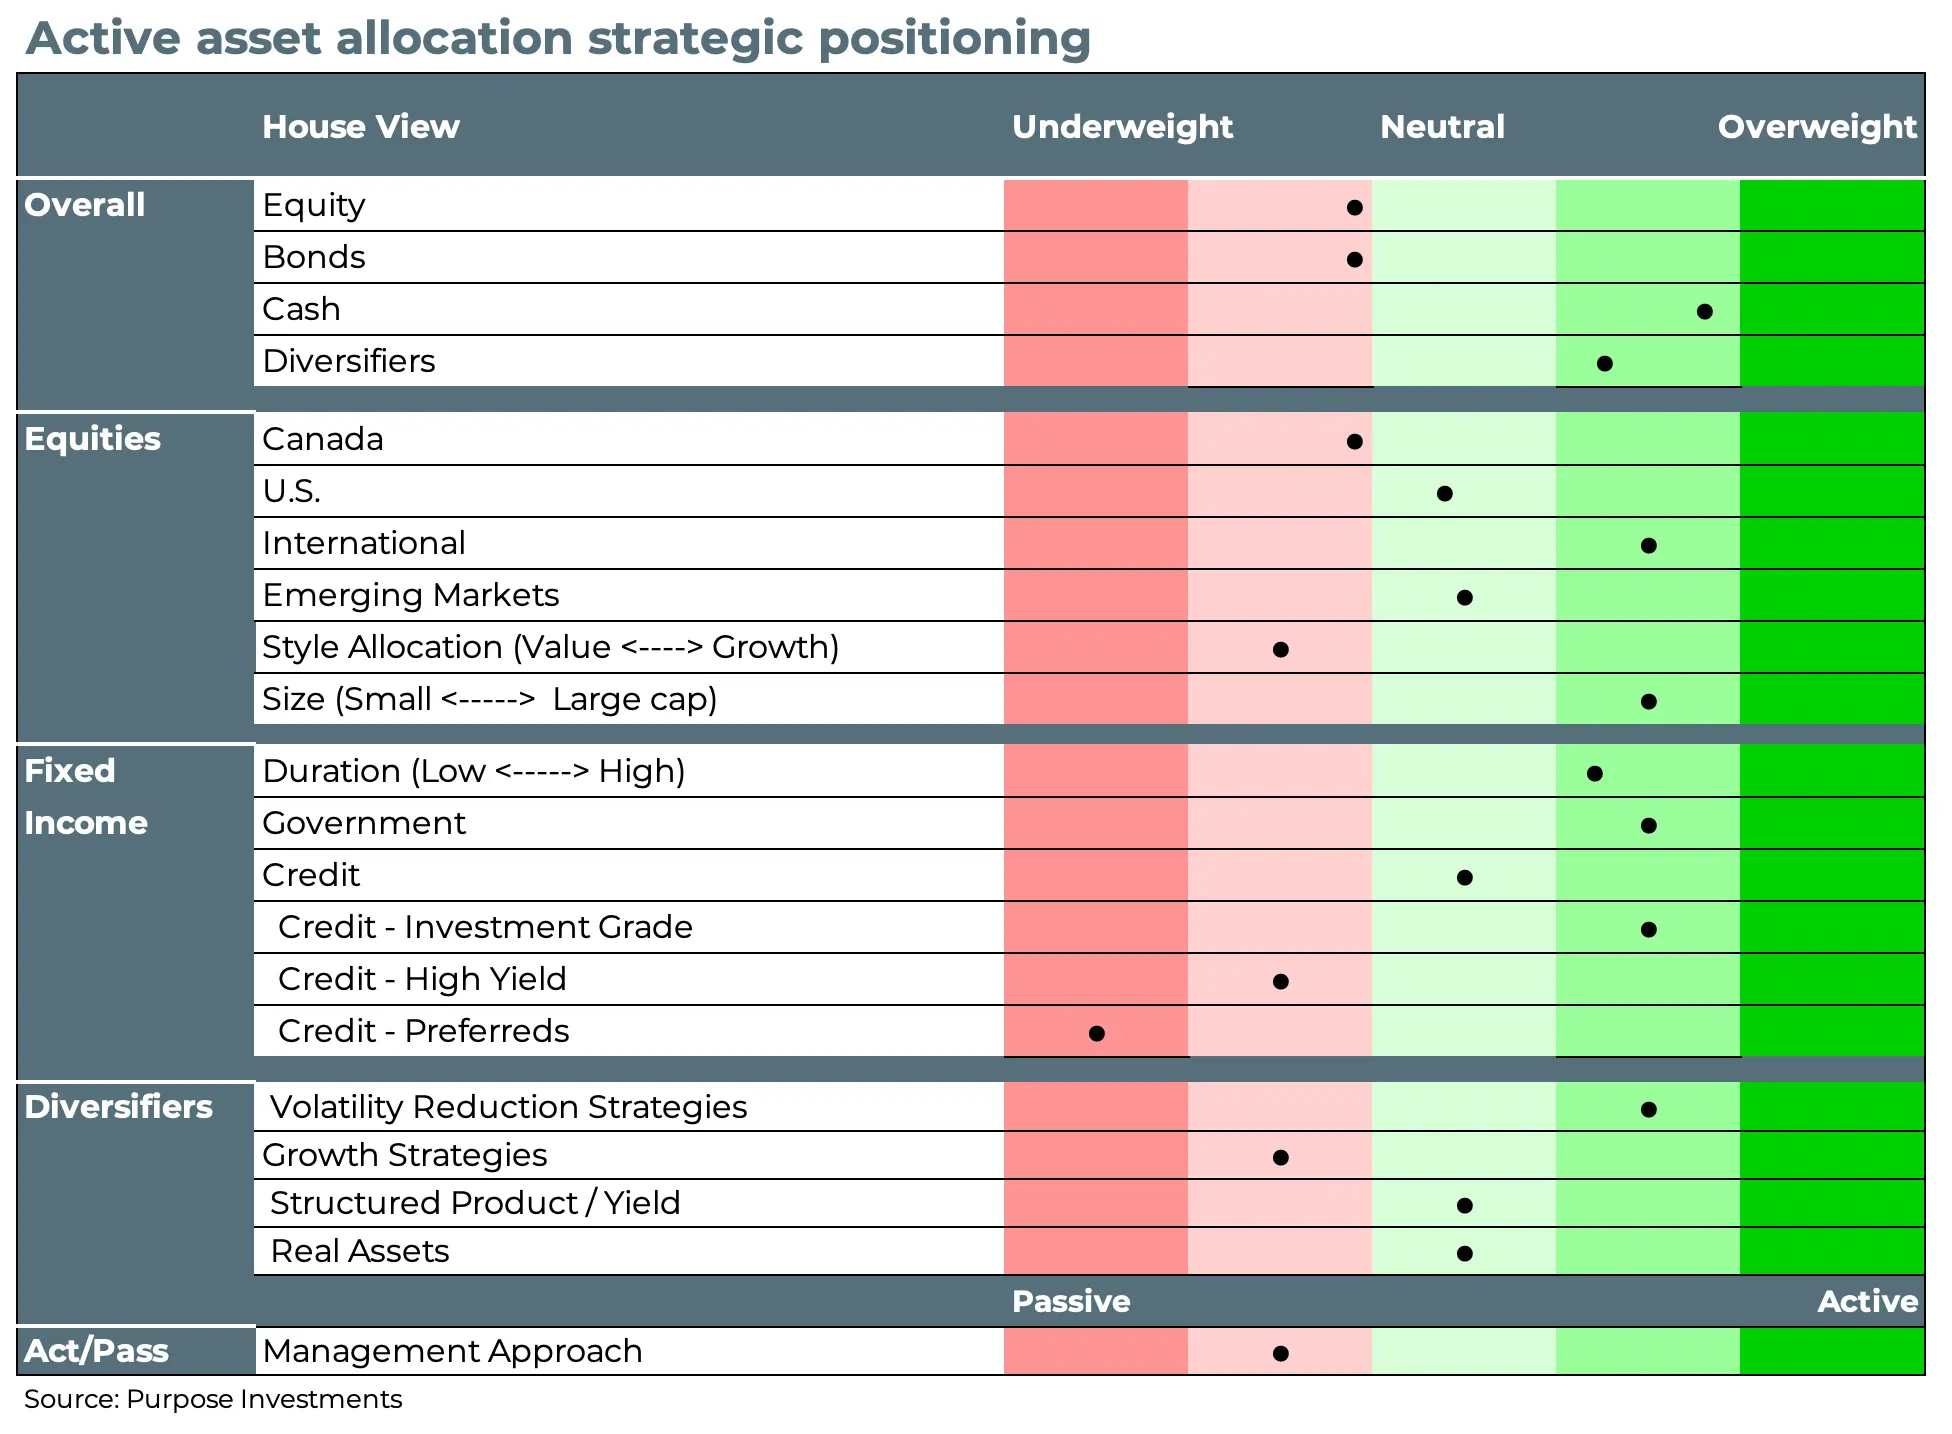
No changes to portfolio allocations over the past month; profit is most often made in the sitting. More cash and diversifiers have us in a position that if a seasonal period of market weakness does arise, we have many options to be active. While this does have us slightly defensive in a market that keeps going up, better bond tilts, gold, and international have compensated to make up the cash/defensive drag. It’s certainly been an interesting year so far, and there’s more to go.
Final Note
2025 is far from a plain vanilla investment year. Policy uncertainty, erosion of central bank independence, fiscal spending going global, markets reaching highs, rising concerns over deficits, struggling housing markets, persistent inflation and decent earnings growth are a few of the highlights with a third of the year still to go. We are coming into a seasonally challenging period, and finding diverse sources of diversification remains prudent for portfolios with so many moving parts in the markets.
— Craig Basinger, Derek Benedet and Brett Gustafson
Get the latest market insights in your inbox every week.
Sources: Charts are sourced to Bloomberg L.P.
The content of this document is for informational purposes only and is not being provided in the context of an offering of any securities described herein, nor is it a recommendation or solicitation to buy, hold or sell any security. The information is not investment advice, nor is it tailored to the needs or circumstances of any investor. Information contained in this document is not, and under no circumstances is it to be construed as, an offering memorandum, prospectus, advertisement or public offering of securities. No securities commission or similar regulatory authority has reviewed this document, and any representation to the contrary is an offence. Information contained in this document is believed to be accurate and reliable; however, we cannot guarantee that it is complete or current at all times. The information provided is subject to change without notice.
Commissions, trailing commissions, management fees and expenses all may be associated with investment funds. Please read the prospectus before investing. If the securities are purchased or sold on a stock exchange, you may pay more or receive less than the current net asset value. Investment funds are not guaranteed; their values change frequently, and past performance may not be repeated. Certain statements in this document are forward-looking. Forward-looking statements (“FLS”) are statements that are predictive in nature, depend on or refer to future events or conditions, or that include words such as “may,”“will,” “should,” “could,” “expect,” “anticipate,” intend,” “plan,” “believe,” “estimate” or other similar expressions. Statements that look forward in time or include anything other than historical information are subject to risks and uncertainties, and actual results, actions or events could differ materially from those set forth in the FLS. FLS are not guarantees of future performance and are, by their nature, based on numerous assumptions. Although the FLS contained in this document are based upon what Purpose Investments and the portfolio manager believe to be reasonable assumptions, Purpose Investments and the portfolio manager cannot assure that actual results will be consistent with these FLS. The reader is cautioned to consider the FLS carefully and not to place undue reliance on the FLS. Unless required by applicable law, it is not undertaken, and specifically disclaimed, that there is any intention or obligation to update or revise FLS, whether as a result of new information, future events or otherwise.
Copyright © Purpose Investments


