
by Craig Basinger, David Benedet, & Brett Gustafson, Purpose Investments
One recurring discussion topic over the past few months has been the size factor, specifically what to do with small- or mid-caps. We’ve largely been avoiding the space over the past few years within our multi-asset portfolios, but thought this would be a good time to dive back in, sharpen our pencils, and share our updated thoughts.
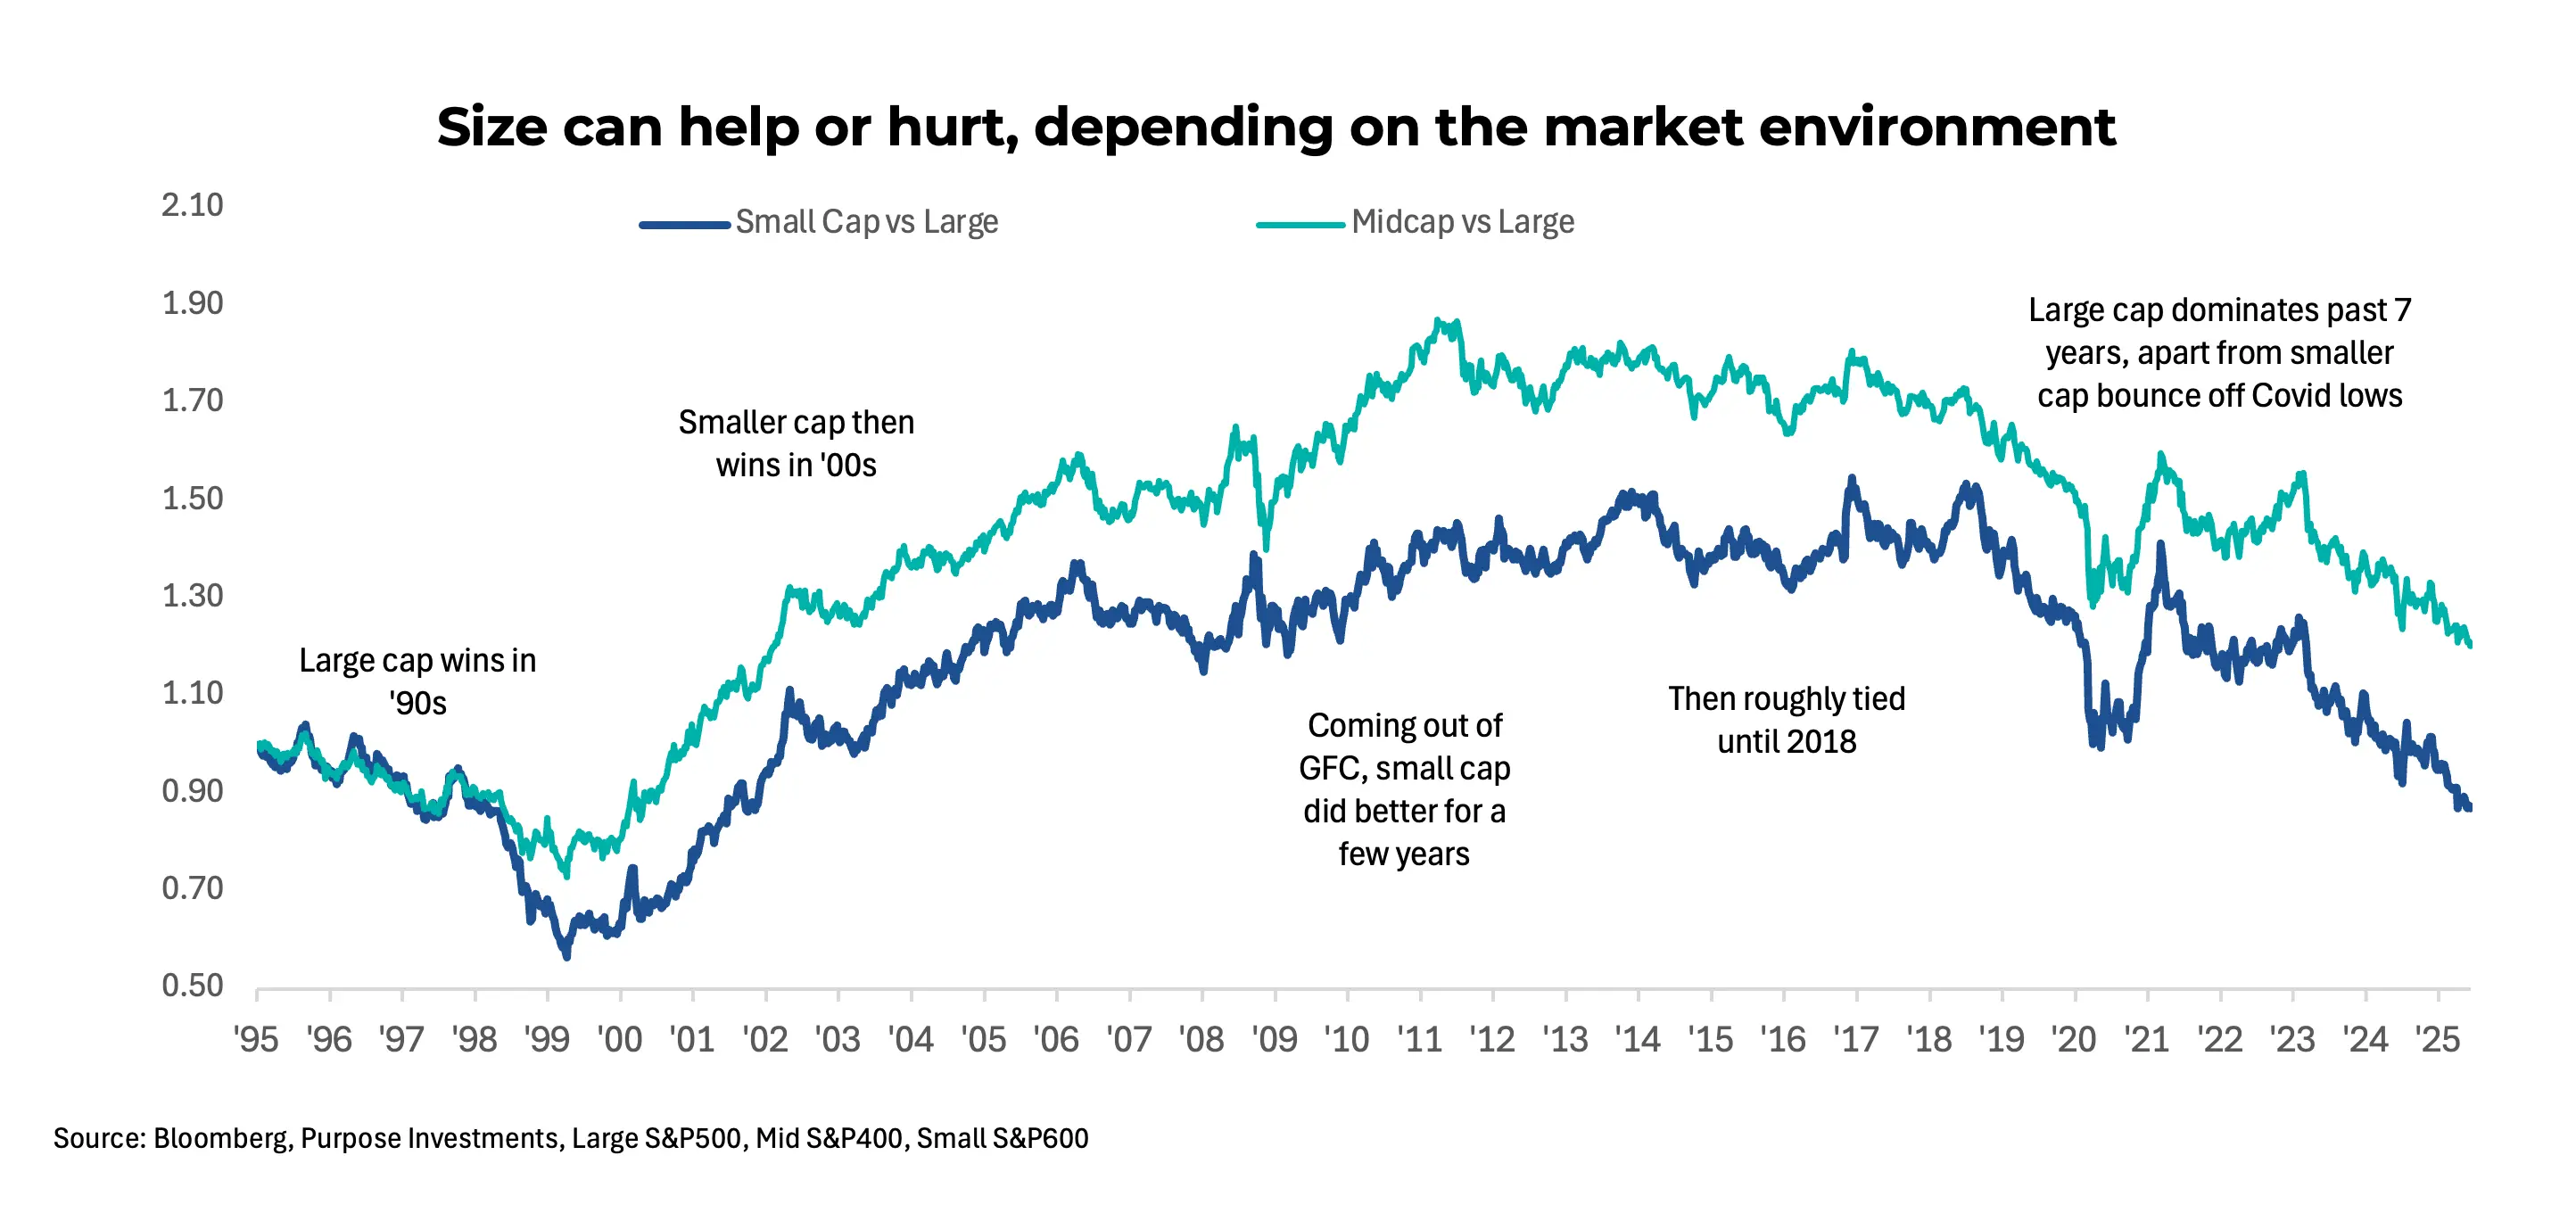
Super long term, there is a lot of evidence of the size factor in the market, but it certainly isn’t a stable factor and can be very cyclical. The chart below is the relative performance of the small caps (S&P 600) and mid-caps (S&P 400), each measured against the large cap (S&P 500). A rising line means the smaller-cap index is outperforming. One can easily see this is a very long cyclical relationship: large winning in the 90s, small winning from the 2000s to 2012, then large winning again since then.
 There is also some research out there saying this isn’t cyclical; it’s structural. The rise of ETFs and associated flows is dominated by market-cap weighted index strategies. Of course, there are small and mid-cap (even micro-cap) ETFs, but the associated dollar flows are woefully smaller, favouring the large caps.
Just ask any small-cap portfolio manager, and they will point out the amazing opportunities and valuations in the space. But they often share some frustration as well, not knowing if or when this valuation discount will change. There may also be a supply issue as quality small companies can now stay private much longer than before, tapping private equity instead of public markets.
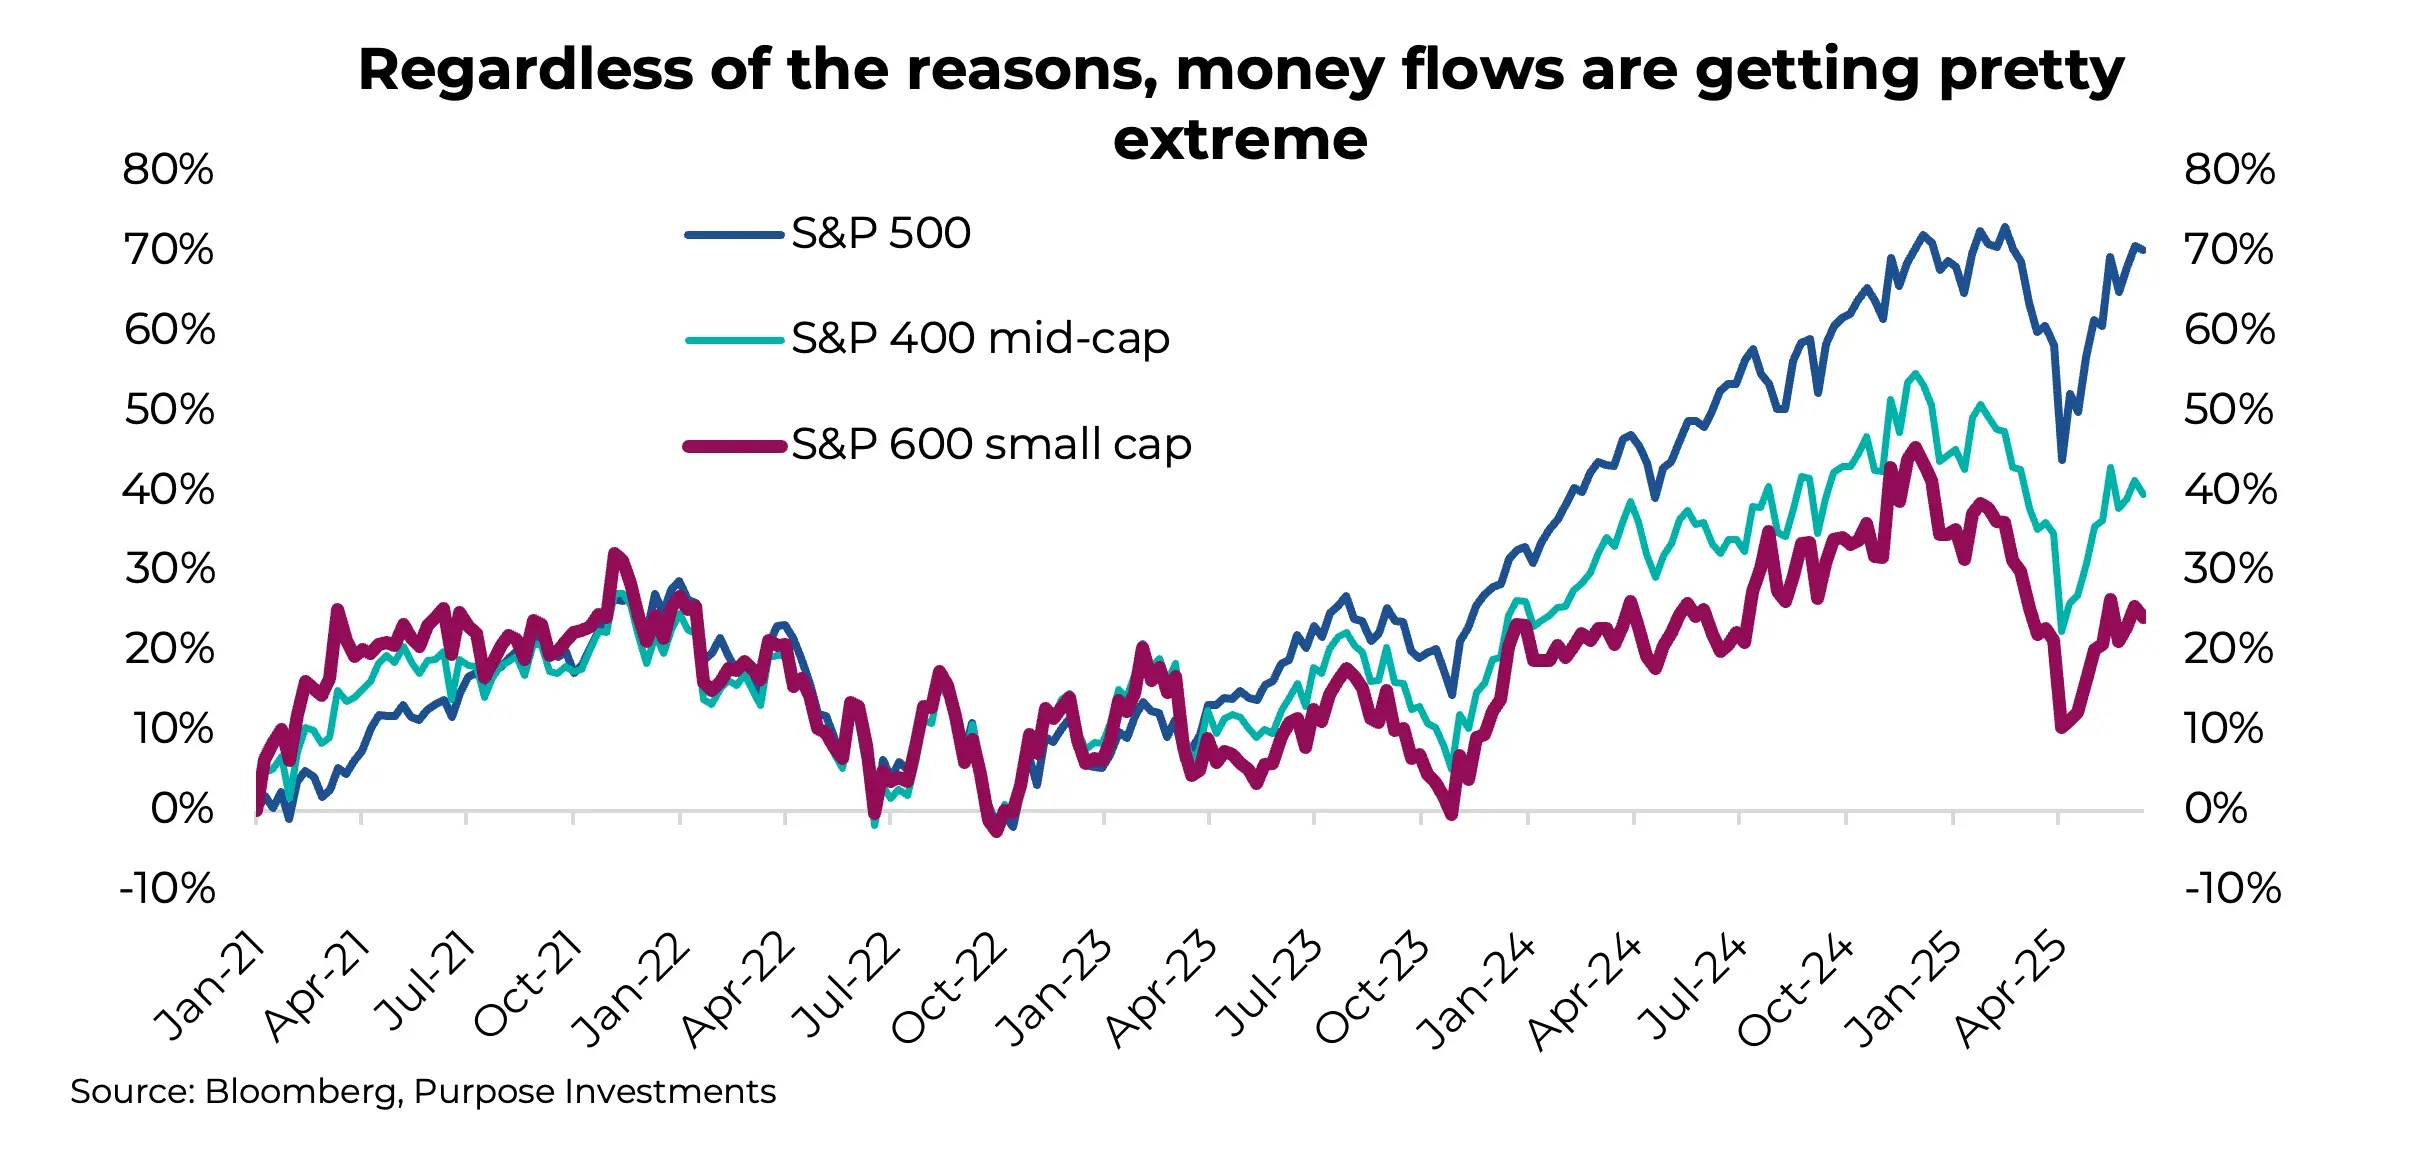
Money flows are certainly a contributing factor to the relative performance of the size factor, but this is getting a bit ridiculous. Since the end of 2020, we have the S&P 500 up +71%, S&P mid-cap up +40%, and S&P small cap up +25%. Perhaps the big question is whether this spread is creating a great opportunity?
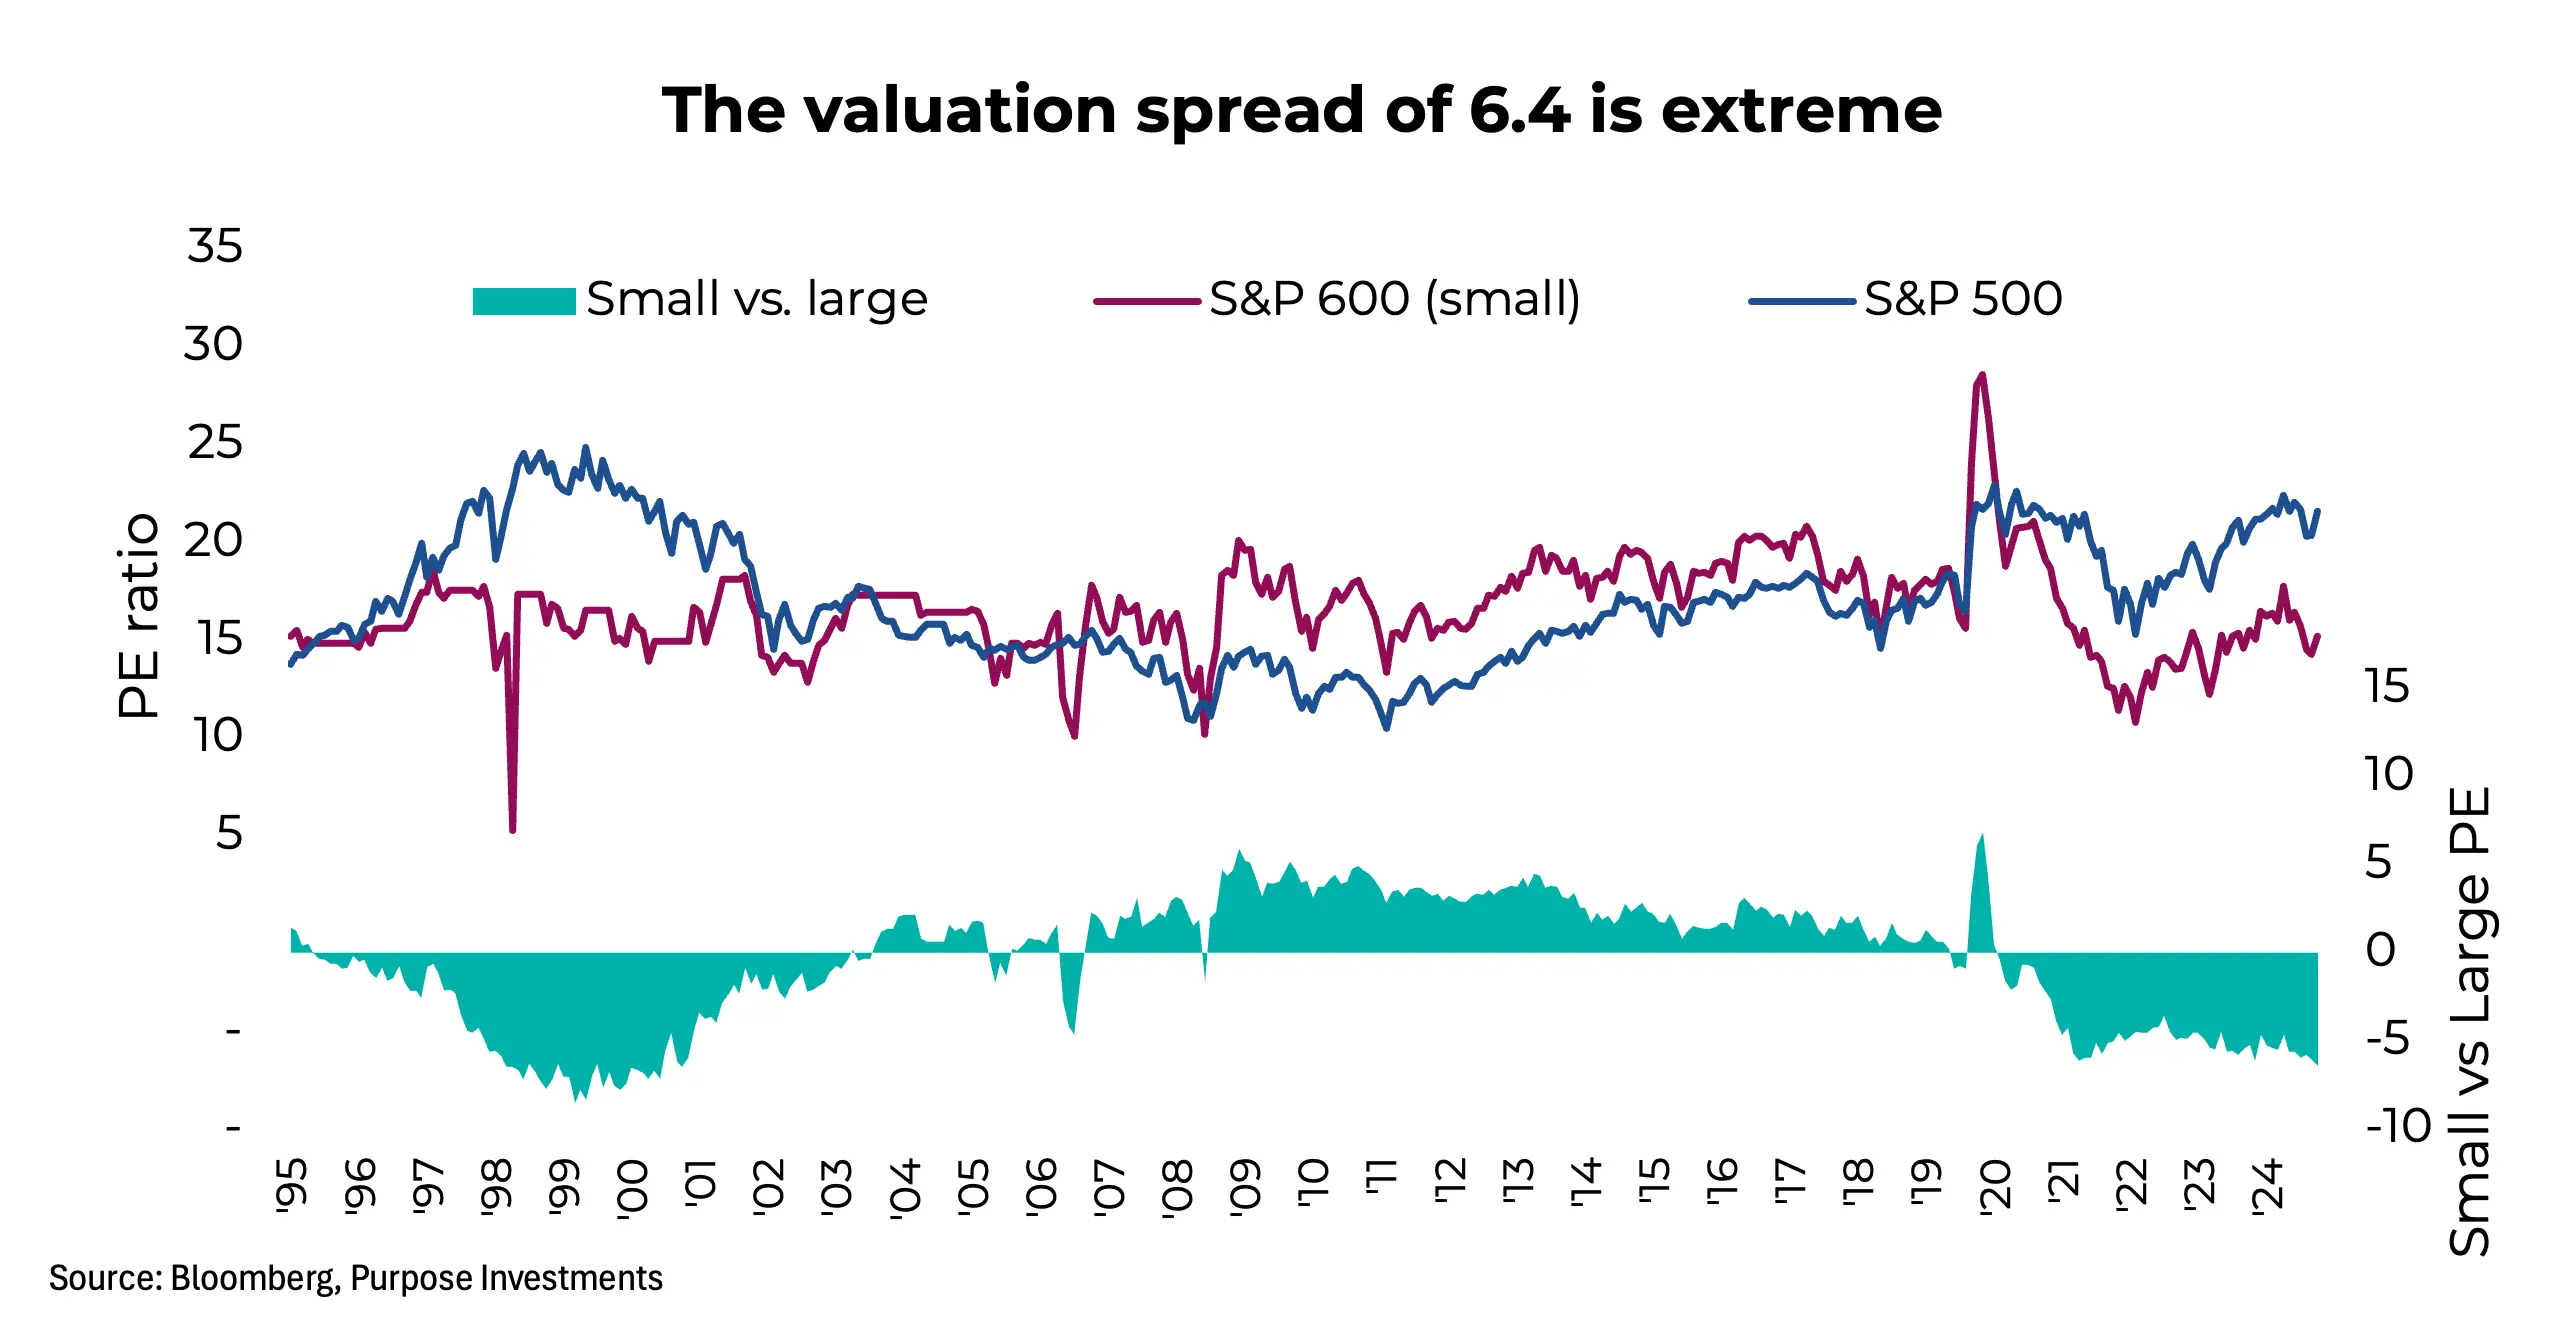
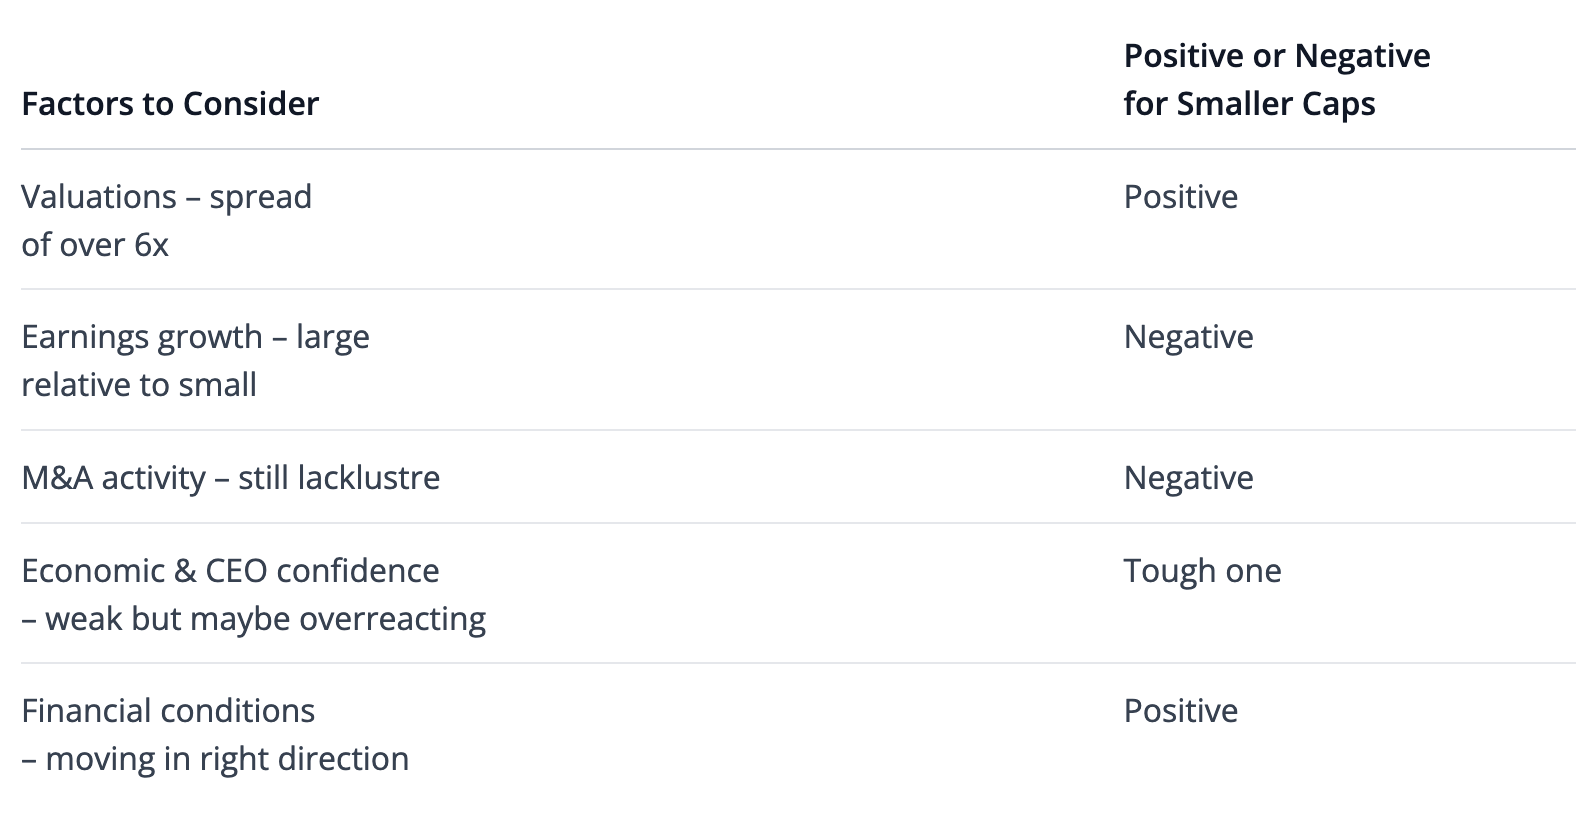
Valuations – This one is easy. For small caps, they are cheap at 15x forward earnings estimates compared to a long history average price-to-earnings ratio of 16.2x. On a relative basis vs large cap, they are VERY cheap, with a 6.4 multiple point spread. Sure, the spread did get a bit higher in the late 1990s with a peak of 8.2, but we are talking outlier territory valuations in either case.
It’s worth noting that the 1990s large-cap outperformance set the stage for small-cap outperformance for the following decade. Let’s agree that valuations offer one compelling reason to support smaller size allocations.
Earnings Growth - Then again, valuations have been a compelling reason since late 2021, and that certainly hasn’t helped predict future relative performance. Given that smaller-cap earnings tend to be more volatile, perhaps a bit of a lower multiple is warranted.
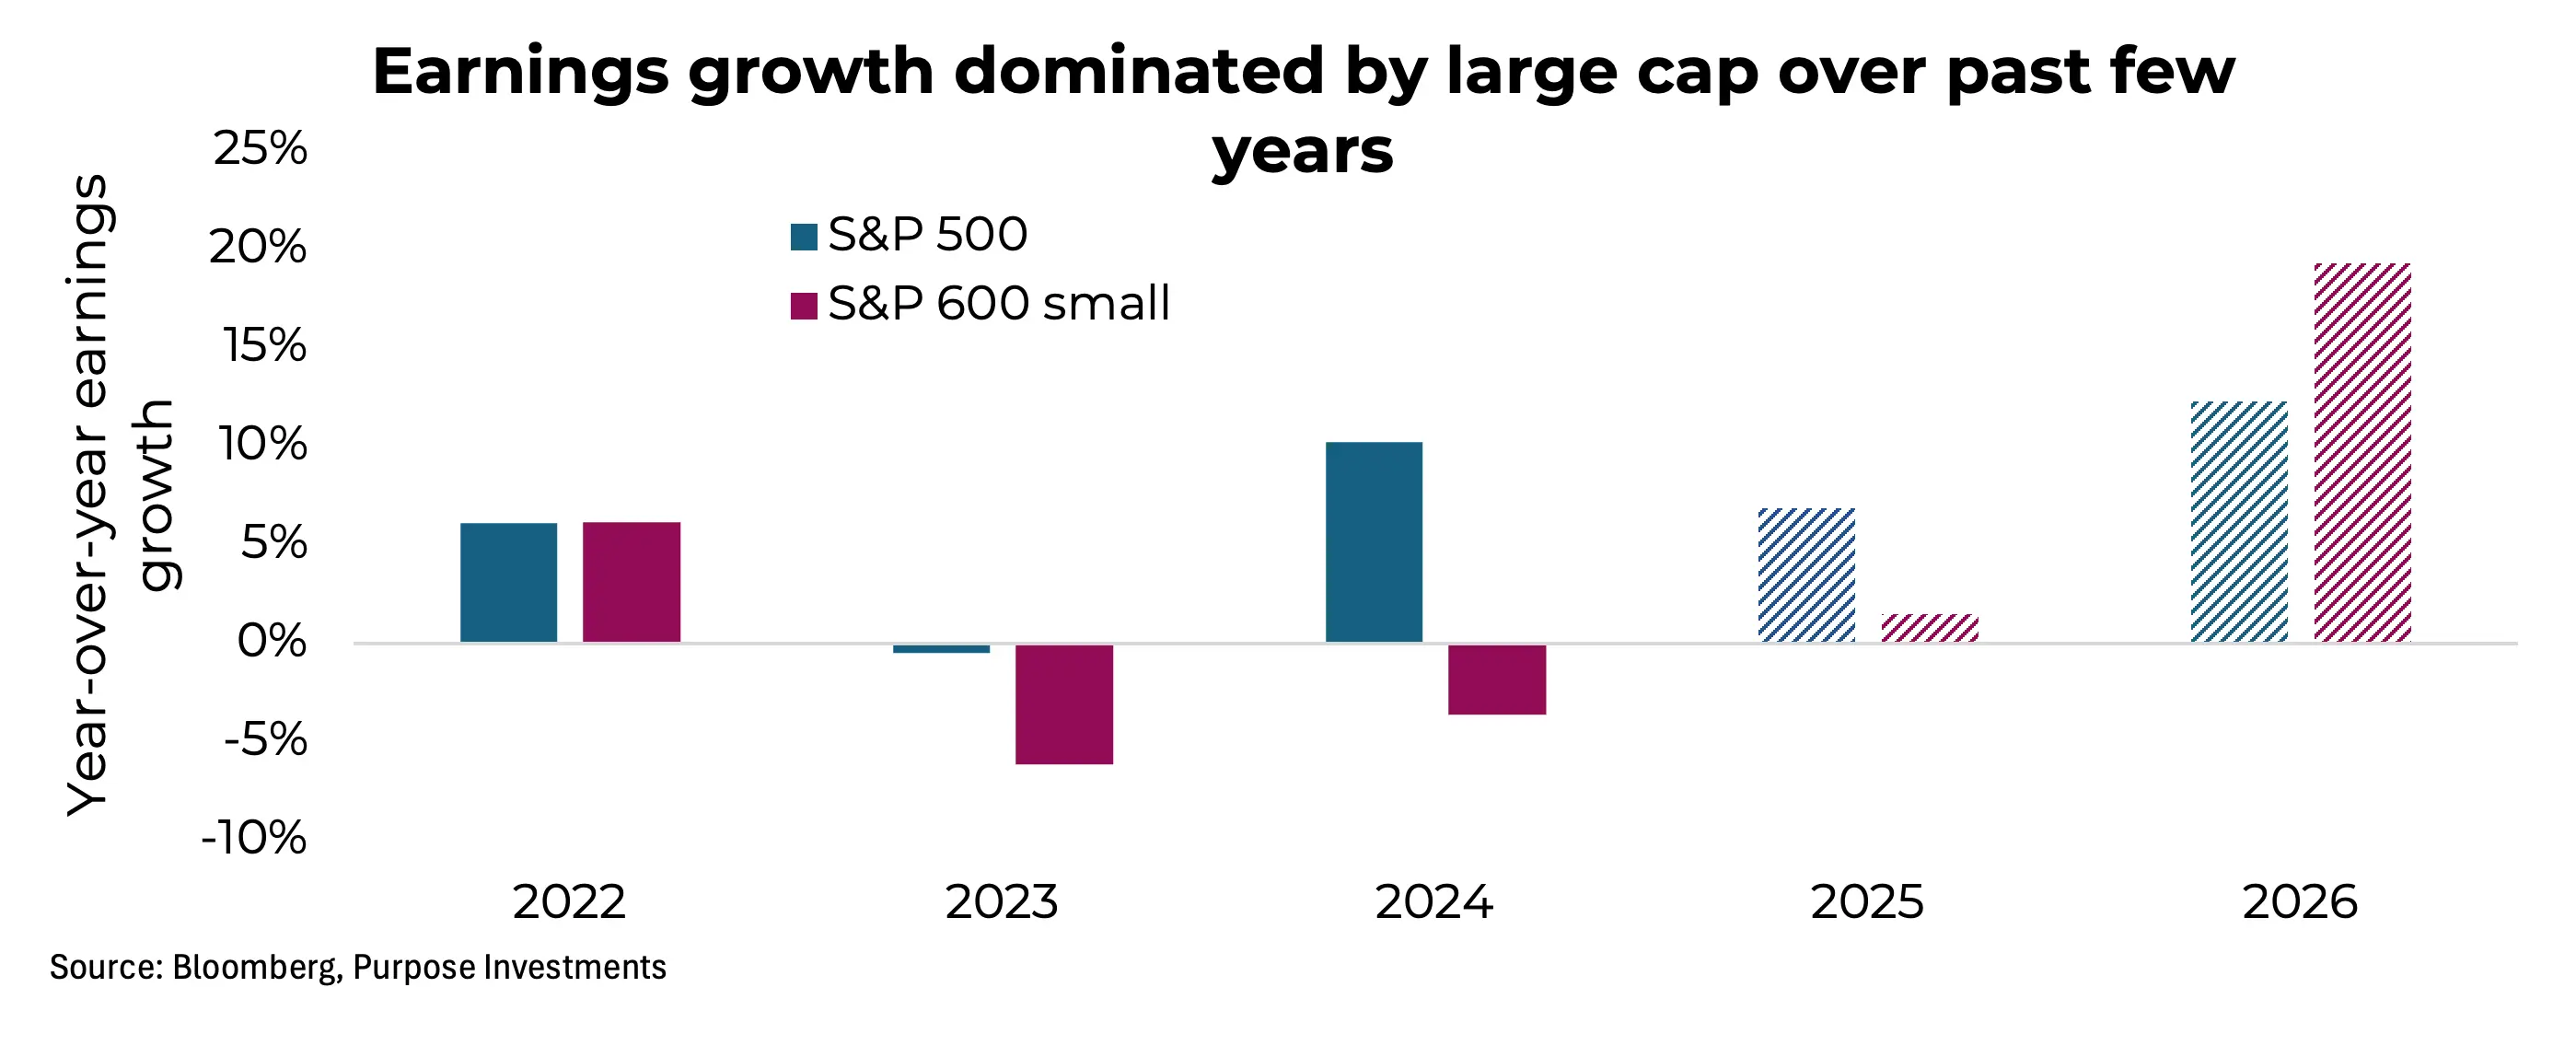
Arguably, a more important factor for relative performance across the size factor is earnings growth. If earnings are growing faster in smaller caps vs large caps, this often carries over to relative performance. We would point out that the dominance of large cap vs small caps since the early days of 2023 lines up with multiple consecutive years of higher earnings growth for large cap versus small caps.
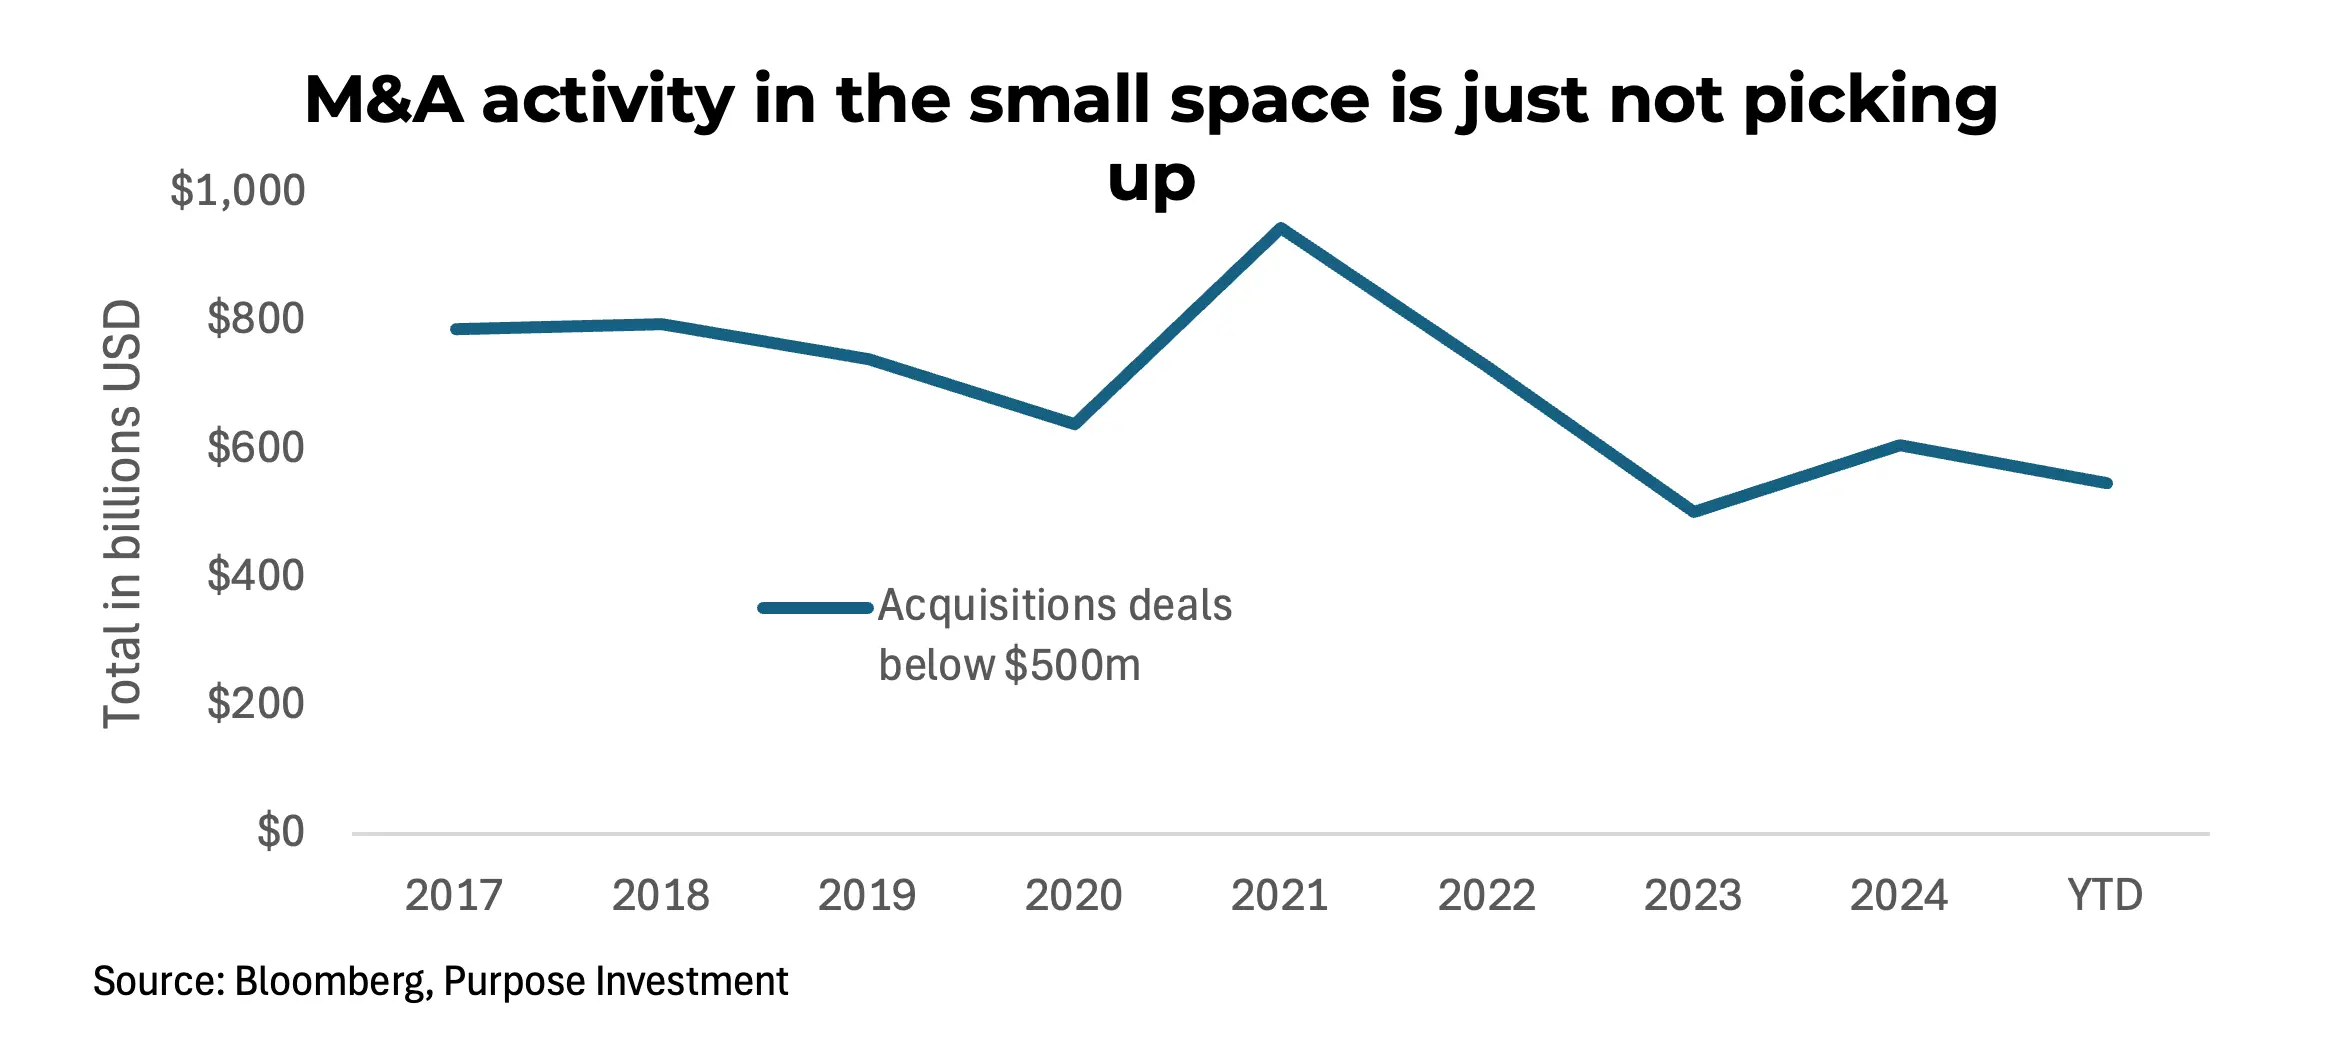
M&A - If valuations are so attractive, one would think acquisitions would be a more frequent occurrence. Unfortunately, the relative valuations are so attractive mainly because the large caps are trading at very high multiples. And higher yields have made the IRR hurdle on an acquisition higher.
The following chart shows the total annual dollar value of acquisitions below $500m. As we are 44% through 2025, this number has been adjusted to an annual pace.
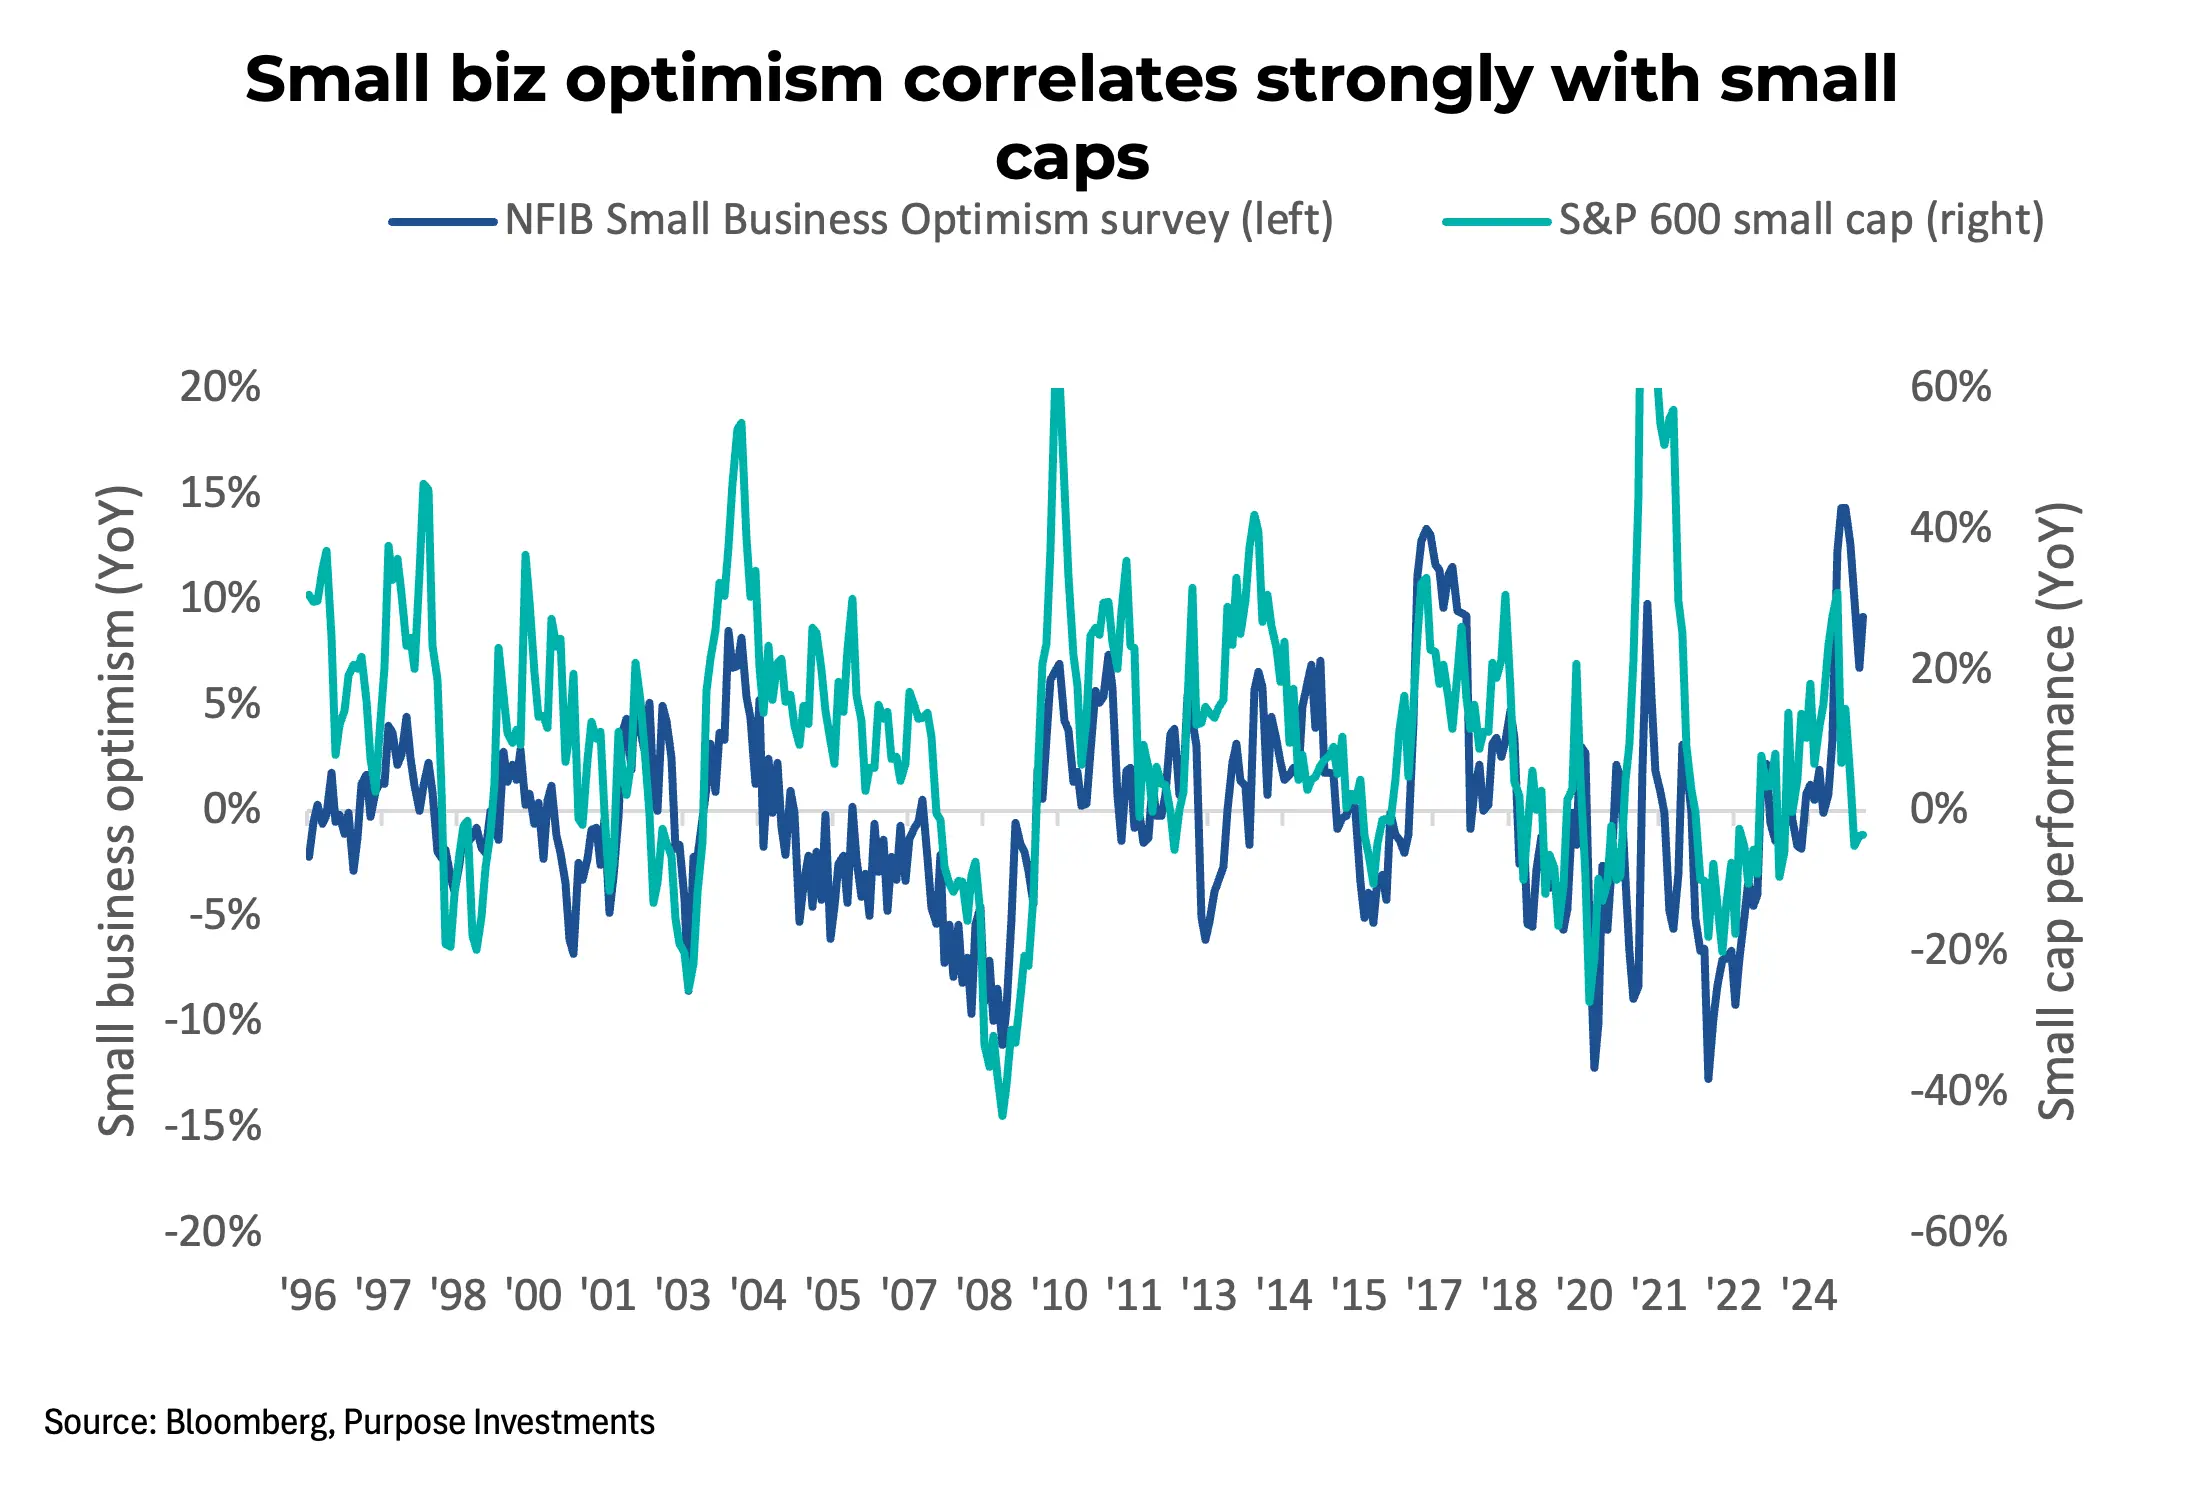
Confidence - With so much uncertainty in 2025, this may not be too surprising. Confidence is critical for smaller caps to outperform. CEO confidence has been falling in 2025, as has the NFIB small business optimism index.
To be bullish on small caps, one would have to believe corporate optimism is going to improve later this year. It’s possible that some resolutions on trade or other policy headwinds may help. But if the economic data does soften later this year, that too will provide a confidence headwind.
Financial Conditions - More Fed rate cuts should help smaller-cap relative performance, and there are likely some rate cuts coming later this year based on the consensus. How much this may drive performance is hard to say, especially since we have enjoyed some pretty easy financial conditions over the past few years, once you incorporate lending standards, spreads, capital availability, etc. Cuts would help.
Final Thoughts
Earnings growth has been decelerating in 2025 across most markets, which has been even more pronounced among smaller caps. Perhaps the valuation spread compensates for this somewhat, but we would want to see some signs of stability or potential turn in earnings growth to get excited, or a turn in confidence and some M&A. The setup may be in place, but we believe the catalyst appears to still be missing.
— Craig Basinger is the Chief Market Strategist at Purpose Investments
Get the latest market insights in your inbox every week.
Copyright © Purpose Investments
Sources: Charts are sourced to Bloomberg L.P.
The content of this document is for informational purposes only and is not being provided in the context of an offering of any securities described herein, nor is it a recommendation or solicitation to buy, hold or sell any security. The information is not investment advice, nor is it tailored to the needs or circumstances of any investor. Information contained in this document is not, and under no circumstances is it to be construed as, an offering memorandum, prospectus, advertisement or public offering of securities. No securities commission or similar regulatory authority has reviewed this document, and any representation to the contrary is an offence. Information contained in this document is believed to be accurate and reliable; however, we cannot guarantee that it is complete or current at all times. The information provided is subject to change without notice.
Commissions, trailing commissions, management fees and expenses all may be associated with investment funds. Please read the prospectus before investing. If the securities are purchased or sold on a stock exchange, you may pay more or receive less than the current net asset value. Investment funds are not guaranteed, their values change frequently, and past performance may not be repeated. Certain statements in this document are forward-looking. Forward-looking statements (“FLS”) are statements that are predictive in nature, depend on or refer to future events or conditions, or that include words such as “may,”“will,” “should,” “could,” “expect,” “anticipate,” intend,” “plan,” “believe,” “estimate” or other similar expressions. Statements that look forward in time or include anything other than historical information are subject to risks and uncertainties, and actual results, actions or events could differ materially from those set forth in the FLS. FLS are not guarantees of future performance and are, by their nature, based on numerous assumptions. Although the FLS contained in this document are based upon what Purpose Investments and the portfolio manager believe to be reasonable assumptions, Purpose Investments and the portfolio manager cannot assure that actual results will be consistent with these FLS. The reader is cautioned to consider the FLS carefully and not to place undue reliance on the FLS. Unless required by applicable law, it is not undertaken, and specifically disclaimed, that there is any intention or obligation to update or revise FLS, whether as a result of new information, future events or otherwise.