


by Liz Ann Sonders, Chief Investment Strategist, & Kevin Gordon, Charles Schwab & Company Ltd.
The U.S. economy and stock market face a confluence of challenges in the second half of the year, keeping the bar relatively (but not restrictively) high for outperformance.
As we approach the midpoint of 2025, the U.S. economy continues to confront a complex interplay of policy decisions around tariffs and immigration, labor market dynamics, and fiscal pressures. As has been well documented, in early April, the Trump administration implemented significant tariff increases; with subsequent escalations, de-escalations, delays, court decisions, and appeals. As it presently stands—with inevitable changes to come—the average effective tariff rate, shown below, is more than 15%. That is the highest tariff rate since the late 1930s Great Depression era.
Back to the future of high tariffs

Source: Charles Schwab, The Budget Lab at Yale, as of 6/6/2025.
Average effective tariff rate represents reflects the average tariff paid across all imports. Forecasts contained herein are for illustrative purposes only, may be based upon proprietary research and are developed through analysis of historical public data.
Stagflation on the mind
These tariff measures have contributed to stagflation, a deceleration in economic growth, and an expected acceleration in inflation. The Organization for Economic Cooperation and Development (OECD) projects U.S. gross domestic product (GDP) to slow from 2.8% in 2024 to 1.6% in 2025, with inflation nearly 4% by year-end due to higher import costs. Globally, the OECD expects a decline in economic growth from 3.1% in 2024 to 2.9% in 2025, attributing the slowdown to increased trade barriers and policy uncertainties. As shown below, the U.S. is expected to suffer the second-largest growth and inflation hits.
Seeing the "stag" and the "flation"

Source: Charles Schwab, Organisation for Economic Co-operation and Development (OECD).
The OECD's simulation assumes bilateral tariffs are raised permanently by 10% on all non-commodity imports into the United States with corresponding increases on tariffs applied to non-commodity imports from the United States in all other countries. The impact on GDP and inflation after three years is an estimate if and when the bilateral tariffs are implemented as stated in the chart, and thus will be measured only if the tariffs take effect (thus making the current start and end dates unknown). Forecasts contained herein are for illustrative purposes only, may be based upon proprietary research and are developed through analysis of historical public data.
Recession odds lower, but not eliminated
Recession risk remains top-of-mind; although economists' odds thereof did ease in the aftermath of the announcement on April 9 of the 90-day delay in the administration's "reciprocal tariffs" that were announced on April 2. We will leave the unenviable task of trying to gauge the administration's next move(s) on tariffs—alongside coming court decisions—to our colleague Mike Townsend. In the meantime, a recession remains a risk. The dominoes visual below is one we have published several times in the past to highlight how recessions unfold, with the order and timing different during each cycle.
Per the current cycle, the fallen dominoes include those that had prior falls, like the stock market, and those with ongoing weakness, like the ISM Manufacturing index. The mixed dominoes would be considered those "on watch." That leaves only a couple that are still fully standing.
Recessions' dominoes

For illustrative purposes only
Services under pressure
The latest domino to change color (last week) was notable. The Institute for Supply Management (ISM) Services index (encapsulating about 80% of the U.S. economy) unexpectedly fell into contraction (and recession) territory for the first time in nearly a year. We subjectively coded it yellow but will change it to red if next month follows with another contractionary reading. Notably, its price index jumped to its highest level since November 2022—the year in which inflation spiked courtesy of pandemic-related supply disruptions. Readings like this, were they to persist, could keep "stagflation" on economists' and investors' radar screens in the second half of the year.
The last time recession risk appeared to be elevated, but didn't come to fruition, was in the aftermath of the 2022 inflation spike, equity bear market, and aggressive Federal Reserve (Fed) tightening cycle. Then, like now, there developed a yawning chasm between soft (survey-based, including consumer and business confidence readings) and hard economic data (including labor market metrics and retail sales), shown below. Then, there ultimately was not much catch-down by the hard data and eventually the soft data caught back up to the more resilient hard data. That would certainly be an ideal scenario in today's backdrop, but it may be too benign an assumption. Instead, we believe the best-case scenario given today's chaotic and unstable policy backdrop is a convergence between the soft and hard data.
Hard data not looking soft yet

Source: Charles Schwab, Bloomberg, as of 5/31/2025.
Bloomberg "Hard Data" and "Soft Data" Surprise Indexes measure the difference between actual data and analysts' forecasts. Indexes are unmanaged, do not incur management fees, costs and expenses and cannot be invested in directly.
Some labor market cracks appearing
We continue to believe the labor market holds the key to economic and Federal Reserve policy outlooks. The present environment can be characterized as one in which companies have cut back on hiring plans, but they aren't yet teeing up firings to any significant degree. This phenomenon can be witnessed in several ways.
First, as shown below, we compare two key components of the monthly Job Openings and Labor Turnover Survey (JOLTS): listed job openings and layoff announcements. Job openings have been generally trending lower the past couple of years, while layoff announcements have not picked up to a commensurate degree.
Low hiring, low firing persists

Source: Charles Schwab, Bloomberg, Bureau of Labor Statistics, JOLTS (Job Openings and Labor Turnover Survey), as of 4/30/2025.
Y-axis is truncated for visual purposes.
Second, as shown below, we compare two key unemployment claims readings: initial claims and continuing claims. Initial claims have been trending higher, but remain tame—reflecting the slow pace of layoffs. On the other hand, continuing claims are at a new cycle high—reflecting the increasing difficulty laid-off workers are having in terms of finding new employment.
Layoff activity subdued

Source: Charles Schwab, Bloomberg, Department of Labor. Initial claims as of 5/30/25.
Continuing claims as of 5/23/25.
The May jobs report painted a mixed picture, keeping the outlook murky. Payrolls were slightly better than expected, but there were large downward revisions to the prior two months. There was also a large drop in household employment (the survey from which the unemployment rate is calculated), alongside a decline in the labor force. That combination is why the unemployment rate remained steady, although maintaining its slow upward trend this year. All else equal, the recent labor market readings (broadly) are supportive of the Fed remaining in pause mode.
With two-thirds of U.S. GDP tied to consumer spending, their confidence remains key to the outlook. An example of soft economic data is consumer confidence, which although having rebounded a bit recently, remains relatively weak. The health of the labor market is one of the most important supports for consumption, and is a key explanation for the aforementioned post-2022 experience of soft data ultimately catching back up to resilient hard data. The latter was supported by a labor market which barely faltered in that period.
Delinquencies' to ripple?
Aside from the labor market, a hit the consumer is already facing—and that we feel is not getting sufficient attention—is the recent end to the pandemic-related moratorium on lenders publishing student loan delinquency rates. As a reminder, payments on federal student loans were paused for more than three years starting in March 2020. After the resumption of payments began in October 2023, a one-year "on-ramp" was instituted, which prevented notifications of missed payments from being reported to credit bureaus. That on-ramp expired in October 2024 and delinquencies began appearing on credit reports during this year's first quarter. As shown below, there has been a discomforting spike in the student loan delinquency rate, which has obvious feeders into credit scores and access to loans in other categories.
Serious student loan delinquencies spike

Source: Charles Schwab, Bloomberg, Federal Reserve Bank of New York, as of 1Q2025.
Dour CEOs
It is not just consumer confidence that took a hit this year; so has CEO confidence (which is also an example of soft data). Stating the obvious, trade policy instability has put a significant dent in capital spending (capex) plans; outside of artificial intelligence (AI)-related spending, which remains robust. As shown below, there has been a strong link historically between CEO confidence and capex (equipment & intellectual property products). Barring a quick reversal in CEO confidence, many capex plans are likely to remain on hold.
CEO optimism fades rapidly

Source: Charles Schwab, Bloomberg, The Conference Board.
Equipment and intellectual property products as of 3/31/2025. CEO Confidence as of 5/29/2025.
Prior to the escalation of the trade war on April 2, there was little evidence of policy having damaged actual capex trends, i.e., the hard data. Capex growth actually strengthened in the first quarter across not just the United States, but most developed countries as well. However, first-quarter data obviously predated the trade war's acceleration on April 2. Barring further de-escalation, if CEO confidence remains depressed, it's a safe assumption that large capex plans will be kept on hold.
This is especially true for smaller companies. The monthly survey by the National Federation of Independent Business (NFIB) has an investment intentions component, and as shown below, it has taken a steep fall this year, with the latest dip matching April 2020's, in the heart of the pandemic.
Not-so-great expectations

Source: Charles Schwab, Bloomberg, National Federation of Independent Business (NFIB), as of 4/30/2025.
Even a rosier scenario of companies' worst fears around tariffs not coming to fruition, it's unlikely that confidence will notably elevate. Significant uncertainty is likely to remain regarding what comes next in terms of other trade barriers, sector/product-specific tariffs, and/or any possible exemptions on offer. That said, we do believe the worst-case scenario of what was proposed on April 2 is an unlikely ultimate outcome. As such, it's a good time to remind readers of one of our oft-expressed mantras: better or worse often matters more than good or bad.
Deficit/debt increasingly in focus
Another significant confidence dent has come in the form of heightened focus on the trajectory of the U.S. budget deficit and federal debt. Treasury Secretary Scott Bessent has expressed the importance of reducing annual deficits to 3% of GDP. That is not likely to be accomplished if the House reconciliation bill (the One Big Beautiful Bill Act) is passed in anything near its current form.
As highlighted below, the Committee for a Responsible Federal Budget estimates the reconciliation bill would boost deficits to about 7% of GDP, and would remain near that level through 2034. Even with the budget resolution's assumption of 2.6% average real GDP growth—optimistic in the near-term and somewhat unlikely over the next decade—deficits would remain well above the 3% target.

Source: Committee for a Responsible Federal Budget (CRFB), Congressional Budget Office, and Joint Committee on Taxation, as of 5/20/2025.
Note: While the concurrent budget resolution assumes a 2.6 percent annual growth rates, it is highly unlikely that any set of policies, especially tax cut extensions alone, could achieve this sustained level of economic growth.
The non-partisan Congressional Budget Office (CBO) did a recent analysis and estimated an estimate of $2.8 trillion in tariff revenue through 2034, assuming tariff rates in place up to mid-May remain in place. Frankly, estimating tariff rates/revenues over the next 10 minutes is impossible, let alone the next 10 years! It is notable that the CBO's deficit forecasts have historically been overly optimistic.
With the recent downgrade of U.S. debt by Moody's—adding to prior downgrades by S&P (in 2011) and Fitch (in 2023)—the weakness in the U.S. dollar, and concerns about waning global demand for U.S. treasuries, let's just say the wattage in the spotlight on this issue has been turned noticeably higher.
Keep the seatbelts on
It's the ultimate understatement to say the first half of the year has been choppy for stocks. Coming into 2025, we had the view that the market would mostly resemble the inverse of what happened in 2024: more index level volatility, not just a lot of churn under the surface. Admittedly, we didn't expect that to manifest as quickly or sharply as it did—given the S&P 500's 21.4% drop into bear market territory (on an intraday basis) from mid-February to early-April.
One of the more difficult aspects of analyzing the market this year has been the significant shifts in sector leadership. Shown below is the fan favorite sector quilt; this version breaks performance down into rolling two-week periods. As you can see, there isn't one sector that has maintained the top position for more than two weeks. Perhaps more interesting is the fact that even though Energy was in first place for three of the two-week periods (the most of any sector), it is one of the worst-performing sectors year-to-date. Conversely, Industrials only held the top spot once, yet is leading year-to-date.
Inconsistent sector leadership

Source: Charles Schwab, Bloomberg, as of 6/6/2025.
Sector performance is represented by price returns of the following 11 Global Industry Classification Standard (GICS®) sector indices: Consumer Discretionary Sector, Consumer Staples Sector, Energy Sector, Financials Sector, Health Care Sector, Industrials Sector, Information Technology Sector, Materials Sector, Real Estate Sector, Communication Services Sector, and Utilities Sector. Returns of the broad market are represented by the S&P 500. Indexes are unmanaged, do not incur management fees, costs and expenses and cannot be invested in directly. Past performance is no guarantee of future results.
We continue to expect a ton of sector churn, driven by the mercurial nature of tariff policymaking, which in turn will continue to make it difficult to make sector recommendations (we remain neutral on all 11 sectors). In fairness, there are sectors and industries that are at or near the epicenter of aggressive tariffs—such as import-dependent consumer businesses, for example. Yet, there are ripple effects associated with the potential for weaker spending and investment, which would ultimately hit a sector like Financials (which is looked at as a haven from the trade war these days).
Paying attention to prices
Sector dynamics will increasingly be driven by the relationship between the bond and stock markets—especially because of the shift we believe is underway, out of the "Great Moderation" era (when the correlation between bond yields and stock prices was mostly positive during the late 1990s up until the pandemic) and into something closer to the "Temperamental Era" (when inflation was more volatile and concerning for stock during the late 1960s to late 1990s).
As shown in the chart below, the rolling 30-day correlation between changes in the 10-year Treasury yield and S&P 500 recently flipped into negative territory (but is now slightly positive); though not as extreme as we saw earlier this year or for a good chunk of 2023 into 2024. All else equal, a negative correlation means that upward pressure on bond yields coincides with downward pressure on stock prices. If inflation starts to heat back up in the coming months—driven by tariffs that induce supply shocks—we see the correlation flipping back into negative territory.
Strained relations for stocks and bonds

Source: Charles Schwab, Bloomberg, as of 6/6/2025.
Correlation is a statistical measure of how two investments have historically moved in relation to each other, and ranges from -1 to +1. A correlation of 1 indicates a perfect positive correlation, while a correlation of -1 indicates a perfect negative correlation. A correlation of zero means the assets are not correlated. Indexes are unmanaged, do not incur management fees, costs and expenses and cannot be invested in directly. Past performance does not guarantee future results.
That isn't necessarily a terrible scenario for the stock market; it just means we're exiting the pre-pandemic norm of a positive correlation between yields and stocks. The chart below shows the same relationship but on a rolling 120-day basis. The upside is that negative correlations in the post-pandemic era haven't been as extreme as prior periods (like the 1990s). The downside is that the market has clearly gotten more concerned with inflation in this era. That is being compounded by expectations that deficits will continue to expand and foreign investors might be increasingly hesitant to invest in the United States (denting our capital inflows)—all meaning the bond market continues to be in the driver's seat.
No more "Great Moderation"

Source: Charles Schwab, Bloomberg, as of 6/6/2025.
Correlation is a statistical measure of how two investments have historically moved in relation to each other, and ranges from -1 to +1. A correlation of 1 indicates a perfect positive correlation, while a correlation of -1 indicates a perfect negative correlation. A correlation of zero means the assets are not correlated. Indexes are unmanaged, do not incur management fees, costs and expenses and cannot be invested in directly. Past performance does not guarantee future results.
Fed alert?
Those aforementioned dynamics make the Fed's job of keeping maximum employment and stable prices that much more difficult. We've discussed the potential challenge associated with the Fed's dual mandates coming into conflict with each other—with tariffs putting upward pressure on inflation but downward pressure on economic growth. For now, though, there isn't a conflict. Fed policymakers still see the labor market as resilient and continue to be on the lookout for a heating up in price pressures, driven by tariffs. That has forced investors to price out several rate cuts this year, as shown in the chart below.
Cutting the cut expectations

Source: Charles Schwab, Bloomberg, as of 6/6/2025.
Dates in legend represent upcoming FOMC (Federal Open Market Committee) meetings. Futures and futures options trading involves substantial risk and is not suitable for all investors. Please read the Risk Disclosure Statement for Futures and Options [LINK Risk Disclosure Statement for Futures and Options: https://www.schwab.com/Futures_RiskDisclosure] prior to trading futures products.
As of now, we continue to think one or two rate cuts make sense this year, but our view on gauging future Fed policy is similar to gauging future tariff policy. Expectations can change by the minute, so there's little utility in attempting to look several months out when we don't know what's in store for the next several days.
Pay up
The S&P 500's rebound from the April 8th lows has been almost as jarring as its decline to those lows. In practical terms, the rebound isn't unwarranted: aggressive "reciprocal tariffs" got the market into a mess, so a pause of those tariffs got the market out of that mess. In our opinion, what was most instructive about the selloff is that its rapidity and severity were likely amplified by the fact that stocks were quite expensive coming into 2025. As shown in the chart below, the S&P 500's forward P/E was back at cycle highs right before the market's February peak—near levels seen in 2021.
Well, that was quick

Source: Charles Schwab, Bloomberg, as of 6/6/2025.
Past performance does not guarantee future results.
Now that valuations have bounced back and are close to their cycle highs, there is a bit less juice to squeeze from the multiple-expansion fruit; more has to come from earnings growth. Unfortunately, it's becoming increasingly difficult to see the path forward for earnings—unsurprisingly because of tariffs. Plus, even though the blended growth rate for S&P 500 earnings surprised to the upside in the first quarter, none of that optimism has been extrapolated to the next three quarters, as shown in the chart below.
To be sure, growth is still expected for the rest of the year, but cuts to earnings estimates have helped put upward pressure on valuations. We think the opposite needs to happen for the market to resume its march to (and beyond) all-time highs—certainly not an impossible feat.
An EPS hook up, an EPS hook down

Source: Charles Schwab, LSEG I/B/E/S, as of 6/6/2025.
Forecasts contained herein are for illustrative purposes only, may be based upon proprietary research and are developed through analysis of historical public data. Past performance is no guarantee of future results.
In that march higher, earnings growth needs to broaden out as well. Given the convergence in growth and forward estimates for the Magnificent 7 (Mag 7) and S&P 500 ex-Mag 7, there are encouraging signs that a handful of mega caps are no longer responsible for the entire market's profit gains. Count this chart below in for the "healthy convergence" side of the ledger.
Mag 7 earnings dominance fading

Source: Charles Schwab, LSEG I/B/E/S, as of 6/3/2025.
"Magnificent 7" (Mag7) represents Alphabet, Amazon, Apple, Meta, Microsoft, NVIDIA, Tesla. All corporate names and market data shown above are for illustrative purposes only and are not a recommendation, offer to sell, or a solicitation of an offer to buy any security. Forecasts contained herein are for illustrative purposes only, may be based upon proprietary research and are developed through analysis of historical public data. Indexes are unmanaged, do not incur management fees, costs and expenses and cannot be invested in directly. Past performance does not guarantee future results.
As the Mag 7's earnings heft has come down over the past year, retail investors have become less interested in the group. As you can see in the chart below, retail purchases of the Mag7+ names (Vanda Research includes AMD and Netflix in the group) as a percentage of total retail inflows have come down significantly and are at a multi-year low. It doesn't suggest the mega caps are under-owned entirely, but we wouldn't be surprised to see them make an attempt at reasserting their dominance in the second half of the year—especially if positioning continues to ease, giving a contrarian sentiment signal.
Retail shunning Mag 7

Source: Charles Schwab, Vanda Research, as of 6/3/2025.
Magnificent 7+ (Mag7+) basket includes Apple, Amazon, AMD, Alphabet, Meta, Microsoft, NVIDIA, Netflix, and Tesla. All corporate names and market data shown above are for illustrative purposes only and are not a recommendation, offer to sell, or a solicitation of an offer to buy any security.
Carnival of the animal spirits
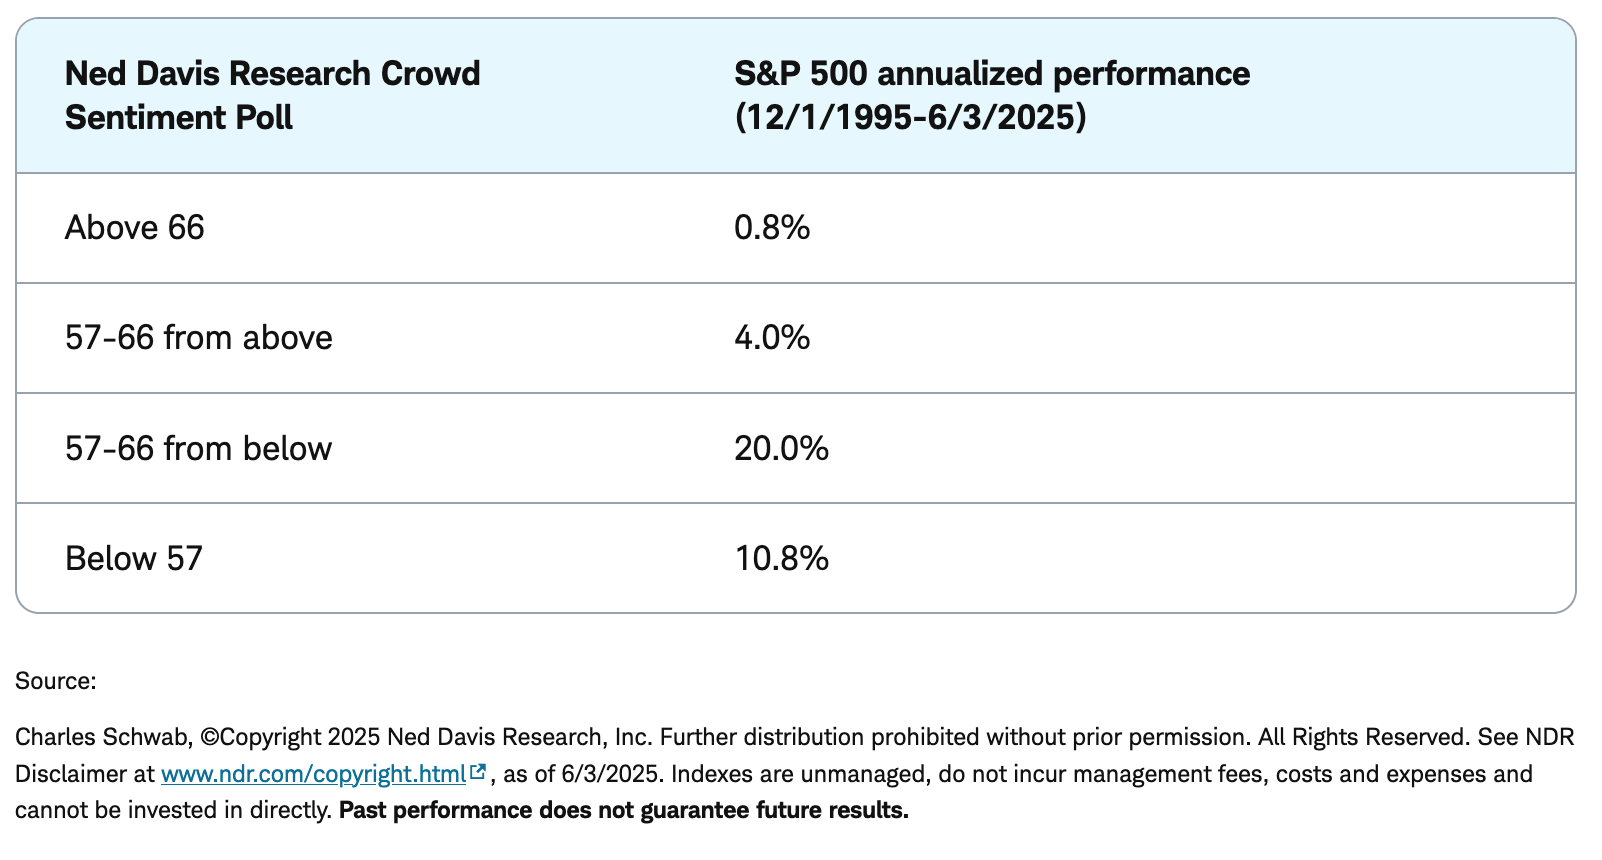
Speaking of contrarian signals, one of the more memorable ones came nearly two months ago when stocks were approaching their early April lows. One of our favorite sentiment gauges—the Crowd Sentiment Poll (CSP) from Ned Davis Research (NDR)—fell swiftly into "extreme pessimism" territory, setting up the near-perfect background conditions for the market to reverse course in the face of a positive catalyst.
The CSP has rebounded into a zone that is historically the strongest for the S&P 500; and importantly, it has fallen short of reaching the "extreme optimism" zone. The healthy dose of skepticism in the marketplace has helped stocks climb the famous "wall of worry," and we think—as backwards as it might sound—sentiment can stay in the support column for a little while longer. Importantly, though, that doesn't mean there won't be bumps along the way.
Crowd goes (just a little) wild

In sum
The U.S. economy faces a confluence of challenges in the latter half of 2025. Tariff-induced inflation, fiscal imbalances, and signs of labor market cooling contribute to an environment of heightened uncertainty and instability. In turn, with stocks nearing all-time highs as we put this report to bed, the bar is relatively high for the market in the second half of the year. Much has to go right with tariff rates edging lower, the labor market stabilizing, and inflation remaining under control. We think those are possibilities, but we also have low conviction in understanding (let alone predicting) where the day-to-day news flow will take us. For now, investor sentiment and positive earnings growth are supports, whereas stretched valuations and growth-negative tariff policy are hindrances. Investors should continue to embrace diversification across and within asset classes, especially given the dominance (this year) of markets outside the United States.
Copyright © Charles Schwab & Company Ltdch