by John Lynch, CIO, & Team, Comerica Wealth Management
Are the markets pricing in recession or simply a recalibration?
When investors turned their calendars to August, they may have flipped the narrative on the economy at the same time.
It’s been less than two weeks since the second quarter GDP report surprised to the upside, with equity markets hovering near record levels, yet there is growing sentiment is that the Fed has waited too long to cut interest rates and is now behind the curve.
While we’re not completely sold on the new narrative, the one thing that seems certain is that there is more volatility ahead.
Executive Summary
- Federal Reserve: Fed Funds Futures may have overshot once again.
- July Employment Report: Does a miss of 60K jobs really point to recession?
- Market Interest Rates: Treasury yields moving lower, forcing the Fed’s hand.
- Equity Markets: Having broken below the 50-DMA, the S&P 500®’s next support appears in the 5,250 range, representing the late-June low.
Fundamentally, we continue to look for below consensus Index profits of $237.50 this year, with a yearend fair value estimate of 5,250 for the S&P 500®.
Download the Weekly Market Update
Federal Reserve
Monetary policymakers kept interest rates steady at the conclusion of the FOMC meeting last Wednesday, though expectations changed very quickly.
While the FOMC policy decision itself was largely expected, leaving the federal funds rate at 5.25% to 5.50%, most investors were looking for signals of a rate cut at the next meeting. Fed Chairman Jerome Powell delivered, as he was slightly more dovish in his post-meeting press conference, emphasizing a greater focus on the full-employment part of the Fed’s dual mandate.
Since there had been a few small cracks evident in the employment picture in recent months, the Fed’s renewed focus on that part of their mandate was well received by investors…that is, until Friday.
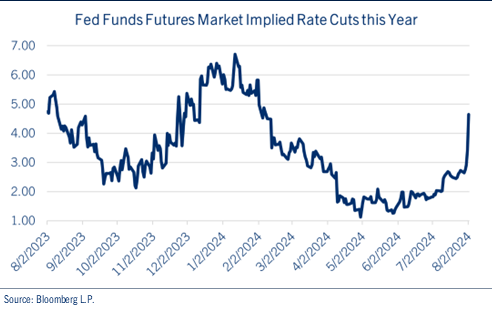
The weaker than expected jobs report caused the fed funds futures market to surge, with expectations for a 50-basis point cut in September, with an additional 50-basis point reduction before year-end. See Chart: Fed Funds Futures Market Implied Rate Cuts this Year.

As the chart shows, fed funds futures are notoriously volatile and should not be viewed as definitive policy moves. To be sure, it was a little more than six months ago when traders expected up to 6-7 rate cuts, and just a few weeks ago when they priced in fewer than two cuts.
As Milton Friedman noted, monetary policy acts with long and variable lags. While we believe further data accumulation is necessary than just the recent employment report, the Fed must nonetheless begin tweaking policy lower to avert further economic and market discontent.
July Employment Report
The weaker than expected non-farm payrolls report on Friday suddenly shifted the market narrative on the U.S. economy. Confidence in a soft landing was quickly replaced by fears of recession…in just two days.
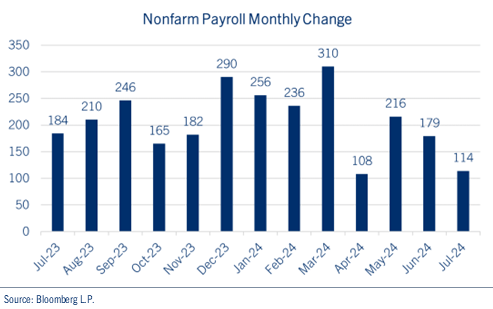
After a disappointing ISM Manufacturing report on Thursday, the July employment report revealed a few interpretation challenges for investors. See chart: Non-Farm Payrolls – Monthly Change.

For example, the economy created just 114,000 jobs last month, well below the consensus forecast for a gain of 175,000 new jobs. Though troubling at the headline level, the data may have been distorted by the effects of Hurricane Beryl, which made landfall in Texas at the beginning of the reporting period in early July.
It should also be noted that wages, which represent approximately 70.0% of business costs, moderated last month. Average hourly earnings rose just 3.6% YOY in July, the lowest reading since May 2021.
Additionally, the unemployment rate jumped to 4.3% in July, and on the surface appeared troubling, as the Sahm Rule suggests incremental jumps of 50 basis points in this measure can lead to recession. However, the climb can be attributed to more people entering the labor force, rather than an increase in the number of layoffs. Indeed, the labor force participation rate climbed to 62.7% in July, and had it held steady, the unemployment rate would have remained unchanged (4.1%) from the prior month.
Market Interest Rates
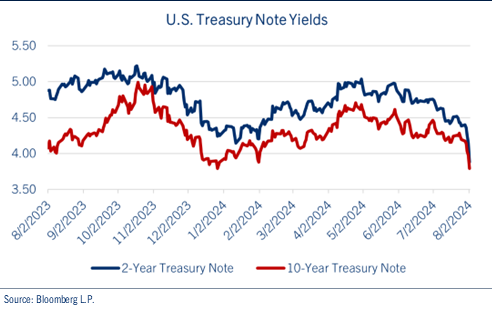
Since the Federal Reserve began its rate pause last summer, U.S. Treasury yields have traded in a volatile range, peaking last October before hitting new lows in recent weeks. The yield on the 10-year Treasury note fell 20 basis points on Friday alone and plunged ~50 basis points since July 24th, when the GDP report revealed stronger-than-expected growth in the second quarter. See chart: U.S. Treasury Note Yields.

Of course, the important question is, “what was the market’s message?” Was it predicting recession, or simply attempting to force the Fed’s hand to lower rates? We view the move of the 2-year yield, which now stands ~125-150 basis points lower than the fed funds rate, as a definitive market message that the Fed must reduce rates soon.
However, we’re not convinced recession is upon us, nor do we think an extended rate cutting cycle is looming…despite the current market panic. Instead, we think the Fed must take rates lower to align nominal GDP (real GDP plus inflation) with the overnight lending rate to improve balance in the economy.
Consequently, a move lower of this magnitude could resemble the non-recessionary rate cutting cycle of the mid-1990s, rather than the more aggressive cycles in 2000 and 2008.
In addition, despite the volatility in the U.S. Treasury market, corporate credit has remained very stable. Last Friday’s volatility notwithstanding, spread sectors typically act as signal, and we view last Friday’s moves wider as more of a reaction than signal.
Finaly, our expectations for a tweak lower in rates is also supported by our longer-term inflationary concerns. To be sure, the combination of unemployment rate below 5.0% can still be considered “full employment,” and the Fed’s balance sheet remains bloated at >$7.0 trillion, and a federal budget deficit approaching 7.0% of GDP can all be considered inflationary, limiting the Fed’s flexibility in balancing its dual mandate.
Equity Markets
After the AI-driven, large cap, growth and technology gains in the first half of the year, this summer has witnessed a transition in market leadership to beneficiaries of lower rates including small caps, value and equal-weighted index outperformance.
To be sure, valuation concerns were magnified by a thus far mixed earnings season, as massive AI spending by large cap technology companies caused investors to question the potential payoff. Investor sentiment was also frayed given the uncertain domestic political situation, as well as increasingly troubling geopolitical developments.
Therefore, we believe Friday’s jobs report and ensuing market sell-off was a perfect storm of volatility for the start of the seasonally weak, dog days of summer. Investors seemingly took the weak employment report as an indication of a material deterioration in the labor market, sparking a sharp selloff of risk assets while Treasury yields plummeted. We’re not convinced that a “miss” of 60,000 jobs portends imminent disaster for the U.S. economy.
The market’s fear gauge, the CBOE Volatility Index (VIX) surged above 20, which historically points to further volatility ahead.
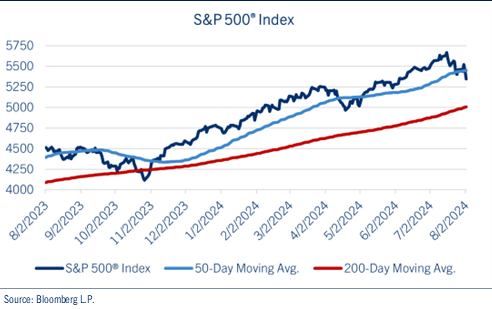
Indeed, the S&P 500® Index dropped by more than 3.0% over the course of trading on Thursday and Friday last week, with futures indicating a decline of a similar magnitude early Monday morning. See chart: S&P 500® Index.

Of course, there is wisdom in price, and the market’s going to do what the market wants to do.
In what we expect to be a near-term volatile period, here a few thoughts:
- The S&P 500® closed below its 50-day moving average (DMA) of 5,450 on Friday, bringing the next technical support level of 5,250 (the late-June low) into play.
- Should that not hold, the Index’s 200-DMA of ~5,000 is the next level of support, which essentially coincides with the mid-April low. A move of this magnitude would represent a “correction” typically defined as a move of 10.0% lower from a recent market high, in this case, 5,639 in mid-July.
- Despite the volatility, more than 56.0% of companies in the S&P 500® are trading above their 50-DMA and ~70.0% > than their 200-DMA, suggesting breadth hasn’t collapsed.
- The equal-weighted S&P 500® remains above its 50-DMA and continues to hold firm against the cap-weighted Index, suggesting rotation and broader participation trends may support equities going forward.
- Fundamentally, we continue to look for below consensus Index profits of $237.50 this year, with a yearend fair value estimate of 5,250 for the S&P 500®.
We will continue to monitor all developments in the coming days and weeks.
Be well and stay safe!
*****
IMPORTANT DISCLOSURES
Comerica Wealth Management consists of various divisions and affiliates of Comerica Bank, including Comerica Bank & Trust, N.A. Inc. and Comerica Insurance Services, Inc. and its affiliated insurance agencies.
Comerica Bank and its affiliates do not provide tax or legal advice. Please consult with your tax and legal advisors regarding your specific situation.
Non-deposit Investment products offered by Comerica and its affiliates are not insured by the FDIC, are not deposits or other obligations of or guaranteed by Comerica Bank or any of its affiliates, and are subject to investment risks, including possible loss of the principal invested.
Unless otherwise noted, all statistics herein obtained from Bloomberg L.P.
This is not a complete analysis of every material fact regarding any company, industry or security. The information and materials herein have been obtained from sources we consider to be reliable, but Comerica Wealth Management does not warrant, or guarantee, its completeness or accuracy. Materials prepared by Comerica Wealth Management personnel are based on public information. Facts and views presented in this material have not been reviewed by, and may not reflect information known to, professionals in other business areas of Comerica Wealth Management, including investment banking personnel.
The views expressed are those of the author at the time of writing and are subject to change without notice. We do not assume any liability for losses that may result from the reliance by any person upon any such information or opinions. This material has been distributed for general educational/informational purposes only and should not be considered as investment advice or a recommendation for any particular security, strategy or investment product, or as personalized investment advice.
Diversification does not ensure a profit or protect against a loss in a declining market. Past performance is no guarantee of future returns. The performance of an index is not an exact representation of any particular investment, as you cannot invest directly in an index. The material is not intended as an offer or solicitation for the purchase or sale of any financial instrument. The investments and strategies discussed herein may not be suitable for all clients.
The S&P 500® Index, S&P MidCap 400 Index®, S&P SmallCap 600 Index® and Dow Jones Wilshire 500® (collectively, “S&P® Indices”) are products of S&P Dow Jones Indices, LLC or its affiliates (“SPDJI”) and Standard & Poor’s Financial Services, LLC and has been licensed for use by Comerica Bank, on behalf of itself and its Affiliates. Standard & Poor’s® and S&P® are registered trademarks of Standard & Poor’s Financial Services, LLC (“S&P”) and Dow Jones® is a registered trademark of Dow Jones Trademark Holdings, LLC (“Dow Jones”). The S&P 500®® Index Composite is not sponsored, endorsed, sold or promoted by SPDJI, Dow Jones, S&P, or their respective affiliates and none of such parties make any representation regarding the advisability of investing in such product nor do they have any liability for any errors, omissions, or interruptions of the S&P Indices.
NEITHER S&P DOW JONES INDICES NOR STANDARD & POOR’S FINANCIAL SERVICES, LLC GUARANTEES THE ADEQUACY, ACCURACY, TIMELINESS AND/OR THE COMPLETENESS OF THE WAM STRATEGIES OR ANY DATA RELATED THERETO OR ANY COMMUNICATION, INCLUDING BUT NOT LIMITED TO, ORAL OR WRITTEN COMMUNCATION (INCLUDING ELECTRONIC COMMUNICATIONS) WITH RESPECT THERETO. S&P DOW JONES INDICES AND STANDARD & POOR’S FINANCIAL SERVICES, LLC SHALL NOT BE SUBJECT TO ANY DAMAGES OR LIABILITY FOR ANY ERRORS, OMISSIONS, OR DELAYS THEREIN. S&P DOW JONES INDICES AND STANDARD & POOR’S FINANCIAL SERVICES, LLC MAKE NO EXPRESS OR IMPLIED WARRANTIES, AND EXPRESSLY DISCLAIM ALL WARRANTIES, OR MERCHANTABILITY OR FITNESS FOR A PARTICULAR PURPOSE OR USE OR AS TO RESULTS TO BE OBTAINED BY COMERICA AND ITS AFFILIATES, OR ANY OTHER PERSON OR ENTITY FROM THE USE OF THE S&P INDICES OR WITH RESPECT TO ANY DATA RELATED THERETO. WITHOUT LIMITING ANY OF THE FOREGOING, IN NO EVENT WHATSOEVER SHALL S&P DOW JONES INDICES OR STANDARD & POOR’S FINANCIAL SERVICES, LLC BE LIABLE FOR ANY INDIRECT, SPECIAL, INCIDENTAL, PUNITIVE, OR CONSEQUENTIAL DAMAGES INCLUDING BUT NOT LIMITED TO, LOSS OF PROFITS, TRADING LOSSES, LOST TIME OR GOODWILL, EVEN IF THEY HAVE BEEN ADVISED OF THE POSSIBILITY OF SUCH DAMAGES, WHETHER IN CONTRACT, TORT, STRICT LIABILITY, OR OTHERWISE. THERE ARE NO THIRD-PARTY BENEFICIARIES OF ANY AGREEMENTS OR ARRANGEMENTS BETWEEN S&P DOW JONES INDICES AND COMERICA AND ITS AFFILIATES, OTHER THAN THE LICENSORS OF S&P DOW JONES INDICES.
“Russell 2000® Index and Russell 3000® Index” are trademarks of Russell Investments, licensed for use by Comerica Bank. The source of all returns is Russell Investments. Further redistribution of information is strictly prohibited.
MSCI EAFE® is a trademark of Morgan Stanley Capital International, Inc. (“MSCI”). Source: MSCI. MSCI makes no express or implied warranties or representations and shall have no liability whatsoever with respect to any MSCI data contained herein. The MSCI data may not be further redistributed or used as a basis for other indexes or any securities or financial products. This report is not approved, endorsed, reviewed or produced by MSCI. None of the MSCI data is intended to constitute investment advice or a recommendation to make (or refrain from making) any kind of investment decision and may not be relied on as such.
FTSE International Limited (“FTSE”) © FTSE 2016. FTSE® is a trademark of London Stock Exchange Plc and The Financial Times Limited and is used by FTSE under license. All rights in the FTSE Indices vest in FTSE and/or its licensors. Neither FTSE nor its licensors accept any liability for any errors or omissions in the FTSE Indices or underlying data.comerica.com/insights


