by John Lynch, CIO, & Team, Comerica Wealth Management
Equity market leadership has experienced a dramatic shift in recent weeks.
Executive Summary
- The recent equity market shift saw a move away from the mega-cap "Magnificent 7" to a broader market performance following the June CPI report.
- Small-cap stocks experienced a significant rally, with the Russell 2000 index gaining approximately 11.5% over five trading days, signaling potential market turns and strong future returns.
- Small caps are trading at attractive valuations and have higher exposure to sectors like financials and healthcare, positioning them well if the market rally broadens beyond the tech sector.
Though previous rate cutting cycles have largely been unkind to small caps, the non-recessionary easing of 1995 bodes well for the space. We continue to look for two Fed rate cuts in the second half of this year, providing the potential for further tailwinds as the U.S. economy avoids recession.
Rotation
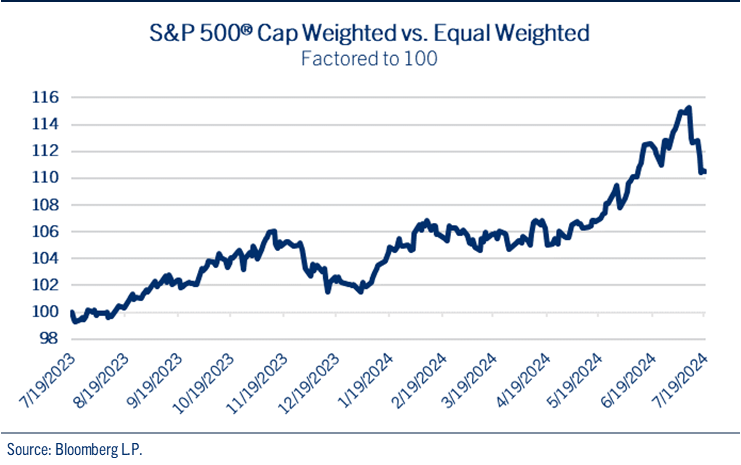
Equity market leadership has experienced a dramatic shift in recent weeks. In the first half of the year, the market was dominated by the mega-cap "Magnificent 7," which contributed over half of the S&P 500®'s 15.3% total return. This trend changed following the June CPI report, which showed the first month-over-month decline in prices since 2020. This report sparked a rotation in equities, with investors reallocating from this year's outperformers to laggards, leading to a more balanced performance across the equity market. See chart: S&P 500® Cap Weighted vs Equal Weighted
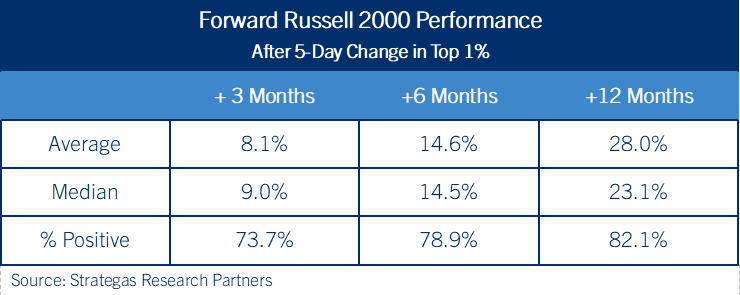
The impact of this rotation is most evident in the strong rally of small-cap stocks.
The benchmark Russell 2000 index, which had been nearly flat in the first half of the year, surged approximately 11.5% over five trading days from July 9 to July 16. This rally ranks among the top 0.2% of all five-day periods since the index's inception. Historically, such momentum shifts have often signaled significant market turns and strong future returns. See table: Forward Russell 2000 Performance
Catalysts
Indeed, several catalysts that have propelled small caps higher may continue.
Messaging from the Fed following June’s CPI report underscores the increasing confidence that monetary policymakers will be able to cut rates this year. Small-cap stocks stand to benefit more than large cap stocks from lower interest rates as roughly 40% of companies in the Russell 2000 index are unprofitable and thus more dependent on capital market financing to fund operations.
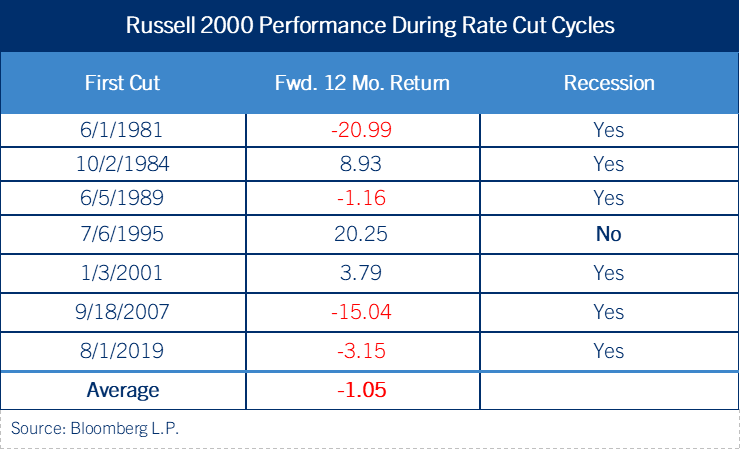
It's important to note that while lower interest rates could benefit small caps, past rate-cutting cycles have been challenging for the Russell 2000 index. Since 1981, the index has averaged a -1.5% return in the 12 months following the first Fed rate cut of a cycle. However, understanding the context of rate cuts is crucial. In six out of seven rate-cutting cycles, the cuts preceded an economic downturn leading to a recession. The exception was 1995, when a recession did not follow, and the index rallied 20.2% over the next year. See table: Russell 2000 Performance During Rate Cut Cycles
Valuation
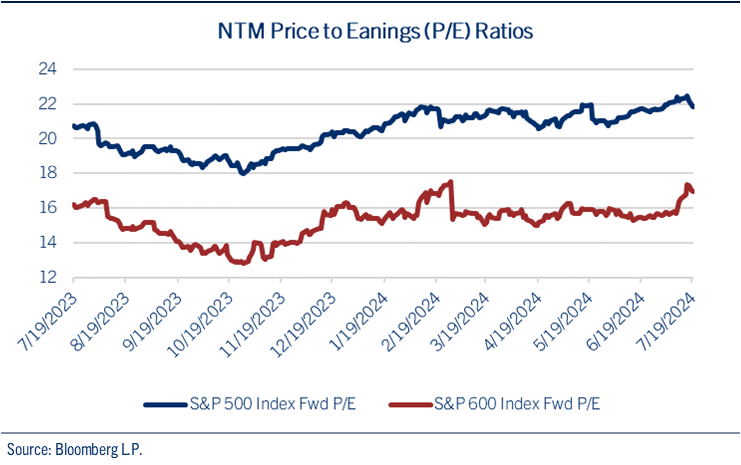
Currently, small-cap stocks are trading at attractive valuations compared to their larger counterparts. Large caps are significantly more expensive than their historical averages, making small caps appealing for investors seeking growth opportunities at lower prices. The chart below shows the Price to Earnings (P/E) ratios for the large cap S&P 500® index compared to the small cap S&P 600 Index®. See chart: NTM Price to Earnings (P/E) Ratios
Part of the reason small caps are trading at lower valuations is due to sector composition.
Small caps have higher exposure to financials, consumer discretionary, energy, and healthcare sectors. In contrast, large caps are heavily weighted towards technology. If the market rally continues to broaden beyond the tech sector, small caps could see significant benefits. However, if the economy slows down, these sectors might face challenges, impacting small cap performance.
The political landscape has also played a role in the small-cap rally. Increasing odds of a Republican administration is seen as a benefit for smaller companies which stand to benefit more from the prospect of lower taxes and less regulation.
Conclusion
The recent rotation into small-cap stocks is driven by a combination of attractive valuations, sector composition, and shifting market dynamics. Given the smaller size and relatively less liquidity of the small cap market, it only takes a small spark to ignite a powerful move in the space.
Though previous rate cutting cycles have largely been unkind to small caps, the non-recessionary easing of 1995 bodes well for small cap stocks. We continue to look for two Fed rate cuts in the second half of this year, providing the potential for further tailwinds as the U.S. economy avoids recession.
Copyright © Comerica Wealth Management
IMPORTANT DISCLOSURES
Comerica Wealth Management consists of various divisions and affiliates of Comerica Bank, including Comerica Bank & Trust, N.A. Inc. and Comerica Insurance Services, Inc. and its affiliated insurance agencies.
Comerica Bank and its affiliates do not provide tax or legal advice. Please consult with your tax and legal advisors regarding your specific situation.
Non-deposit Investment products offered by Comerica and its affiliates are not insured by the FDIC, are not deposits or other obligations of or guaranteed by Comerica Bank or any of its affiliates, and are subject to investment risks, including possible loss of the principal invested.
Unless otherwise noted, all statistics herein obtained from Bloomberg L.P.
This is not a complete analysis of every material fact regarding any company, industry or security. The information and materials herein have been obtained from sources we consider to be reliable, but Comerica Wealth Management does not warrant, or guarantee, its completeness or accuracy. Materials prepared by Comerica Wealth Management personnel are based on public information. Facts and views presented in this material have not been reviewed by, and may not reflect information known to, professionals in other business areas of Comerica Wealth Management, including investment banking personnel.
The views expressed are those of the author at the time of writing and are subject to change without notice. We do not assume any liability for losses that may result from the reliance by any person upon any such information or opinions. This material has been distributed for general educational/informational purposes only and should not be considered as investment advice or a recommendation for any particular security, strategy or investment product, or as personalized investment advice.
Diversification does not ensure a profit or protect against a loss in a declining market. Past performance is no guarantee of future returns. The performance of an index is not an exact representation of any particular investment, as you cannot invest directly in an index. The material is not intended as an offer or solicitation for the purchase or sale of any financial instrument. The investments and strategies discussed herein may not be suitable for all clients.
The S&P 500® Index, S&P MidCap 400 Index®, S&P SmallCap 600 Index® and Dow Jones Wilshire 500® (collectively, “S&P® Indices”) are products of S&P Dow Jones Indices, LLC or its affiliates (“SPDJI”) and Standard & Poor’s Financial Services, LLC and has been licensed for use by Comerica Bank, on behalf of itself and its Affiliates. Standard & Poor’s® and S&P® are registered trademarks of Standard & Poor’s Financial Services, LLC (“S&P”) and Dow Jones® is a registered trademark of Dow Jones Trademark Holdings, LLC (“Dow Jones”). The S&P 500®® Index Composite is not sponsored, endorsed, sold or promoted by SPDJI, Dow Jones, S&P, or their respective affiliates and none of such parties make any representation regarding the advisability of investing in such product nor do they have any liability for any errors, omissions, or interruptions of the S&P Indices.
NEITHER S&P DOW JONES INDICES NOR STANDARD & POOR’S FINANCIAL SERVICES, LLC GUARANTEES THE ADEQUACY, ACCURACY, TIMELINESS AND/OR THE COMPLETENESS OF THE WAM STRATEGIES OR ANY DATA RELATED THERETO OR ANY COMMUNICATION, INCLUDING BUT NOT LIMITED TO, ORAL OR WRITTEN COMMUNCATION (INCLUDING ELECTRONIC COMMUNICATIONS) WITH RESPECT THERETO. S&P DOW JONES INDICES AND STANDARD & POOR’S FINANCIAL SERVICES, LLC SHALL NOT BE SUBJECT TO ANY DAMAGES OR LIABILITY FOR ANY ERRORS, OMISSIONS, OR DELAYS THEREIN. S&P DOW JONES INDICES AND STANDARD & POOR’S FINANCIAL SERVICES, LLC MAKE NO EXPRESS OR IMPLIED WARRANTIES, AND EXPRESSLY DISCLAIM ALL WARRANTIES, OR MERCHANTABILITY OR FITNESS FOR A PARTICULAR PURPOSE OR USE OR AS TO RESULTS TO BE OBTAINED BY COMERICA AND ITS AFFILIATES, OR ANY OTHER PERSON OR ENTITY FROM THE USE OF THE S&P INDICES OR WITH RESPECT TO ANY DATA RELATED THERETO. WITHOUT LIMITING ANY OF THE FOREGOING, IN NO EVENT WHATSOEVER SHALL S&P DOW JONES INDICES OR STANDARD & POOR’S FINANCIAL SERVICES, LLC BE LIABLE FOR ANY INDIRECT, SPECIAL, INCIDENTAL, PUNITIVE, OR CONSEQUENTIAL DAMAGES INCLUDING BUT NOT LIMITED TO, LOSS OF PROFITS, TRADING LOSSES, LOST TIME OR GOODWILL, EVEN IF THEY HAVE BEEN ADVISED OF THE POSSIBILITY OF SUCH DAMAGES, WHETHER IN CONTRACT, TORT, STRICT LIABILITY, OR OTHERWISE. THERE ARE NO THIRD-PARTY BENEFICIARIES OF ANY AGREEMENTS OR ARRANGEMENTS BETWEEN S&P DOW JONES INDICES AND COMERICA AND ITS AFFILIATES, OTHER THAN THE LICENSORS OF S&P DOW JONES INDICES.
“Russell 2000® Index and Russell 3000® Index” are trademarks of Russell Investments, licensed for use by Comerica Bank. The source of all returns is Russell Investments. Further redistribution of information is strictly prohibited.
MSCI EAFE® is a trademark of Morgan Stanley Capital International, Inc. (“MSCI”). Source: MSCI. MSCI makes no express or implied warranties or representations and shall have no liability whatsoever with respect to any MSCI data contained herein. The MSCI data may not be further redistributed or used as a basis for other indexes or any securities or financial products. This report is not approved, endorsed, reviewed or produced by MSCI. None of the MSCI data is intended to constitute investment advice or a recommendation to make (or refrain from making) any kind of investment decision and may not be relied on as such.
FTSE International Limited (“FTSE”) © FTSE 2016. FTSE® is a trademark of London Stock Exchange Plc and The Financial Times Limited and is used by FTSE under license. All rights in the FTSE Indices vest in FTSE and/or its licensors. Neither FTSE nor its licensors accept any liability for any errors or omissions in the FTSE Indices or underlying data.comerica.com/insights