
by Russell Investments Strategic Asset Allocation Team
Executive summary:
The current macroeconomic backdrop mandates prudent portfolio management amid heightened uncertainties.
- We continue to maintain a cautious risk stance, with active risk of the 2024 positions below long-term levels.
- We increased our exposure to duration, which is now the largest contributor to active risk. We achieved this overweight using a mix of nominal and real bonds.
- We are maintaining our overall growth asset exposure, but we are leaning toward equities over credit.
- We remain neutral on equity regions and currencies.
How might investors consider positioning their portfolios amid today's complex and uncertain economic landscape?
Our 2024 strategic positioning update explains how we're positioning our portfolios as 2024 hits its stride. This work is based on an analysis of market conditions over a cyclical horizon (3-5 years) discussed by our macroeconomist team, translation of these insights into asset class return forecasts by our forecasting team, and positioning done by our asset allocation team. Let's dig in.
Current market environment summary
- Recession risk remains elevated: Tight monetary policy and emerging signs of a softening labor market increase the risk assessment of a policy misstep, which may cause a recession. So far, strong earnings growth and stable GDP (gross domestic product) are driving equity and credit markets. Our view is that the markets are priced for an optimistic scenario where recession risks don't materialize.
- Inflation is cooling but remains above the U.S. Federal Reserve's (Fed) target: We are seeing a decline in inflation, with levels moving closer to central bank targets. While most economists expect this downtrend to continue, a recent uptick in inflation has investors questioning the time it will take to reach the Fed's target.
- Unemployment remains low and resilient: Labor market metrics, like job openings and the pace at which unemployed individuals find employment, are as good as pre-pandemic levels. High nominal wage growth is still an inflation watchpoint, as it will push prices higher.
- We expect the Fed to slowly pull down the funds rate. As inflation stabilizes, the Federal Reserve is expected to lower interest rates in 2024. As of this writing, three cuts are priced in. However, with strong growth, favorable labor markets, and inflation above target, the Fed is in wait-and-see mode.
Asset allocation positioning
The first step in setting a strategic asset allocation is to characterize what a successful outcome looks like. A simplified example outcome might be achieving a return of 6% over the next 20 years to meet a future spending goal (like retirement income) with the least amount of shortfall risk. In designing an allocation to meet this goal, we use long-range capital market assumptions (CMAs) to identify weights to asset class exposures that best achieves this goal.
Now, 20 years is a reasonably long horizon, where the CMAs relevant for the first five years may differ in years 5-10 or the latter part of the horizon. For example, we project that the cash rates, which are just over 5% today, will probably average 3% over the latter part of the 20-year horizon. This has implications on how one might invest over the next 5 years versus the latter part of the 20-year horizon.
In setting a strategic allocation, we use a dual-horizon approach. We first develop an allocation using equilibrium-like CMA assumptions that pertain to a long horizon (think 30 years). We refer to this as the long-term positioning. We then develop a more detailed description of how we see markets evolving over the next five years, considering the path of interest rates, spreads, and the potential for different economic scenarios that might unfold. This information evaluates whether the long-term positions are optimal for the next five years. If we believe not, then we use these expanded descriptions of the next five years to make medium-term adjustments to the long-term positioning. Exhibit 2 summarizes the economic scenarios we used to help determine asset allocation positioning relevant for the next 5 years.
Exhibit 1: Economic scenario definitions
(Click image to enlarge)

We forecast that the bear or neutral scenario is the most likely outcome, each having approximately equal odds. As we juxtapose this assessment with market pricing for credit, rates and equities, we conclude that our cyclical assessment is more pessimistic than what the market is pricing. Consider that credit spreads are historically tight and that equity P/E (price-to-earnings) ratios are high relative to history. With this somewhat divergent view (ours versus the market), we've adjusted our strategic positions to lower the tracking error spent on strategic asset allocation relative to our long-term baseline, and we've shifted how we are allocating risk across the risk premia present in our allocations, as shown in Exhibits 2 and 3.
Exhibit 2: Risk premia positioning
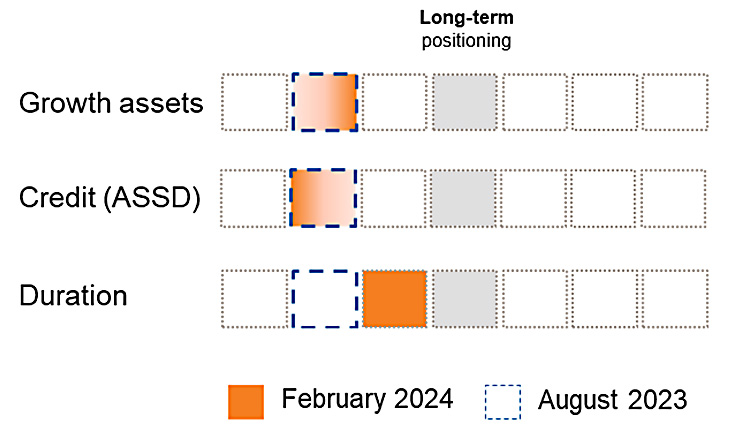
There are 3 key observations from Exhibit 2.
- We are holding smaller active weights to risk premia than normal.
- Similar positioning was present in our last cyclical update.
- We have increased our exposure to duration.
Exhibit 3: Contribution to active risk
(Click image to enlarge)

Exhibit 3, describes the difference in active risk being sought against a generic benchmark from strategic asset allocation positions in the long-term and in the cyclically adjusted 2024 positions:
- The active risk of the 2024 positions is below long-term levels.
- Duration is now the largest contributor to active risk.
- The percentage of active risk spent on equity and credit is similar.
Next, we summarize the rationale for our active positions:
Nominal Treasury bonds and duration
We're allocating relatively more to government bonds. We believe that yields are higher than equilibrium levels, primarily due to inflation concerns. Further, the duration's payoff profile during a risk-off event should help the allocation's performance. Duration is now the highest contributor to active risk in our strategic asset allocation.
Treasury Inflation-Protected Securities (TIPS)
We use inflation-linked bonds in addition to nominal bonds to achieve our duration overweight. Although we expect the return on nominal and inflation-linked bonds to be similar over a cyclical horizon, holding each helps diversify the duration exposure with regard to inflation risk. Nominal bonds will provide a higher payoff in a recession scenario, while inflation-linked bonds will hold value even if inflation surprises to the upside. Moreover, the real interest rate on TIPS (Treasury Inflation-Protected Securities) is high relative to history, with the 10-year par real yield close to 2%.
Cyclical preference for equity over credit
Relative to our prior strategic update, we're maintaining our overall growth asset exposure, but we are leaning toward equities over credit. With credit spreads tight, we see limited upside. While equities are relatively expensive, there is potential for earnings to surprise on the upside, driven by the realization of artificial intelligence (AI)- driven efficiency improvements.
Neutral on equity regions
We currently don't hold a strong conviction that any equity region will outperform another, as we see a balance of cyclical and value-based arguments that offset one another.
Currency
Right now, we do not have any strategic active currency positions augmenting our asset allocation positions.
Alternative diversifiers
We note that alternative diversifiers like cross-asset trends and actively managed long volatility can also be used (in addition to duration) to protect portfolios from drawdowns. These help diversify drawdown protection, particularly in scenarios with elevated stock-bond correlation.
Outlook of key performance drivers
Treasury bonds/ Duration
We forecast the return to duration as the premium a 10-year bond has over cash. Over a horizon of 20-30 years, we forecast a return to a duration of 1.5%. As we model out the next five years, we expect this return to be closer to 2.5%. Over the past 12 months, the outlook for duration has undergone a significant improvement. Higher yields, the possibility of rate cuts, and the risk of a demand-driven recession over a cyclical horizon have collectively enhanced the potential for capital gains from holding longer-duration bonds.
Treasury-Inflation Protected Securities
Inflation has decreased notably over the past year but remains higher than the current breakeven inflation levels and the Federal Reserve's target. We anticipate Treasury inflation-protected securities (TIPS) and nominal bonds to yield a similar excess return of 2.5% above cash over a 5-year horizon. This projection is slightly higher than our long-term forecasts, where we expect nominal bonds to outperform TIPS by approximately 50 basis points (bps), reflecting a positive inflation risk premium.
Credit
We forecast credit as the return of a high yield (HY) bond over a duration-matched Treasury. Over the next five years, we expect returns from credit to be near 2.5%, marginally lower than our long-term assumption of 3.0%. The lower-than-equilibrium forecast is largely due to the current low spread levels and higher-than-normal odds of a recession.
Equity
We project global equity returns over the next five years to undershoot our long-term forecasted return of 5.2% above cash. The combination of resilient labor markets, robust consumer spending, and the potential for rate cuts by the Federal Reserve continues to push equity prices and earnings multiples higher. Much like credit, we believe the equity markets are underestimating the potential for a slowdown, which would likely impact corporate earnings. This diminishes the attractiveness of equities on a risk-adjusted basis over the next five years compared to equilibrium expectations.
Equity-bond correlation
Currently, the stock-bond correlation1 of .6 is much higher than the normal -.2 to .2 range. As inflation continues to moderate, we think the rolling stock-bond correlation will fall. We see the dominant risk shifting from inflation persistency to a growth shock, driven by the Federal Reserve maintaining relatively high policy rates. Consequently, we expect the correlation between stocks and bonds to fall back to normal levels, dipping into the negative territory if a recession ensues but ultimately settling close to zero.
1 Measured as the correlation between S&P 500 returns in excess of cash and the inverse of the 10-year bond yield.
Copyright © Russell Investments