


by Adam Turnquist, CMT, Chief Technical Strategist, LPL Research
Today’s LPL Financial Chart of the Day compares stock market performance ahead of Super Tuesday and election results.
Today officially marks Super Tuesday, a day marked by multiple states simultaneously holding their presidential primary elections or caucuses. It typically occurs in February or March and can be a critical day for candidates, as the large number of delegates up for grabs can solidify their name as the official presidential nominee.
A total 15 states and one territory will hold either Republican or Democratic primaries today (or caucuses), representing just over 70% of the total number of delegates needed for each presential party’s nomination.
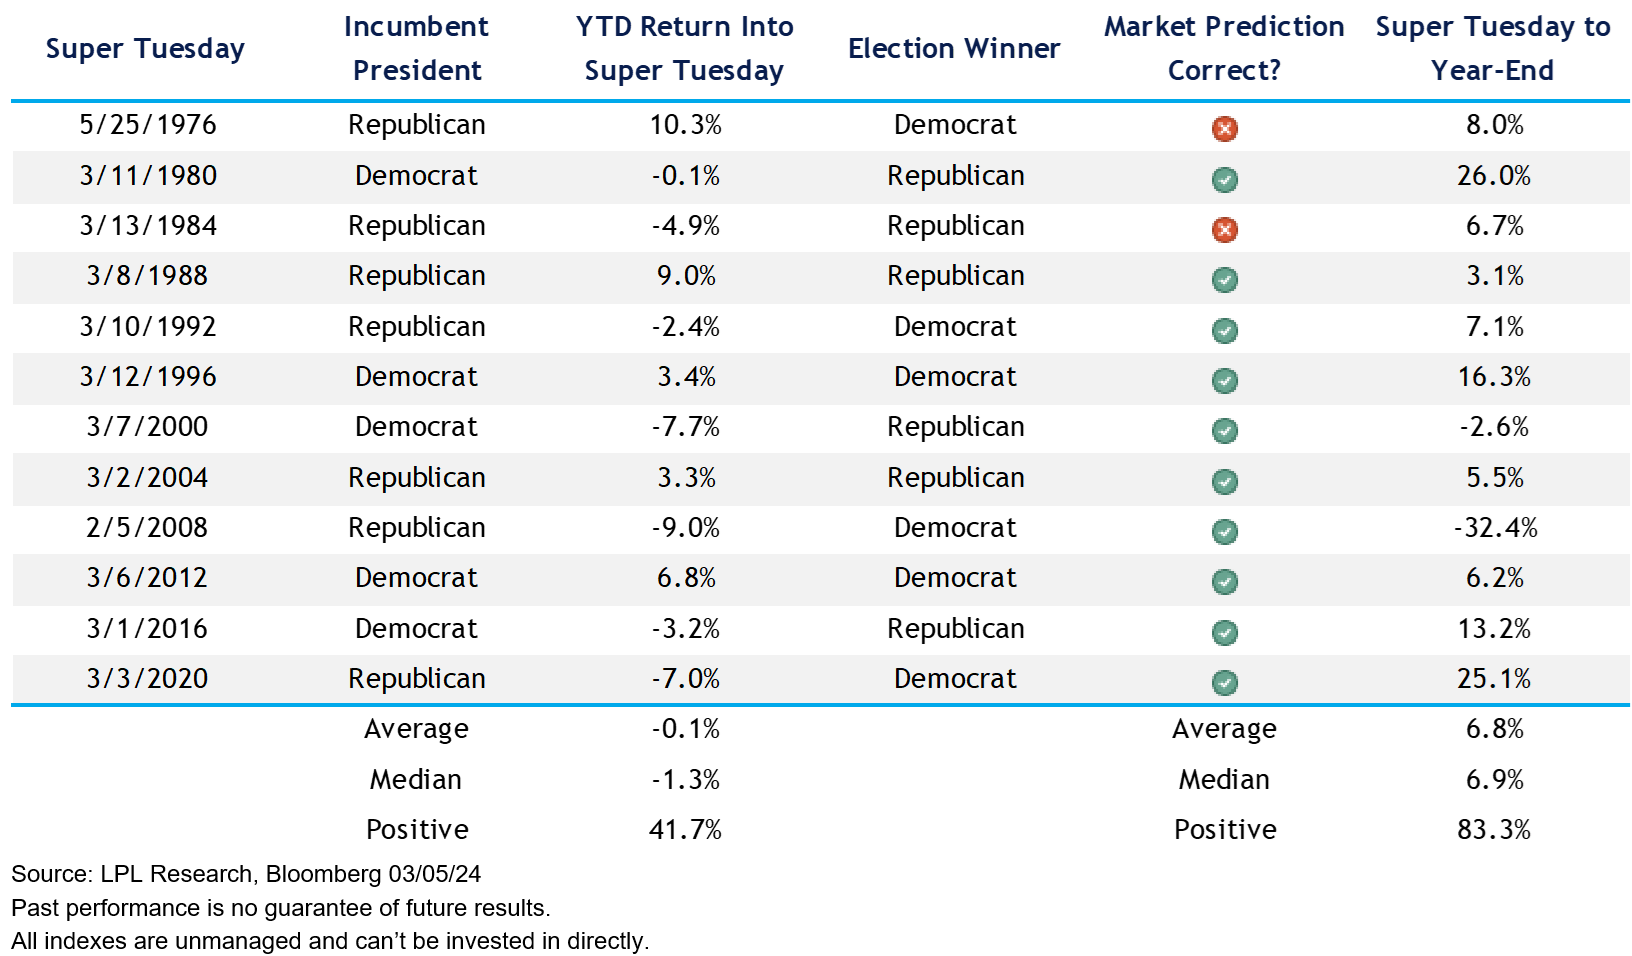
Since 1976, when Super Tuesday first surfaced, market performance ahead of the primaries has correlated closely with election results. While acknowledging the limited data, when the S&P 500 was higher ahead of Super Tuesday, the incumbent president’s political party won the election four of the last five times. And when stocks were lower into Super Tuesday, the incumbent president’s party lost the election six of the last seven times.
With little ambiguity over who will be on the ticket this fall (very low odds for anything other than a Biden-Trump rematch), the market has had one less thing to worry about this year. The S&P 500 is up over 7% into Super Tuesday, a historically good sign for the incumbent president’s political party on election night.
Source: LPL Research, Bloomberg 03/05/24
Past performance is no guarantee of future results.
All indexes are unmanaged and can’t be invested in directly.
Copyright © LPL Research