by Ben Nabet and Joe Auth, GMO LLC
Why Ratings Don’t Tell the Full Story in Securitized Credit
Introduction
Ratings are an important organizing principle in credit markets, often relied upon as a summary metric of default risk. While they offer a broad categorization, investors in credit markets must rely on much deeper analysis to measure and price the actual default risks involved. While this is true in all sectors of credit, it is even more pertinent within securitized credit.
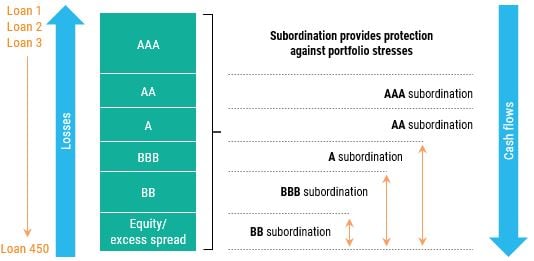
At new issue, credit rating agencies assign a credit rating to each tranche of a securitized transaction as illustrated in Exhibit 1. However, their process to reevaluate securities post-issuance is not as frequent and as robust as it is for corporate issuers. Furthermore, the actual credit risk of a securitized asset is dynamic in nature. Underlying collateral amortizes, pays off, or defaults with realized losses. In turn, senior bonds pay off while losses write down the most junior tranches of the structure. This payment dynamic requires another layer of analysis to determine and update a credit rating. Not only does the creditworthiness of the underlying collateral need to be ascertained, but the ever-evolving attachment and detachment point, or structural leverage, of the rated tranche that is evolving also needs to be accounted for. What we mean by structural leverage is that one percent of collateral loss can create more than one percent of loss on the bond. In this paper, we argue that dynamically reevaluating structural and collateral leverage is the most effective way of assessing default risk in this sector.
Exhibit 1: Typical CLO Tranche Structure
Source: Citibank
Senior, thick bonds with both a high attachment point (percentage loss in the deal needed for the bond to lose the first dollar) and a high detachment point (percentage loss in the deal needed for the bond to be completely written off) have little to no structural leverage. On the other hand, subordinated, thin bonds with both a low attachment point and a low detachment point have a lot of structural leverage. For example, in CMBS conduits the AAA bond has 30% credit support and detaches at 100%, which means that collateral losses need to reach 30% for that bond to lose a dollar. If losses reach 31%, the bond loss will be 1.4 points. CMBS BBB-bonds have on average 7% credit support and detach at 9%, which means that collateral losses need only reach 7% for the bond to lose its first dollar. If losses reach 8%, the bond will lose 50 points.
Perhaps due to the complexities of properly forecasting the underlying cash flows and their impact on the dynamically evolving capital structure, we often find that the extent of mis-rating is to the downside, where rating agencies – given their reliance on peer groups, fixed re-rating schedules, and asymmetric reputational risk – often err on the side of conservatism. The enormous number of CUSIPs issued in the securitized market makes the task of keeping these ratings up to date even more challenging.
While this may be the optimal answer at a societal level, as fundamental credit analysts, we frequently discover opportunities within these structural limitations. In the remainder of this paper, we highlight four instances within structured credit where credit ratings have proven to be an unreliable method for evaluating credit risk.
- Senior RMBS bonds in securitization with de-levered, low loan-to-value collateral were downgraded because realized losses in the early life of the trust were higher than originally anticipated by the rating agencies at issuance.
Prior to the Global Financial Crisis, RMBS bonds were underwritten and rated by credit rating agencies with default rate and underlying home price assumptions that were far too optimistic. Following much higher losses in the early life of these transactions, some bonds that were originally rated AAA started to take losses or lost a considerable amount of credit support and were hence downgraded by the agencies. Fast-forward to today and these bonds still exist with some having taken losses or having rather thin levels of credit support. Bonds that have taken losses or that have too little credit support cannot be upgraded by the agencies and will continue to carry below investment-grade ratings.
However, the underlying collateral of these bonds is far different from what it was in 2006 or 2007. Many of the borrowers remaining in the pool have made consistent payments for 10+ years and have done so through the GFC and Covid. Because of these long payment histories, loan balances have amortized significantly. Finally, home prices have increased considerably since these loans were originated. For experienced investors, these factors offer a degree of assurance, indicating that the cash flow stream derived from this collateral demonstrates a low level of credit risk and can be reliably predicted.
Additionally, from a structural perspective, these bonds have no structural leverage left; they are the 0-100 slice or may even have some credit enhancements. This means that even when losses do occur, there is no magnifying effect on our bonds. Finally, these bonds do not trade at par, allowing us to buy them at a discount from where we expect our principal recoveries to be, even in a stressed scenario.
Therefore, despite these bonds lacking a rating or being rated below investment grade, we do not view them as having a high credit risk profile and believe that the current rating assigned by the rating agencies is not representative of the actual principal risk in the future. See Case Study 1 at the end of this paper for additional detail.
- Bonds with stale ratings that previously had more credit risk but have since de-levered.
Timing matters. The credit profile of a pool of loans changes as it de-levers. Rating agencies typically re-rate only every 1 to 3 years, and often don’t keep up with changes in default probability as senior bonds are paid off or credit losses occur. During this time there may have been more payoffs than losses, meaning each tranche will then have greater thickness and stronger credit enhancement that is not captured by stale agency ratings.
As we mentioned in the introduction, it is important to consider the credit risk of the underlying collateral and the updated attachment and detachment points of bonds over time to accurately assess credit ratings, as these parameters can and do meaningfully change within a 1- to 3-year horizon. This presents a unique opportunity for investors in securitized credit to take advantage of time-varying credit enhancement that is not yet captured in overall ratings. See Case Study 2 at the end of this paper for additional detail.
- Value of government guarantees on student loans that have technically defaulted.
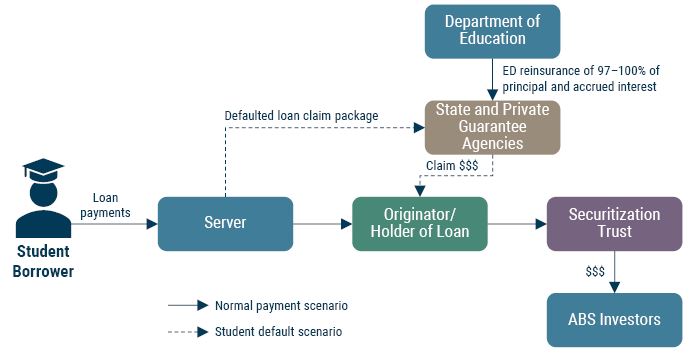
As of December 2023, approximately 8.3 million borrowers had outstanding FFELP (Federal Family Education Loan Program) student loans, totaling around $185 billion. While not all are securitized and commercially available to investors, they still constitute a significant portion of the investable student loan universe. Exhibit 2 shows the flow of capital between stakeholders in a typical FFELP securitized structure.
Exhibit 2: Flow of capital in a typical FFELP Structure
Source: JPM
Though FFELP was discontinued in 2010, outstanding FFELP loans continue to carry a government guarantee up to 97% of defaulted principal and interest, providing strong protection against credit losses to investors. After the GFC, the availability of flexible income-based repayment plans and policies of generous deferral and forbearance led to a significant slowdown in both scheduled and unscheduled student loan payments. As a result of the slowdown, a subset of these deals breached their legal final maturity dates, which led to an automatic technical default.
Despite the D ratings, when we assess the creditworthiness of these loans, we often find that current borrowers are well past their graduation dates, having since become established borrowers with long and consistent repayment histories. Cash flows in these structures are now quite predictable and there is even a material call upside in certain cases.
Once again, we find a situation where ratings are not a meaningful indicator of principal recovery or predictability of future cash flows. In fact, in this case, a technicality resulted in a credit rating that does not capture much stronger states of deleverage, creditworthiness, and overall fundamentals. See Case Study 3 at the end of this paper for additional detail.
- Perceived lack of diversification within CMBS SASB bonds.
Collateralized mortgage-backed securities (CMBS) transactions typically fall into two categories: those that are single asset, single borrower (SASB) and those that are backed by multi-borrower pools of assets. Rating agencies often penalize SASB deals, emphasizing the concentration risk within a single borrower transaction by requiring a higher level of credit support to achieve a given rating. For example, while 30% credit support might be enough to get a AAA rating in a conduit deal, 50% or more might be needed to achieve the same rating in a SASB deal.
Investors in this area, however, are able to diversify away this risk at a portfolio level by intelligently combining several such SASB bonds. Regional concentration, for example, can be effectively diversified away by grouping loans that are geographically dispersed. By taking correlations and the fundamental nature of the risks within each SASB deal into account, it is possible to then create a more stable structure with far less concentrated credit risk. Such a portfolio would have a similar concentration to a conduit tranche, but would benefit from much higher average credit enhancement at a comparable credit rating.
In this case, we are not arguing that the ratings are overly conservative or stale, but rather that one can enhance the credit risk profile of the investment further than the ratings would suggest through portfolio construction.
Conclusion
We’ve shown here that in every major sector of securitized credit, ratings do not accurately reflect default risk. As losses are accrued and loans are paid off, the extent of structural leverage and credit enhancement changes materially through the life of the asset. These are complex and idiosyncratic changes that require a deeper level of fundamental assessment beyond the scope of rating agencies. As a result, credit analysts can uncover and capitalize on such opportunities within each sector of securitized credit. This creates the opportunity for specialized investors to identify and harness alpha.
Case Study 1
Senior RMBS Bond – WMALT 2005-10 4CB3
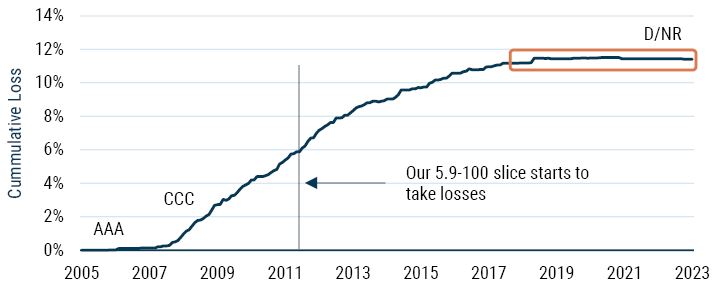
This bond was issued in 2005 with an original rating of AAA. At new issue, the slice of the bond was 5.9-100 given a pre-GFC expected loss on prime collateral below 1%. As the GFC unfolded, delinquencies and then defaults in the pool picked up meaningfully above expected levels. By mid-2009, constant default rates (CDRs) were printing in the mid-single digits with severities (the ratio of the liquidation loss and recovery percentage) in the 50s. The cumulative losses on the deal reached the original credit support of our tranche in late 2011 as noted in Exhibit 3. At that point, the delinquency pipeline in the pool was 21%, CDRs were at 5%, and the LTVs of the underlying loans were on average 92%.
Exhibit 3: Today’s collateral quality profile is similar to at issuance...But Ratings Are Not
Source: Intex
In response to this unexpected collateral performance in the early part of the deal, Moody’s downgraded this bond to Baa2 in October 2008 and then to Caa1 in February 2009. S&P followed suit and downgraded the bond to CCC in July 2009.
Fast-forward to today, and the bond now represents the 0-100 slice, meaning it has no chance of getting upgraded since any collateral loss would flow through as a bond loss. However, the underlying collateral has improved significantly: delinquencies are at 2.6%, defaults have been at 0% since June 2020, and the average LTV on the loans remaining in the pool stands at 28%. Furthermore, the borrowers remaining in the pool have a long payment history and have gone through meaningful stress tests such as the GFC and/or COVID. Finally, and perhaps most importantly, the dollar price on the bond is $81 – well below the expected recovery on this bond, which is in the high 80s.
Given the nature of the collateral left in the pool, the predictability of future cash flows, and the lack of structural leverage, we believe that the D rating is not a reliable predictor of principal at risk for this investment.
Case Study 2
Mezzanine RMBS Bond – HEAT 2006-2 M1
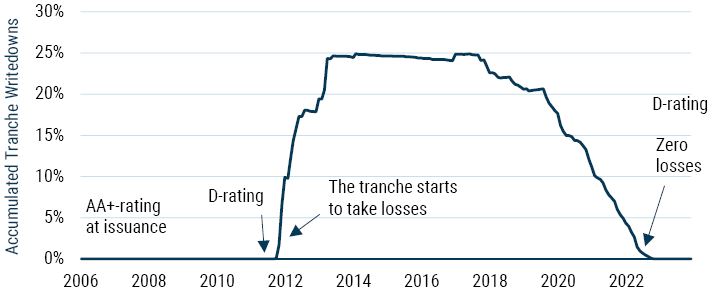
This bond was issued in 2006 with an original credit rating of AA+. At new issue, the slice was 17.6-21.35 and the rating was driven by a pre-GFC expected loss on subprime collateral in the low- to mid-single digits. As the GFC unfolded, delinquencies and then defaults in the pool picked up meaningfully above expected levels. By mid-2009, CDRs were printing in the high 20s with severities in the 60s. Cumulative losses on the deal reached the original credit support of our tranche in late 2011. At that point, CDRs were still printing in the mid-teens, severities were now in the mid-70s, and the LTVs of the underlying loans were basically at 100%. Losses continued to climb and the write-downs to the bond reached 25% by mid-2013, as shown in Exhibit 4.
Exhibit 4: Ratings often fail to change along the dynamic nature of deal structures
Source: Intex
In response to this unexpected collateral performance in the early part of the deal, Fitch, S&P, and Moody’s downgraded this bond all the way down to D, D, and C, respectively, by 2011.
One feature of the transaction was underestimated, however. The deal had a lot of excess spread built into it, meaning that the interest paid by the underlying loans on a given month was greater than the interest to be paid to the bonds. That excess interest was used to continuously build more credit support. As default and liquidation stabilized, the excess interest became large enough to absorb the losses at first, which is why the tranche stopped taking losses from 2013 to 2018; after 2018, liquidation dropped low enough to be outpaced by the excess interest, and losses on the M1 bonds started to be recouped. By November 2022, all the losses were reversed and the bond started building credit support. Today the M1 bond is the 17-100 slice, CDRs have decreased to the low single digits, and LTVs are in the low 30s.
Despite these developments, S&P and Fitch stopped rating the bond altogether in 2016 and 2022, respectively, and Moody’s last rating of Caa2 is from 2017.
Again, in this instance, we feel strongly that the current rating is not reflective of all the risk inherent to the future cash flows of the bond, but is rather biased to previous trends that are no longer applicable.
Case Study 3
ABS Senior Bond – SLMA 2008-4 A
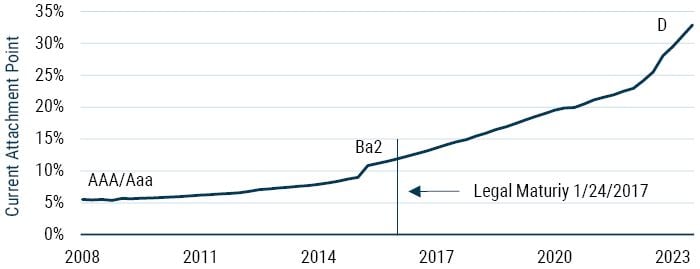
This is an ABS senior bond backed by FFELP collateral. The bond had a legal final maturity of July 25, 2022. The bond was rated AAA up until November 2016, when Moody’s downgraded it first to Ba2, expecting already that the legal final maturity would be breached. All three major rating agencies continued to downgrade the bond until it was rated D by Fitch and S&P in July of 2022.
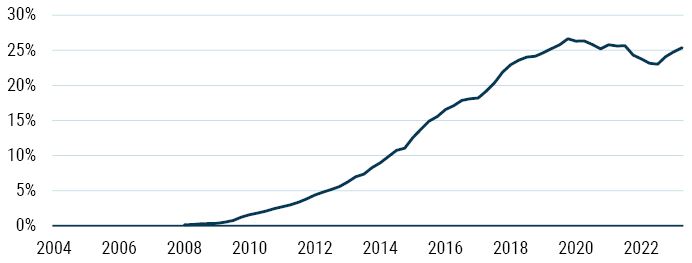
As we discussed above, the reason for breaching the legal final maturity of this bond was the steady increase of loans in the pool that entered income-based repayment plans. However, this percentage has recently stabilized and future cash flows are reasonably predictable, as shown in Exhibit 5.
Exhibit 5: Percentage of Loans Under Income-Based Repayment Plan
Source: Intex
Since new issue, the bond has consistently de-levered, starting with credit support (attachment point) of 5.55% and steadily increasing to over 32% today (see Exhibit 6). Even without the credit support, FFELP loans are 97% guaranteed by the government, which ABS structures considered in sizing the initial credit enhancement, and there was generous credit loss coverage on these bonds.
Exhibit 6: Deteriorating ratings amid growing credit support and a 97% government guarantee
Source: Intex
Furthermore, in the case of breaching the legal final maturity, it is important to note that the senior bond being evaluated here is not adversely affected. The only consequence is that the subordinated tranches in the deal are no longer receiving interest payments and instead those payments are diverted to the senior bond we own, therefore reducing the negative effect of extension caused by the loans under income-based repayment plans.
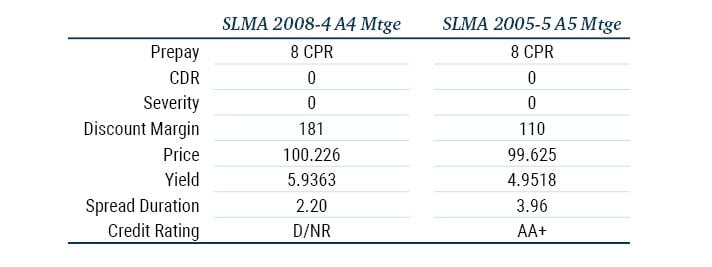
In terms of trading levels, it is worth noting that these bonds are not currently trading at distressed levels. However, when compared to almost identical profiles that have not breached their legal final maturity and hence still carry an investment-grade rating (i.e., SLMA 2005-5 A5), these bonds have recently been trading 50 to 100 bps wide (see Exhibit 7). Given how similar the actual risks are, we believe this is a compelling additional spread to own.
Exhibit 7: Fundamentals point to similar risks…but ratings say otherwise
As of January 2024 | Source: Bloomberg
Download article here.


