by Dirk Hofschire, CFA, Director of Asset Allocation Research; Jake Weinstein, CFA, Senior Vice President, Asset Allocation Research; Cait Dourney, CFA, CBE, Head of Business Cycle Research, Asset Allocation Research; Collin Crownover, PhD, Research Analyst, Asset Allocation Research, Fidelity Investments
Inflation might not keep dropping, and other indicators could take unexpected turns.
Key takeaways
- Financial markets start 2024 with a solid fundamental backdrop, including a persistent US economic expansion and monetary policymakers who are inclined toward easing.
- We believe a lot of good news is already priced into the markets, which implies asset valuations may make it more difficult for returns to surprise on the upside in 2024.
- The biggest changes in asset prices are typically driven by surprises. Some of the biggest potential surprises in 2024 could include the level of inflation, trajectory of interest-rate policy, economic growth, and more.
Both the corporate and economic backdrop look relatively solid at the start of 2024, and perhaps better than we and many economists anticipated.
Inflation declined markedly throughout 2023 and is well off its cyclical highs. Corporate profits have declined only slightly and appear to have stabilized. The US Federal Reserve signaled in December that monetary tightening is over and easing is on the way in 2024.
Most importantly, the US may be headed for its longest late cycle expansion on record, overcoming a global backdrop that includes a lethargic Chinese economy—the world's second-largest—and wars in Ukraine as well as Israel and the Gaza Strip.
Nevertheless, a powerful year-end rally in 2023 solidified that a lot of good news now is priced into asset markets. This implies asset prices may be vulnerable to either a persistence of inflation or negative economic news as 2024 progresses. Or maybe there are other less visible positive surprises lurking in the year ahead.
With all of this in mind, we believe the biggest changes in asset prices are typically driven by surprises. Following are some potential surprises Fidelity's Asset Allocation Research Team is watching for 2024.
1. Inflation may not keep dropping. And if it does, we might not like the reasons.
Consumer price inflation slowed in 2023 to between 3% and 4% (depending on the measure), and financial markets greeted this as a welcome turn toward disinflation.
We foresee far less improvement for broad inflationary indicators in the months ahead.
Dissecting inflation
The Fed breaks down inflation components three ways: goods, housing services, and services ex-housing, which compose about 40%, 30%, and 30% of US inflation, respectively.
Goods inflation hovered just above zero near the end of 2023, but keeping it this low may be difficult absent a much deeper slowdown in global growth.
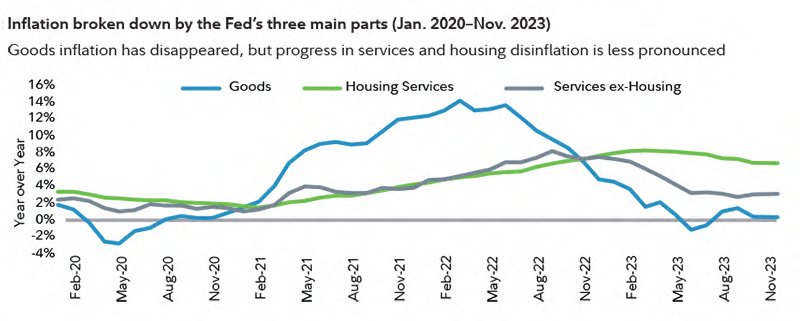
Lastly, services excluding housing remains a critical driver of the core inflation trend. This inflation component had declined for much of the year, but the rate of improvement has since stalled.
Taken together, the result has been rising measures of inflation breadth. For example, both the median and trimmed mean of the consumer price index (CPI)—which are measures that exclude items with the most extreme price changes—drifted higher late in 2023.
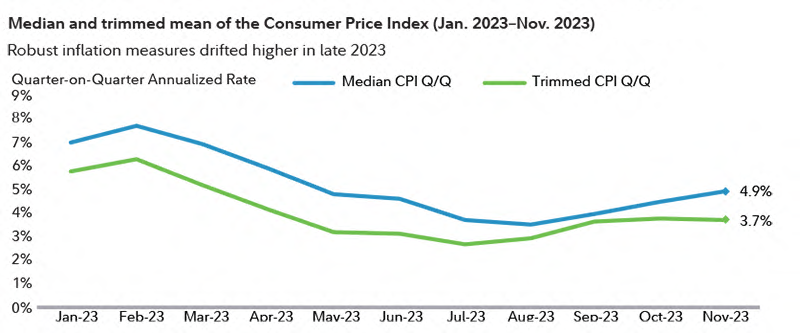
Factors that tend to drive more persistent inflation, including tight labor markets, have not changed materially. The overall unemployment rate has ticked slightly higher, although it remains near an all-time low. Looking longer term, demographic trends continue to point toward an aging work force and the addition of fewer working-age adults.
Outside of the unfavorable demographics, structural factors that appear more inflationary than the recent past include:
- Pressures on globalization that may work against goods disinflation
- Geopolitical and climate risks that create supply disruptions and incremental demand for natural resources
- The tendency of fiscal and monetary policy to remain accommodative alongside record-high levels of debt
The upshot for investors
There are reasons to believe the inflation rate will stay above the Fed's 2% target, absent a greater deterioration in economic activity. The financial markets may be overly sanguine about how easy it may be to achieve the "last mile" of disinflation.
2. The Fed may not cut rates as aggressively as expected. And if it does, it might not be for the benign reasons most investors expect.
The Federal Reserve signaled at its final 2023 meeting in December that its tightening cycle is over and rate cuts are on the way in 2024. Markets rejoiced in the immediate aftermath, as loosening financial conditions boosted optimism across most asset categories.
At the end of 2023, financial markets priced in expectations for about 150 basis points of rate cuts during 2024. If this happens because disinflation continues while the economy hums along, it should continue to be a constructive backdrop for asset prices.
Given our inflation outlook, we're concerned that if this much monetary easing occurs, it's because recession risks have increased.
Conversely, if the economy and inflation remain solid and the Fed doesn't cut rates aggressively, bond yields might rise again on the disappointment. After all, markets prematurely priced in Fed easing several times during 2023.
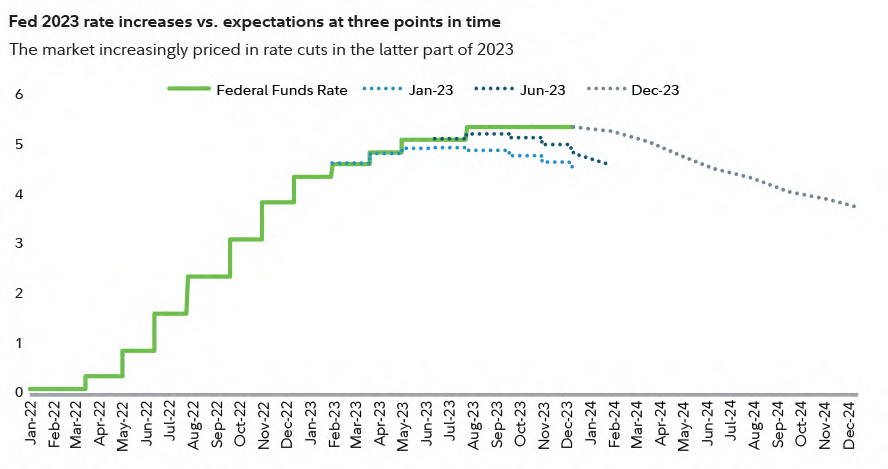
Sticking a perfect cyclical landing for economic growth and inflation is never an easy task for monetary policymakers, but it's possible the Fed will nail it in 2024. With markets pricing in a high probability of a perfect scenario, our guess is Fed policy decisions could supply a surprise or two along the way.
3. Growth risks could increase. A year after recession was widely predicted and didn't arrive, should we be concerned that an assured soft-landing victory is the conventional wisdom?
As we begin 2024, investors increasingly believe inflation has been defeated without instigating a significant economic downturn.
We agree that the US economy has proved surprisingly resilient and will start the year on solid footing. That said, the late-cycle expansion may face greater risks as the year progresses.
Misleading economic indicators?
The Conference Board's index of leading economic indicators, which attempts to provide an early signal of potential turning points in the business cycle, largely misled investors in 2023. This index dropped throughout 2023. Also, the ratio of leading indicators to coincident and lagging indicators plummeted to a lower level than at any time in history outside of a recession and registered its second-lowest reading in history (the 2008 financial crisis set the record).
There were plenty of pockets of weakness in 2023, including tightening credit and banking failures early in the year, a steep drop in housing construction amid decade-high mortgage rates, and stagnant manufacturing output. However, this weakness never translated into a significant, broad-based deceleration of economic growth.
The positive surprise
On the contrary, coincident and lagging indicators strengthened for the year.
- Consumer spending accelerated as positive real income growth, tight labor markets, ongoing spend-down of excess savings, and rising net worth supported the consumer sector.
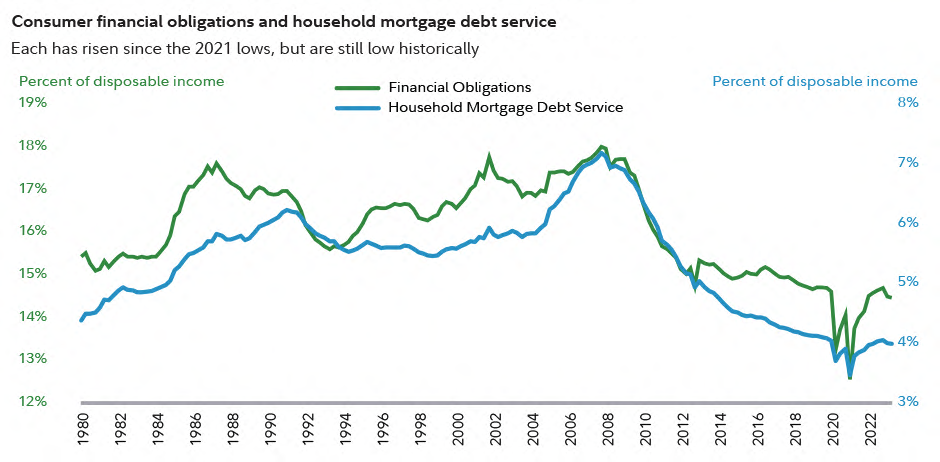
- Consumers' restrained debt levels and high proportion of fixed-rate mortgage debt insulated them from experiencing significant impact from higher interest rates.
- Corporate profit margins in most sectors stabilized, reducing the need for companies to protect profitability by implementing layoffs.
- Housing activity, including new starts and permits, stabilized and home prices resumed an upward trajectory.
- The number of banks tightening lending standards stopped rising, and overall financial conditions improved.
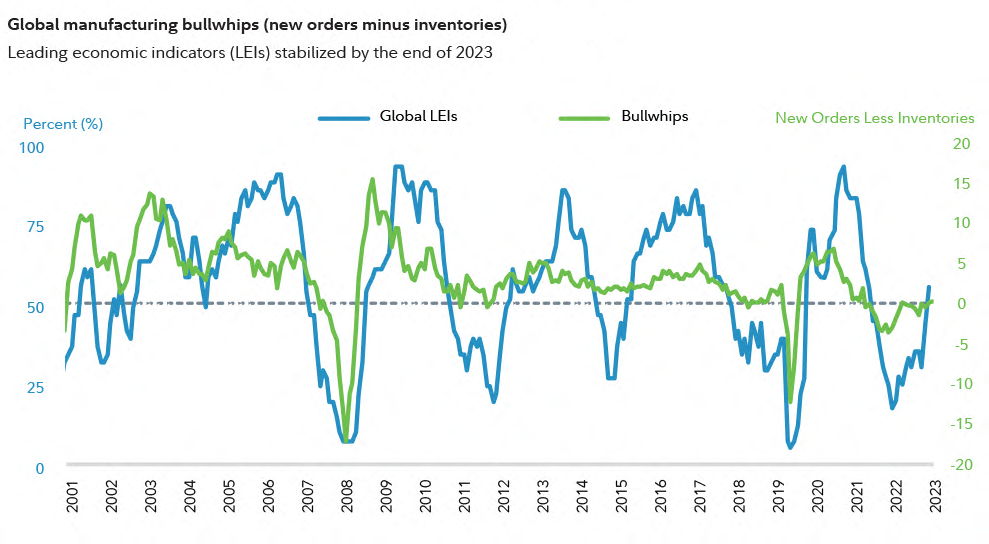
- Globally, our diffusion index of 40 major economies shows the leading economic indicators have improved for about half of the countries over the past 6 months.
- Global manufacturing bullwhips (new orders minus inventories) are now back in positive territory, a constructive leading indicator of industrial activity.
The upshot for investors
Earnings expectations may be too high. Analyst estimates imply a profit rebound of about 11% in 2024, on the heels of a slight contraction in 2023. If businesses have less pricing power and slower top-line sales than when inflation was running hotter, they'll probably need to increase profit margins to meet the market's growth expectations. If those margins deteriorate, we'd be more concerned about demand for workers and knock-on effects to consumer spending, as well as rising recessionary risks.
4. Productivity could keep rising. And if it doesn't in the near term, beneficial capex trends could still help.
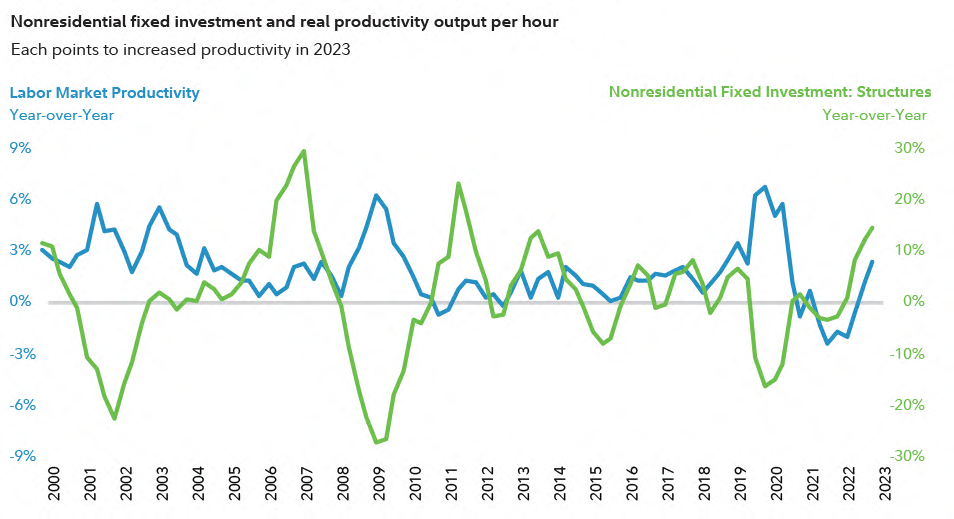
Rising productivity—producing more output per worker—tends to provide a magical elixir that can boost economies and asset prices. We think productivity may have bottomed following a multiyear slump, although whether the recent upturn strengthens meaningfully in 2024 is less clear.
The latest economic data near the end of 2023 reflected a productivity recovery for the first time since the pandemic, with real output per hour in all nonfarm business sectors rising (per the blue scale in the chart below).
Meanwhile, we believe that after more than a decade of enjoying high profit margins from harvesting low labor and interest-rate costs, corporations are starting to boost their capital expenditures, which fund domestic manufacturing, infrastructure projects, and artificial intelligence initiatives. For example, private fixed investment in new structures, such as reshoring by building new factories, rose in 2023 at its fastest pace in more than a decade (per the green scale in the chart below).
The upshot for investors
Further productivity gains—manifested by moderating labor costs amid solid production—could greatly enhance the prospects for the economy and earnings growth in 2024. There is typically a lag between new investments and their conversion into higher productivity rates. We feel more confident in a multiyear bottoming of productivity rates, with the sustainability of the near-term productivity rebound less certain. Nevertheless, the recovery in business investment is likely tied to the long-term trend, which may provide some late-cycle ballast to the economy.
5. High-quality US large-cap companies may still be the strongest in the world. But they might finish lower on the asset-returns leaderboard because their relative valuations imply this is no surprise.
The largest US stocks—dominated by technology and communications giants—topped the global asset performance leaderboard in 2023.
We're not expecting the same level of outperformance in 2024, although there are solid fundamental reasons that large, high-quality companies have fared better in this higher interest-rate environment.
- The business sector has proven more resilient to higher interest rates than many investors expected, and large corporations—particularly ones with strong operating cash flows—are at the center of this phenomenon.
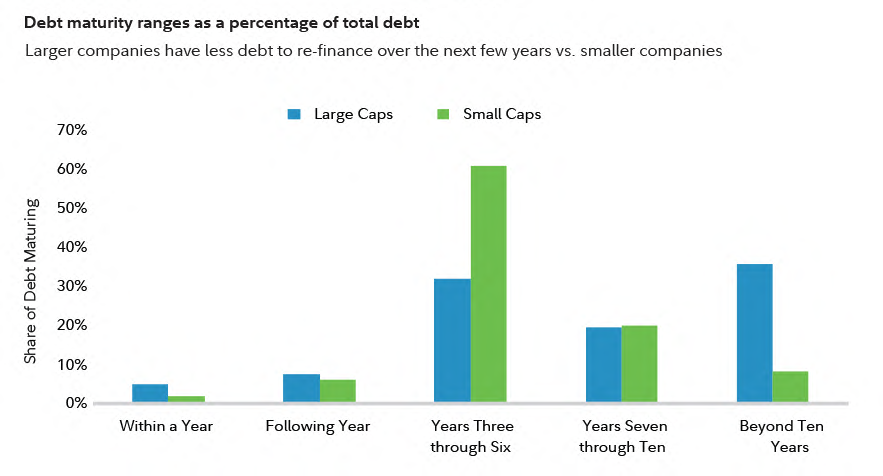
- Large companies were able to "term out" their debt more effectively when interest rates hit record lows in 2021. Roughly 90% of large-cap debt is fixed rate, and more than half of it matures beyond 2029.
- Meanwhile, the average interest rate on small-company debt has doubled from its low in 2021, and more of the debt faces maturities beginning in 2025.
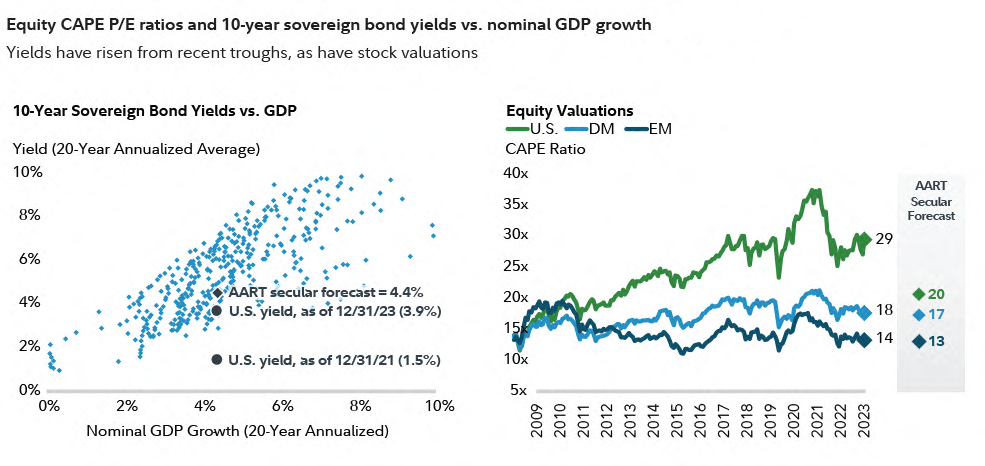
- Market valuations already reflect a healthy amount of optimism about the prospects for high-quality US large-cap companies. After de-rating in 2022, the valuations of US equities climbed during 2023 and are now back in the upper range of history both on an absolute basis and compared with non-US stocks.
- Meanwhile, bond yields continued to normalize in 2023 and the valuations of many fixed income assets are around historically average levels. At the end of 2023, the 10-year Treasury yield stood at 3.9%, nearly in line with our long-term forecast of 4.4%.
The upshot for investors
Our analysis suggests most large public companies likely will maintain strong interest coverage and, therefore, be able to navigate through a higher-rate environment.
Yet valuations matter. Outsized stock returns for the largest US corporations in 2023 imply there may be more potential for economic and corporate news in 2024 to surprise positively for other equity categories such as smaller caps or non-US stocks.
With yields at reasonable levels, high-quality bonds could benefit from either the continuation of a solid disinflationary expansion or a pick-up in recession risk.
Copyright © Fidelity Investments


