by Patrick O'Connell, CFA, Director—Fixed Income Responsible Investing Research, John Huang, CFA, Director—Fixed Income Responsible Investing, Data and Technology, Larry Bellinger, CFA, Director—Municipal Credit Research, Sam Wilamowsky, CFA, Research Analyst—Securitized Assets, AllianceBernstein
Investors need to understand the potential physical damage from natural hazards before they can assess their financial implications.
From hurricanes to earthquakes to droughts, natural disasters are becoming more numerous, extreme and costly. To assess the potential financial damage, investors must better understand physical risks at the local level. That’s the goal of a collaboration between AB and the Columbia Climate School.
Understanding Physical Risks from Natural Hazards
In 2016, the Columbia Climate School’s National Center for Disaster Preparedness created a Natural Hazards Index, a wide-ranging assessment of natural hazard exposures across US states and counties. The intent was to help US households, communities, and public health and emergency management practitioners prepare against natural disasters.
AB subsequently worked with Columbia on an upgraded 2.0 version, released in early 2023, that can generate a detailed interactive map showing natural hazard exposures across the US (Display). It can drill down to any of the 73,057 underlying census tracts that comprise the 3,143 US counties.
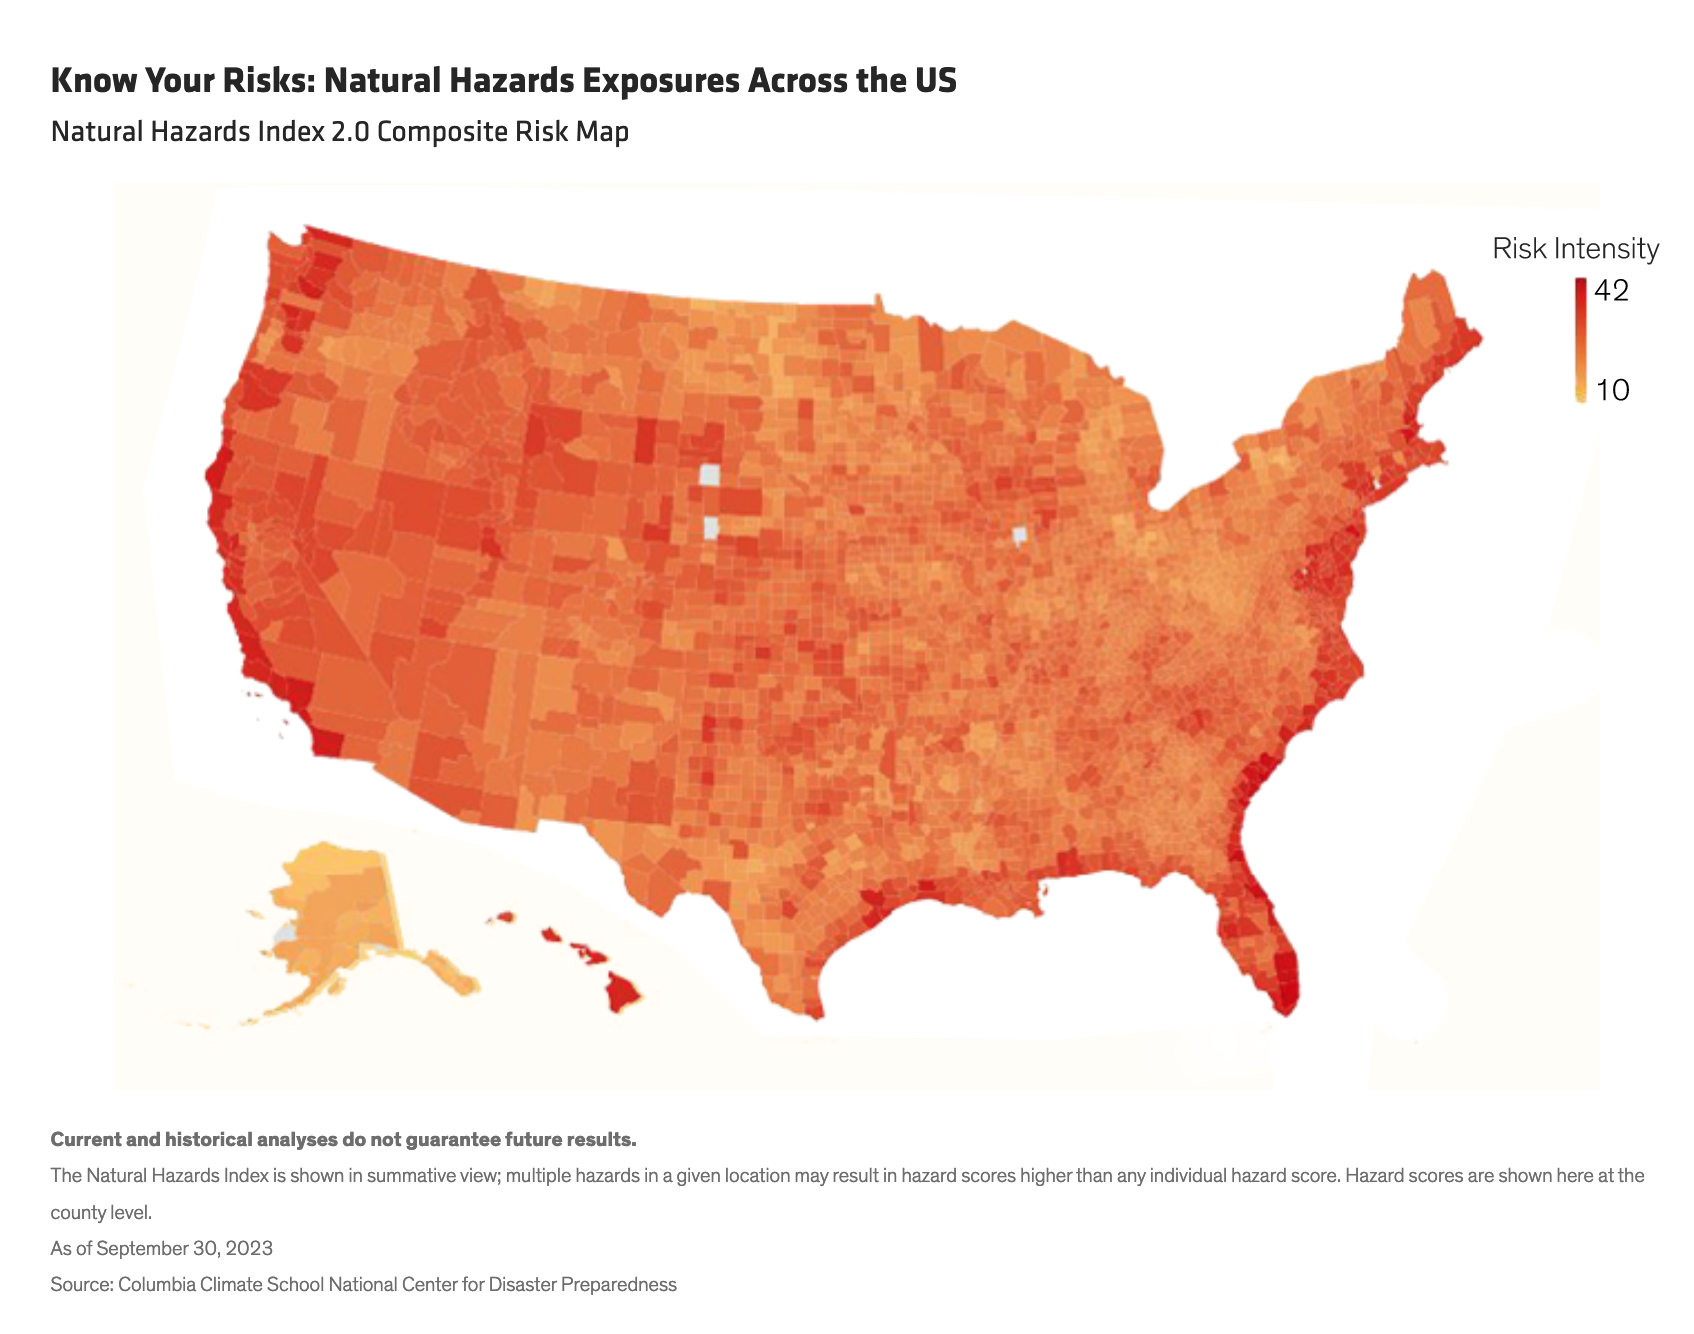
The Natural Hazards Index captures the frequency and magnitude of 14 different natural hazards, including coastal flood, damaging wind, drought, earthquake, extreme heat, floods, hail, hurricanes, landslides, tornado, tsunami, volcano, wildfire and winter storms.
It draws on a vast range of data from four different categories: historical data, based on prior events; probabilistic or predictive data, providing some percentage likelihood of an outcome; deterministic data, pointing to an expected outcome given a set of conditions; and a model data set, which uses multiple explanatory variables to approximate selected outcomes. These data are continuously updated.
The result is a non-ranked, summative index with individual hazard scores from one (very low) to five (very high) and, where multiple hazards exist, summative hazard scores as high as 42. The index has made a significant contribution to understanding evolving physical risks to people and property and has greatly assisted the work of first responders.
But the Natural Hazard Index is not a risk index; it isn’t designed to tell us damage or loss estimates or potential population impact. It does, however, provide a strong foundation for this next step.
Three Factors Can Turn a Hazard into a Disaster
For each hazard, investors must consider three key factors that can mitigate or multiply the damage, turning a hazard into a disaster.
The first is exposure: how close is the locale to the hazard? Is it in a floodplain? Surrounded by forest that is flammable from longer and drier summers? In an area prone to hurricanes? Second comes vulnerability. A hazard may be nearby, but precautions can mitigate its effects. For example, using wind-resistant materials when building can curb storm damage. Last is capacity—the ability to cope with the hazard. When disaster strikes, are residents able to evacuate? Do they have access to a car and a place to go?
Ultimately, natural hazard risk is determined by the intersection of the natural hazard and these risk factors—exposure, vulnerability and capacity.
Understanding the Financial Implications of Physical Hazards
To develop a proxy for these three risk factors, we reviewed 30 years of financial cost data from sources such as the National Oceanic and Atmospheric Administration, the US Geological Survey, the University of Oregon, and other institutions that have compiled data on the costs of cleaning up after and mitigating major perils.
With this vast amount of data as a starting place, we created a quantitative risk tool—the Physical Hazard Investment Risk (PHIR) indicator—that scores US census tracts and counties’ total hazard investment risk, ranked from zero (lowest) through 10 (highest) and visualized in a map (Display) that highlights areas with the most financially material risk exposure.

Putting the Physical Hazard Investment Risk Indicator to Work
Several hazards stand out as more costly than the rest: hurricanes, severe storms, droughts and floods. When a location is exposed to more than one of these and has high vulnerability and low capacity, the effect can be dramatic. The US Gulf Coast, for example, faces a cluster of the most devastating natural hazards—hurricanes, floods and coastal flooding (exacerbated by sea-level rise)—and has limited ability to mitigate them.
By contrast, the US Midwest has low PHIR scores, though there are many exceptions. Because the PHIR tool drills down to census tract level, it can identify pockets of risk that other analytics might miss.
PHIR scores are particularly relevant for investors in residential mortgage-backed securities and US municipal bonds. Homes, schools, hospitals, power plants and airports are all tied to specific locations, and so are exposed to the natural hazards in their locale. The tool can help identify securities where natural hazard risks are potentially mispriced by the market and should be accounted for in bond valuations.
In a world where climate is changing fast and natural hazards are becoming ever more important, both the Natural Hazards Index and the PHIR indicator that builds on it can be invaluable tools for investors, providing a deeper understanding of these material risks.