by Jurrien Timmer, Director of Global Macro for Fidelity Management & Research Company
After a challenging period, stocks may have found their footing.
Key takeaways
- Investors are now expecting the Fed to pivot to cutting rates in 2024—following last week’s soft jobs report and dovish comments from the Fed.
- Those developments have helped stocks to stage an impressive reversal recently—finding their footing after a challenging stretch of declines.
- That said, this continues to be a tale of 2 markets, with mega-cap stocks showing much more bullish performance than the rest of the market.
November is here, so let’s fall back and reflect on how the leaves are falling on this most unusual market cycle.
The latest on the Fed
The Fed met last week, and as expected, decided to leave rates on hold. For more than a year, the Fed was operating in a “data-independent” mode, in that it needed to raise rates almost no matter what else was happening—because rates were too low given the inflation backdrop. But the Fed is now in a “data-dependent” mode. This means it wants to wait to see how much impact its actions to date will have on the economy and inflation.
Dovish comments from some Fed officials last week—indicating that it’s possible we could be at the end of rate hikes—helped stocks finally find some strength. Then on Friday a soft jobs report came out, with the economy adding fewer jobs than expected and the unemployment rate ticking slightly higher. While those might seem like negative signs for the economy, they’re positive signs that the Fed’s efforts to slow inflation and the economy are working—and hopeful signs, for stocks, that the Fed may indeed be at or close to the end of its hiking campaign.
After last week’s developments, the market is now expecting a larger pivot from the Fed for 2024 and 2025, with the Fed expected to start cutting rates in 2024, and to take them back down below 4% in about a year.
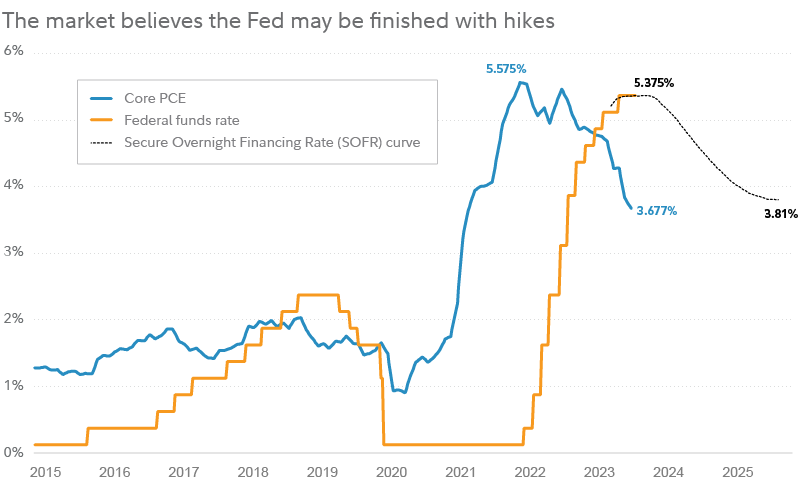
“Core PCE” refers to the Personal Consumption Expenditures Price Index, Excluding Food and Energy, and is a measure of consumer spending on goods and services among households in the US, excluding spending on food and energy, and is based on data taken from various government agencies and private organizations. The Secure Overnight Financing Rate (SOFR) curve shows implied estimates for future interest rates that are embedded into current yield curves. Source: FMRCo., Haver Analytics, Bloomberg.
Have stocks found their footing?
Last week was a welcome reversal for the S&P 500®, which has spent most of the past 3 months giving back a portion of the gains it notched in the first 7 months of the year.
Particularly in the past few weeks, the conversation has been less about the Fed and more about the swift rise in yields in the bond market. While the Fed, of course, sets very short-term rates, it does not set long-term rates, which are instead driven by market forces (though the Fed can influence them). The action lately has been on long-term bond yields, with the 10-year Treasury yield testing the 5% level. (Remember that only 3 years ago it was around 0.5%, so this has been a significant rise.) Long-term interest rates have a direct impact on stock values via discounted-cash-flow models, which use an interest rate to discount future cash flows (or future earnings) to a present value. All else equal, a higher interest rate means a lower present value, which is why the volatility we’ve seen in bonds has also been felt in the stock market.
But then we saw last week’s impressive reversal. At the center of the action, of course, were bond rates. After retesting the 5% mark for a second time, the 10-year yield eased by almost 0.5 percentage points before the week was out. That helped to support a rally for stocks. And it wasn’t just the mega caps, which have led the market by an enormous margin this year, showing strength. The broader market and even small caps staged a reversal—in an impressive show of breadth.
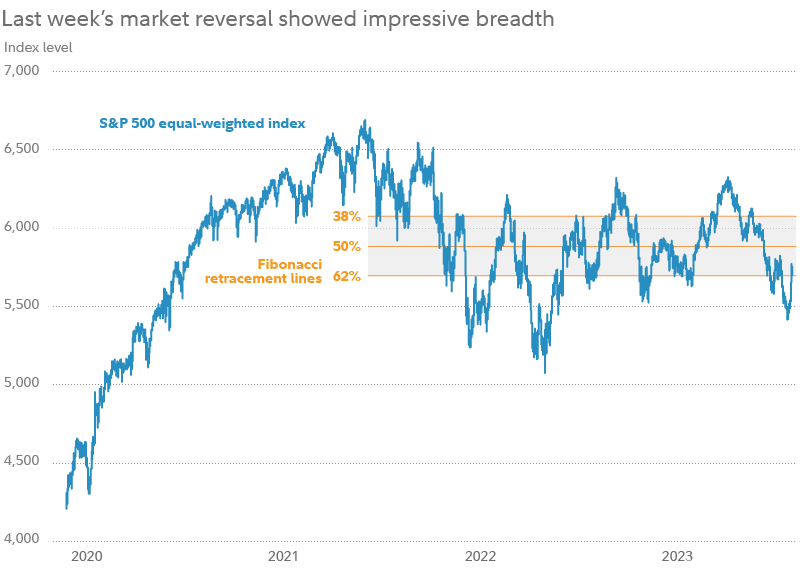
Past performance is no guarantee of future results. S&P 500 Equal Weight Index includes the same constituents as the capitalization-weighted S&P 500, but assigns each company a fixed weight of 0.2% of the index total. Fibonacci retracement lines represent potential support and resistance levels based on the mathematical relationship within the Fibonacci sequence. Percent levels are based on the difference between the market high in January 2022 and the market low in October 2022, with 38% representing a potential resistance level and 62% representing a potential support level. Source: FMRCo., Bloomberg, Haver.
Is this a bull or a bear market?
Many investors may be wondering if we are in a bull market that started a year ago, in a bear market that started almost 2 years ago, or something else.
That question continues to be challenging to answer for the market as a whole, because (as I have written about before) this year has been a tale of 2 markets. Performance of mega-cap stocks—and indexes like the S&P that are heavily influenced by the performance of mega-cap stocks—support the narrative of a bull market. But small-cap stocks and equal-weighted indexes continue to challenge that narrative.
For example, the chart below, which shows the cap-weighted S&P 500, assumes that the cycle bottomed in October 2020. In that context, the recent weakness can be seen as a normal retracement.
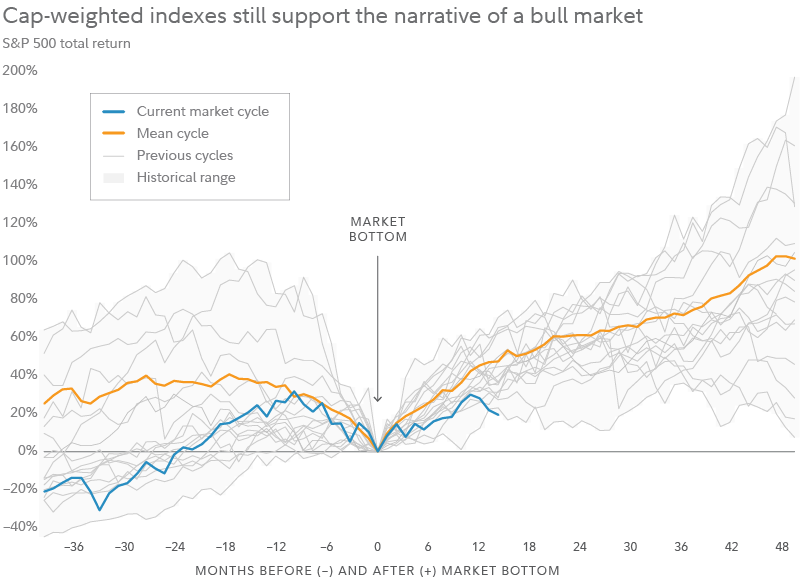
Past performance is no guarantee of future results. Source: FMRCo., Bloomberg.
Below we see the same timeline, but for small caps. This is very much not typical behavior of small caps in a bull market.
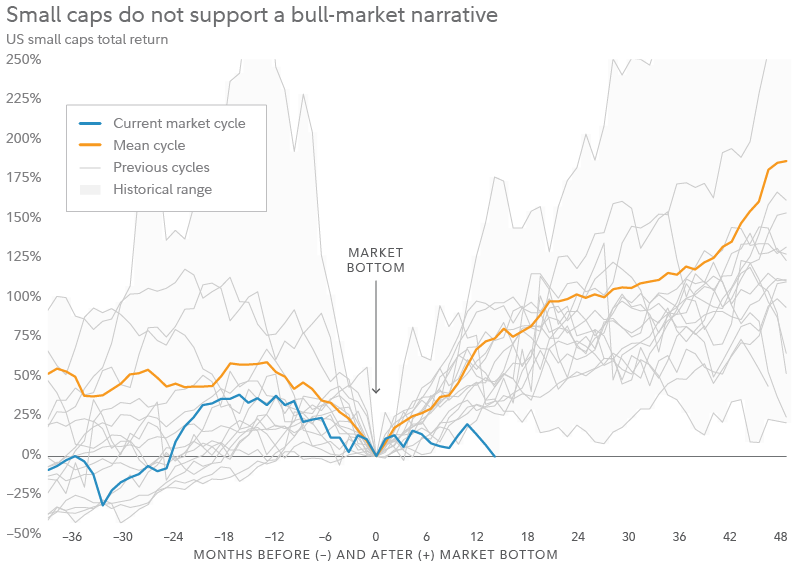
Past performance is no guarantee of future results. Source: FMRCo., Bloomberg.
The above charts leave open the possibility that the recent weakness in the cap-weighted S&P was a normal retracement, while the broader market staged a full retest of the October 2022 lows. That’s just one possible narrative of course, but if the market continues to improve from here, it could well become the dominant one.
Copyright © Fidelity Management & Research Company


