by David Berns, PhD, CIO & Cofounder, Simplify Asset Management
Introduction
The 60/40 portfolio, the bread-and-butter portfolio of today’s wealth management industry, is limited to just two core drivers of returns: equities and bonds. Is there someplace else we can turn to for a compelling yet distinct source of returns? Yes, there are several places to look in fact, one of the most interesting being Equity Market Neutral (EMN) investing. EMN strategies can not only provide a compelling source of return that is distinct from equities and bonds, but they can also offer linear diversification to the 60/40, as well as non-linear diversification in the event of larger equity tail events.
But how exactly does a market neutral strategy generate this type of return profile? In this report, we review the mechanics of market neutral equity investing and demonstrate how these strategies can create this intriguing combo of absolute returns and diversification to the 60/40 portfolio.
The Basics of Equity Market Neutral Investing
To properly construct the expected return profile of equity market neutral strategies, we must first learn the basic mechanics behind these algorithms. These strategies begin by analyzing a large set of factors and identifying a short list of those factors that have predictive value. For example, let’s consider the factor Return on Equity (ROE). ROE is defined as Net Income/Average Shareholders Equity and is a concise measure of how efficiently profits are being generated by a company. ROE is often a good predictor of future returns, as high ROE stocks generally outperform low ROE stocks over longer horizons.
These strategies analyze all factors on multiple lookback periods, from as short as 1 month to as long as 10 years, fully capturing predictive abilities from shorter-term, regime-based dynamics to longer-term, structural characteristics. Once a small set of predictive factors has been selected for inclusion into the model, the system generates 1-month forecasts (for strategies rebalanced monthly) for all stocks in the universe, by combining stock factor exposures with factor forecasts. A portfolio is then constructed that is long those stocks with the highest 1-month expected return and short those stocks with the lowest 1-month expected returns, creating a market neutral portfolio.
The resulting portfolios have a net equity beta near zero but still have non-zero exposures to many of the factors used to make stock predictions. It is these exposures that ultimately generate the full characteristics of the strategy’s return profile. In what follows we show how exposure to different factors can generate absolute returns, linear diversification, and non-linear diversification. There are hundreds of factors that are analyzed in these models, but to illustrate our points we only focus on ROE, which will be sufficient to create the intuition we are looking for.
A Source of Absolute Returns
The first goal of EMN investing is to generate absolute returns and there are two ways these are typically generated. First, there will be net long factor exposures that are strategic in nature, consistently in the portfolio for extended periods. These are factors that have healthy expected returns over longer periods and are teased out from the models trained on longer-term data. Second, there are shorter duration, tactical factor exposures, which come from the training on shorter-term data. You can think of this as an overlay to the more strategic positioning in factor exposures, temporarily departing from the longer-term exposures due to near-term benefits. Let’s give an example of each to help solidify our intuition here.
Strategic Factor Exposures
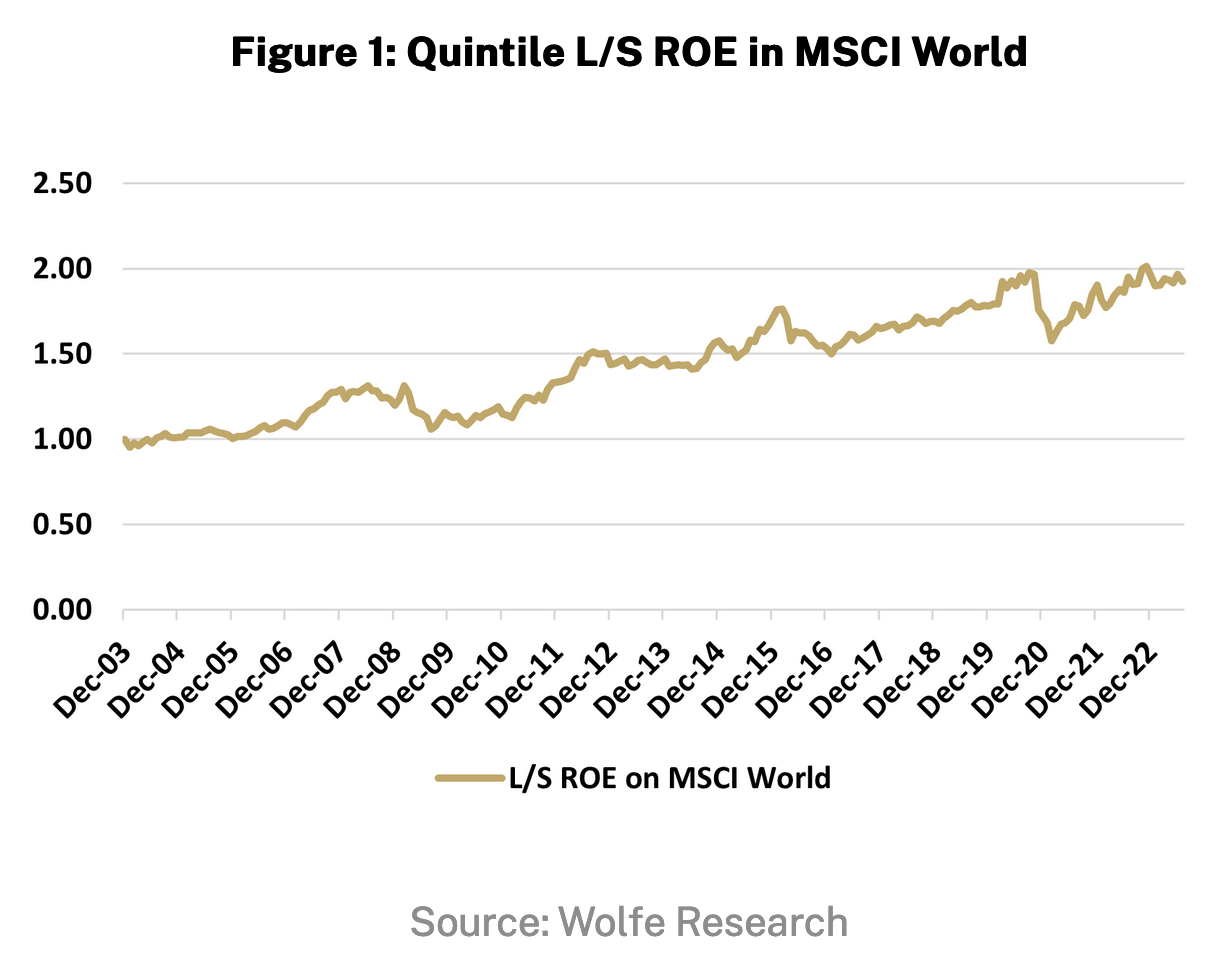
There are many factors that tend to perform well over longer periods. One such factor is the previously mentioned Return on Equity. Figure 1 shows the performance of a portfolio that is long the stocks in the MSCI World with the highest 20% of ROE exposure and short the stocks with the lowest 20% of ROE exposure, denoted for the rest of this paper as “Quintile L/S ROE”. As you can see, a market neutral exposure that is long the highest ROE stocks and short the lowest ROE stocks performs well over extended periods.
Tactical Factor Exposures
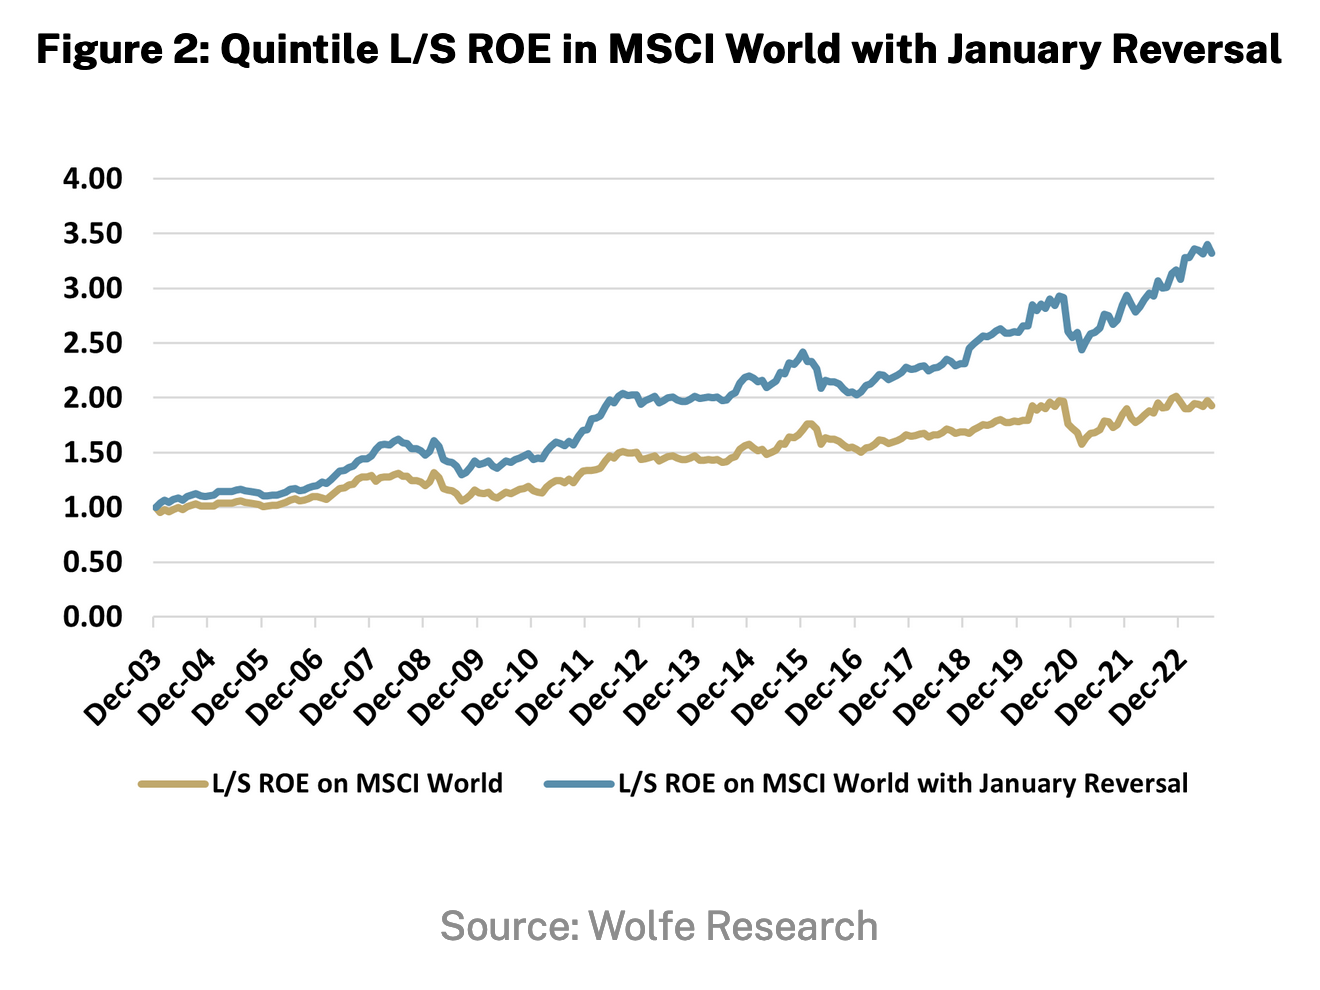
One can improve upon the performance in Figure 1 by being tactical with the exposure, which is accomplished by considering the seasonality (January) effect and combining performance expectations over shorter horizons with the longer-term strategic lens. Figure 2 once again shows the Quintile L/S ROE performance, but it additionally shows the performance where during the month of January we pivot out of ROE and into a reversal factor (long 20% of the stocks that had the worst returns in December and short 20% of the stocks with the best returns in December). You can see the cumulative performance almost double with a similar risk profile.
A Source of Linear Diversification
We’ve just shown how exposure to a factor in an equity market neutral format can provide consistent returns. These strategies also often have a low to negative correlation with the overall equity market, a defining diversification characteristic. While these portfolios have offsetting long and short positions, that create dollar neutrality, they are not necessarily beta neutral. The beta of these funds comes from the summation of the underlying betas of the net factor exposures.
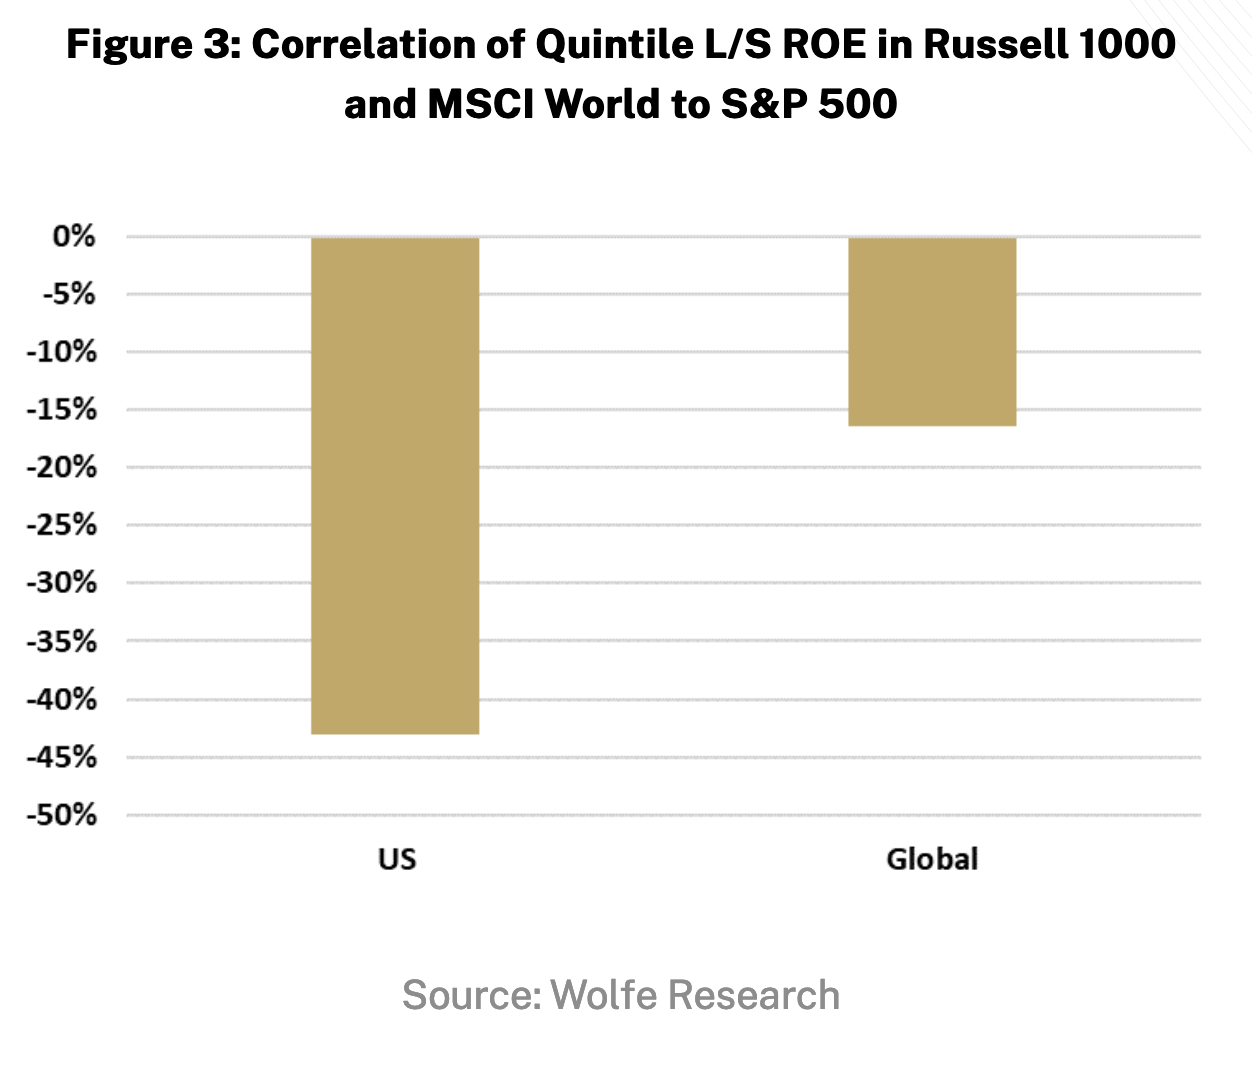
Figure 3 shows the correlation of our Quintile L/S ROE portfolio to the S&P 500, but this time constructing our ROE portfolio from two different stock universes, the Russell 1000 and the MSCI World. As shown, this factor ranges from having slightly negative to highly negative correlations with the broad US equity market, making it not just valuable as a return source, but also as an incredibly compelling diversifier to a broader portfolio. Of course, an equity market neutral strategy will have exposure to many different factors, with varying levels of correlation to equities, but this helps build intuition on how a portfolio of these factor exposures could easily lead to a return profile with negative correlations to one’s broader portfolio.
A Source of Non-Linear Diversification
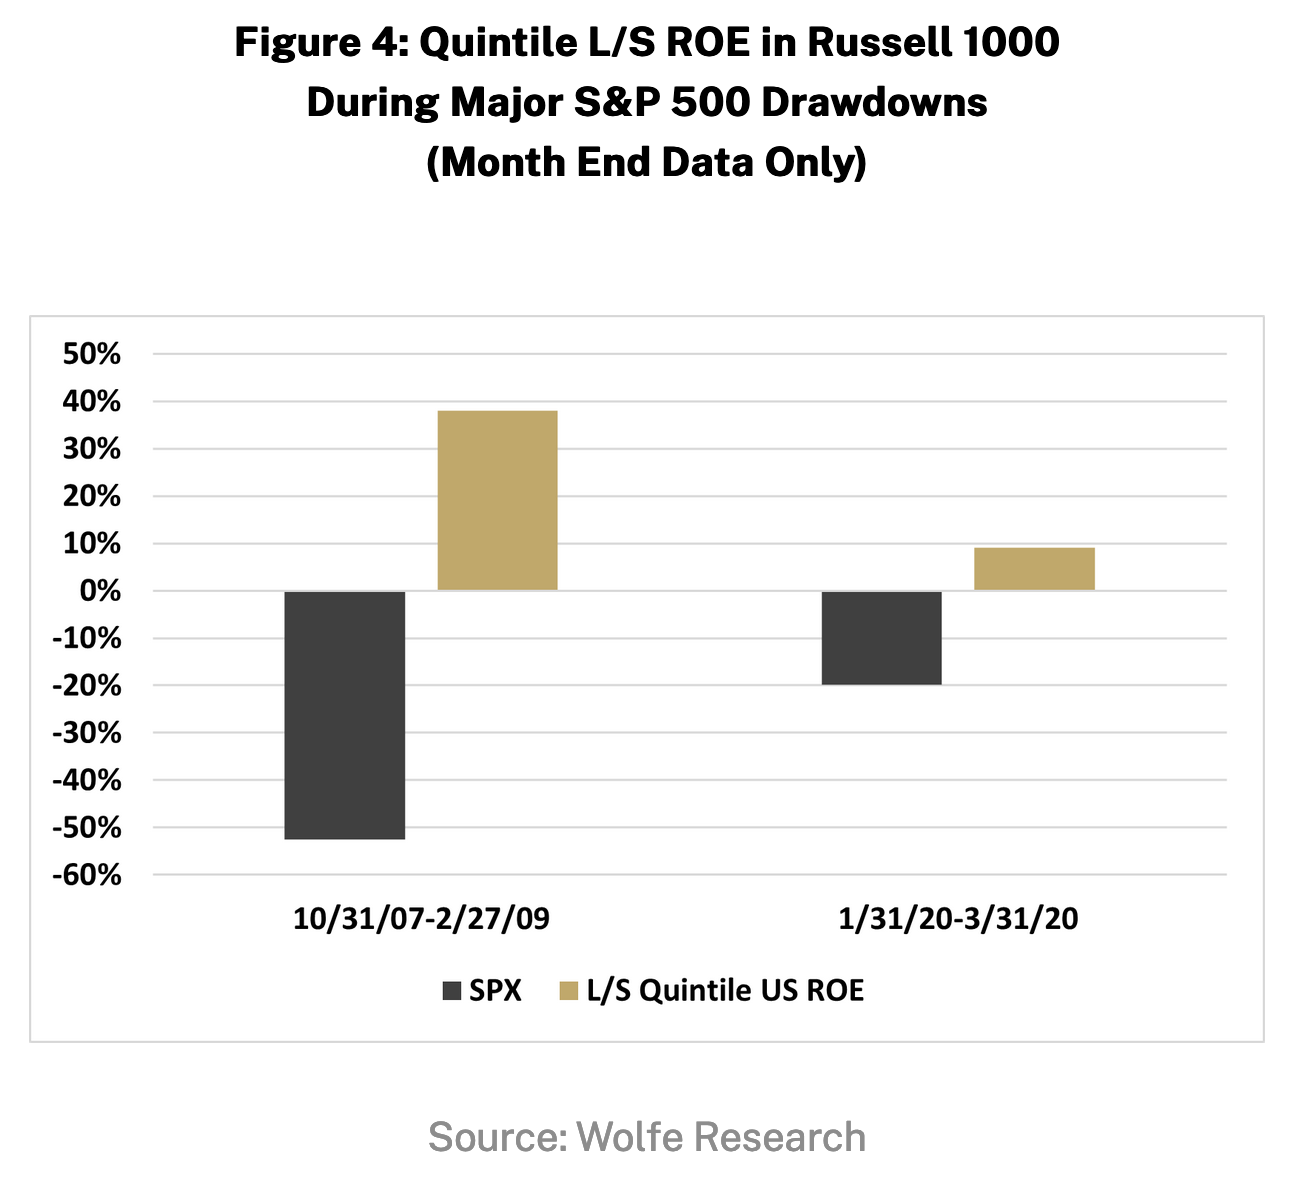
Factors like ROE clearly have a quality/defensive character, so one may naturally ask whether this factor can also display non-linear benefits to a portfolio during significant equity downturns. Figure 4 shows the performance of the Quintile L/S ROE factor built from the Russell 1000 universe during the last two big S&P 500 drawdowns. As shown, market neutral factor constructions like Quintile L/S ROE can exhibit incredibly strong performance, not just flat or down slightly, during big market moves down. It is these kinds of quality/defensive factors that can help add positive convexity to a portfolio through these EMN strategies.
Conclusion
Many investors today are looking for alternative sources of returns given current market conditions in equities and bonds. Once you understand how equity market neutral portfolios are constructed, you can quickly see how these strategies have the potential to be a compelling form of absolute returns, linear diversification to the 60/40 portfolio, and a source of positive convexity during equity drawdowns.
Copyright © Simplify Asset Management


