by Scott Welch, CIMA®, Chief Investment Officer, Model Portfolios, WisdomTree
“Price is what you pay, value is what you get.”
“It is better to buy a wonderful company at a fair price than a fair company at a wonderful price.”
(Investment quotes from legendary investor Warren Buffett, on why his investments focus on both value and quality. His career-long results speak for themselves.)
The current catchphrase in the markets is “The Magnificent Seven,” referring to the seven stocks that have dominated year-to-date (YTD) market performance: Apple, Microsoft, Amazon, Nvidia, Alphabet (Google), Tesla and META Platforms (Facebook).
Other variations of this idea include the so-called “MegaCap-8,” which adds Netflix into the mix as well.
These eight stocks currently constitute almost 28% of the overall S&P 500 Index market capitalization…
The "MegaCap-8" of the S&P 500 Index
…and an overwhelming percentage of the S&P 500’s YTD market performance.
From a valuation perspective, the MegaCap-8 stocks collectively are trading at a frothy 27.4 times 12-month forward earnings—in comparison to a 16.9 times multiple for the remaining 492 stocks in the S&P 500 index.
The MegaCap-8 price-to-earnings (P/E) ratio was even higher prior to the “risk-off” market environment beginning in mid/late July, when rising rates started to bring those stocks back down to earth (a little).
As the late and great economist Herbert Stein said, “If something can’t continue, it won’t.”
As the market adage goes, “What you earn on an investment is a function of how much you pay for it.” Put differently, stocks trading at excessive valuations have, almost definitionally, lower upside potential going forward. (Note: momentum and investor sentiment can continue to drive expensive stocks upward for some time, but there almost always is a reckoning).
With this in mind, let’s look at current valuations across different asset classes and styles.
Here is the valuation of large-cap growth versus large-cap value stocks (using the Russell 1000 Growth index and the Russell 1000 Value index as proxies). We see that value stocks are trading at roughly half the trailing 12-month P/E of growth stocks:
The dispersion is even more dramatic when evaluating the comparative price-to-book (P/B) ratios:
Here is a comparison of the P/E valuations between large-cap and small-cap stocks (using the S&P 500 index and the S&P 600 index as proxies). The dispersion is smaller than that of growth versus value, but small caps are still more attractively priced:
And the gap is even wider on a P/B basis:
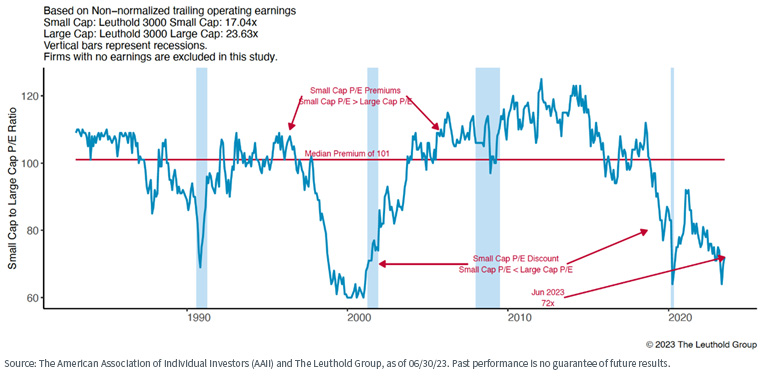
This valuation dispersion can be illustrated differently by examining the ratio of small-cap to large-cap P/E multiples. The discount is as wide as it has been since the tech bubble of the early 2000s (ignoring the anomalous COVID-19 period).
Small Cap to Large Cap Historical P/E Ratio (x100)
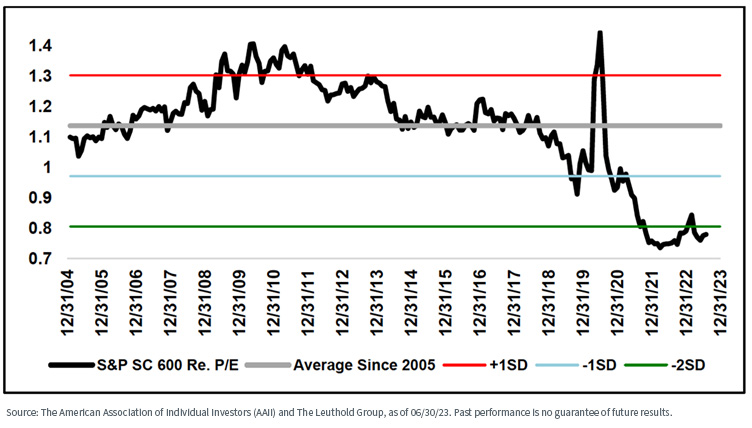
It is not just that small-cap stocks are trading at wide discounts to large-cap stocks—they are also trading at a wide discount relative to their own historical averages. “NTM” refers to estimates of the next twelve months earnings, also expressed as “12-month forward estimates.”
S&P SmallCap 600 Relative NTM P/E Ratio
Finally, let’s look at relative P/E and P/B valuations between the U.S., EAFE (Europe, Australasia and the Far East) and EM (emerging markets) regions (using the S&P 500, the MSCI EAFE Index, and the MSCI EM Index as proxies).
We see that non-U.S. markets remain more attractively priced on a relative basis than the U.S. market.
P/E:
P/B:
Brevity prevents us from doing a comparable deep dive into quality (the second Buffett maxim quoted at the beginning of this post), but we will remind you that our own research suggests that quality is the most consistently performing risk factor, regardless of the underlying market regime.
Conclusions
Markets behave as they choose to, and investors can “fall in love” with stocks for a long time, frequently for non-fundamental reasons (Exhibit A: this year’s dramatic outperformance by the “MegaCap-8” AI-themed stocks).
However, history and Warren Buffett’s long-term track record suggest that, ultimately, fundamentals always matter.
The WisdomTree Model Portfolios have a fundamentally driven tilt toward value, quality, size and dividends relative to broad market cap-weighted benchmarks, which definitionally are overweight in larger-cap and growthier stocks.
Sometimes, when those types of stocks are in a hyperbolic rally (such as much of this year to date), we sail into significant performance headwinds, which we mitigate by being diversified by both asset class and risk factor.
But our long-term investment mandate is to deliver consistent performance over full market cycles, and we remain comfortable with our current portfolio positions. Our historical performance track record suggests we are delivering on our mandate.
Ultimately, valuations DO matter. As the iconic rock band Led Zeppelin sang back in the 1970s, “The Song Remains the Same”.
Copyright © WisdomTree


