
by Dr. Martin Emery, Portfolio Strategist, GMO Systematic Global Macro Team, GMO LLC
We’ve seen a dramatic reduction in the average correlation between equity markets since Covid began. As Exhibit 1 clearly shows, equity market correlations have been dropping rapidly since the Covid crisis. This has direct implications for a long/short portfolio because the correlation between long and short positions are a key component of portfolio risk. For example, a long/short portfolio of stocks that are 100% correlated will perfectly offset each other, rendering the portfolio effectively risk-less. If those stocks were 0% correlated, however, the risk would be weighted between the two volatilities. In short, lowering correlation among equities in a long/short portfolio increases volatility.
EXHIBIT 1: EQUITY CORRELATIONS HAVE DECLINED RAPIDLY SINCE COVID
Average correlation between the equity markets SGM invests in
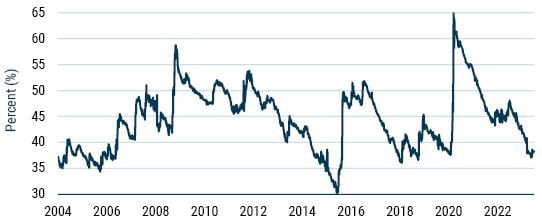
As of June 2023 | Source: GMO
This is an interesting observation that investors should be aware of, as correlations will affect their portfolio volatility. Correlations will also change over time with different market conditions. But this also begs the question as to what might prompt such a change in correlation, and is there a rule of thumb we can apply to help us predict one?
The authors of Forecasting International Equity Correlations (Erb, Harvey, and Viskanta 1 ) consider two drivers of change among equity market correlations, which they then extrapolate to forecast future correlations. Following this example, we revisited some of their observations to run a similar, updated analysis. Rather than follow the authors to the letter and forecast future correlations, however, here we aim to highlight the observations that are particularly relevant today.
Erb, Harvey, and Viskanta’s work cited two drivers of change in correlations: market conditions and business cycles. Using 20 years of daily returns through the end of Q2 2023, we analysed the same G7 markets the authors used, but also added Hong Kong given China’s much more dominant present-day economy.
Correlations Differ in Up and Down Markets
First and foremost, the authors noted that the correlations in up markets are actually much lower than in down markets. To show this, they split the data into pairs and looked at the correlation between those pairs when both markets were up and when both markets were down (we have excluded pairs in which one market was up and the other was down given their resulting negative correlation). Repeating that analysis, we can see that the original observation still holds true today. On average, equity markets are 5% more correlated on down-market days than on up-market days. This is consistent with the decline in correlation that occurred as equity markets recovered from Covid. Indeed, this could partly explain the falling correlations in the first half of 2023, in which there were about 2% more up days than down days in global markets. From this we can infer that in a rising equity market we can expect lower correlations.
EXHIBIT 2: UP VS. DOWN MARKETS
Average correlations between equity markets over 20 years
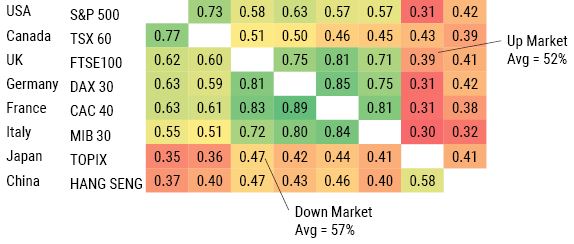
Source: GMO
Correlations Change with Business Cycles
The second observation that the authors made was that correlations also change with differing business cycles. To show this, they again split returns into pairs where both markets were in an upward economic cycle and both markets were in a downward economic cycle. Conducting a similar analysis using each country’s PMI indicator to determine whether its economy was expanding or contracting, we found the results to be quite consistent with those of the up- and down-market regimes. When both economies were expanding, the correlation between markets was substantially lower than when both markets were contracting – by a full 10% on average. For completeness we have added in when economic cycles were mixed, and still the correlation between markets was much lower.
EXHIBIT 3: ECONOMIC EXPANSION VS. CONTRACTION
Average correlations between equity markets over 20 years
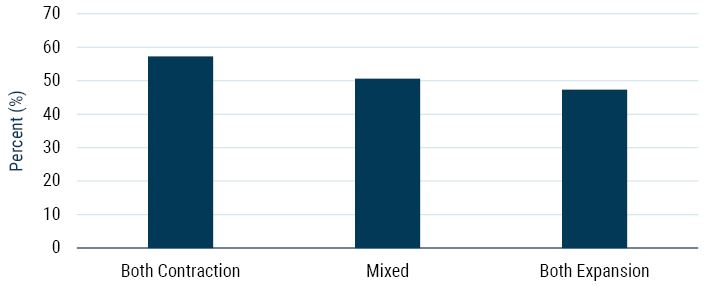
Source: GMO, Factset
Once again, our results are consistent with the findings of Erb, Harvey, and Viskanta from nearly 30 years ago (we tested other cycle indicators during our analysis as well, which produced generally similar results). This gives us a rule of thumb to apply to global equity correlations: as either markets or economic cycles shift from negative, to mixed, to positive sentiment, one can generally expect equity market correlations to decline.
Portfolio Impact
So, what does this mean for portfolios, and particularly for SGM investors? First, while it is interesting to consider why correlations have declined, the relevance today is that correlations have declined, and the decline has been quite substantial. Second, while reducing correlations can mean higher volatility, it can also mean greater opportunity. Why? Because lower correlations may also mean greater breadth – in other words, there are more differentiated return streams to choose from. When all markets are moving in the same direction, it is harder to find profitable differences between returns. As we’ve highlighted previously, we are seeing significant valuation dislocations in equities, with some of the pricing differences at historic highs. We seem to be moving to a regime where markets are not only priced differently, but they are behaving differently as well, with the potential for greater opportunity to trade between them.
Download article here.