


by Jeffrey Rosenberg, Sr. Portfolio Manager, Systematic Fixed Income, BlackRock
Key points
- The new Powell arithmetic: The Fed and the rates market believe that policy is restrictive. But uncertainty remains as the Fed signaled additional hikes and bond markets have priced in a higher probability of additional “insurance” hikes before pivoting to rate cuts later this year.
- Pressing “pause” for long and variable lags: The problem with the view that policy is restrictive is that there’s little evidence of easing in measures of inflation and economic growth. Is this due to the assumed long and variable lags of monetary policy or a potential measurement error?
- Are recession probabilities overstated? Economist forecasts call for a hard landing, but continue to push out the timing of the hard landing in the face of economic strength. Recent market performance indicates that traditional forecast models may be overstating the timing of the arrival of any recession.
The US Federal Reserve (“Fed”) paused rate hikes in June, but signaled it expects to deliver 50 basis points of additional hikes this year. Will that be restrictive enough to achieve their inflation targets? The waiting is the hardest part.
Bond markets continue to expect a pivot to rate cuts by year-end, alongside one of the additional “insurance” rate hikes as the economy remains remarkably resilient. Current measures of inflation (that avoid base effect distortions) have made little progress in moderating. The labor market continues to show resilience in delivering job and wage gains. Relatively stable company profits are sapping the likelihood of broad-based layoffs—the true hallmark of recession and restrictive policy. Economic forecasts continue to predict a hard landing, but market pricing is moving in the opposite direction. In this Summer Outlook, we explore the divergence in recession forecast measures and market pricing—and what it may mean for the economy and portfolios.
The new Powell arithmetic
The Fed paused in interest rate increases at the June meeting and also signaled an additional two 25 basis point hikes by the end of the year. This reflects continued near-term economic strength that appears to have influenced Federal Open Market Committee (“FOMC”) members in adding hikes into 2023, bringing the terminal rate to a range of 5.50-5.75%.
Markets view the Fed only tightening one more time in July and then a faster pace of progress on inflation leading to cuts by the end of the year. The key issue is whether policy is already sufficiently restrictive to bring inflation to target. The Fed looks to add some “insurance” hikes into the 2023 expectations to insure markets don’t overly loosen financial conditions (thereby undoing some of that tightening) in overreacting to the Fed’s slowing of the rate hike pace in June.
Fed Chairman Jerome Powell’s assessment of sufficiently restrictive takes the nominal Fed Funds rate, less a forward expectation for inflation, plus the impact of credit tightening from the banking crisis and the ongoing quantitative tightening to arrive at an effective policy rate that is sufficiently restrictive to bring inflation back down to target “over time” (Figure 1).
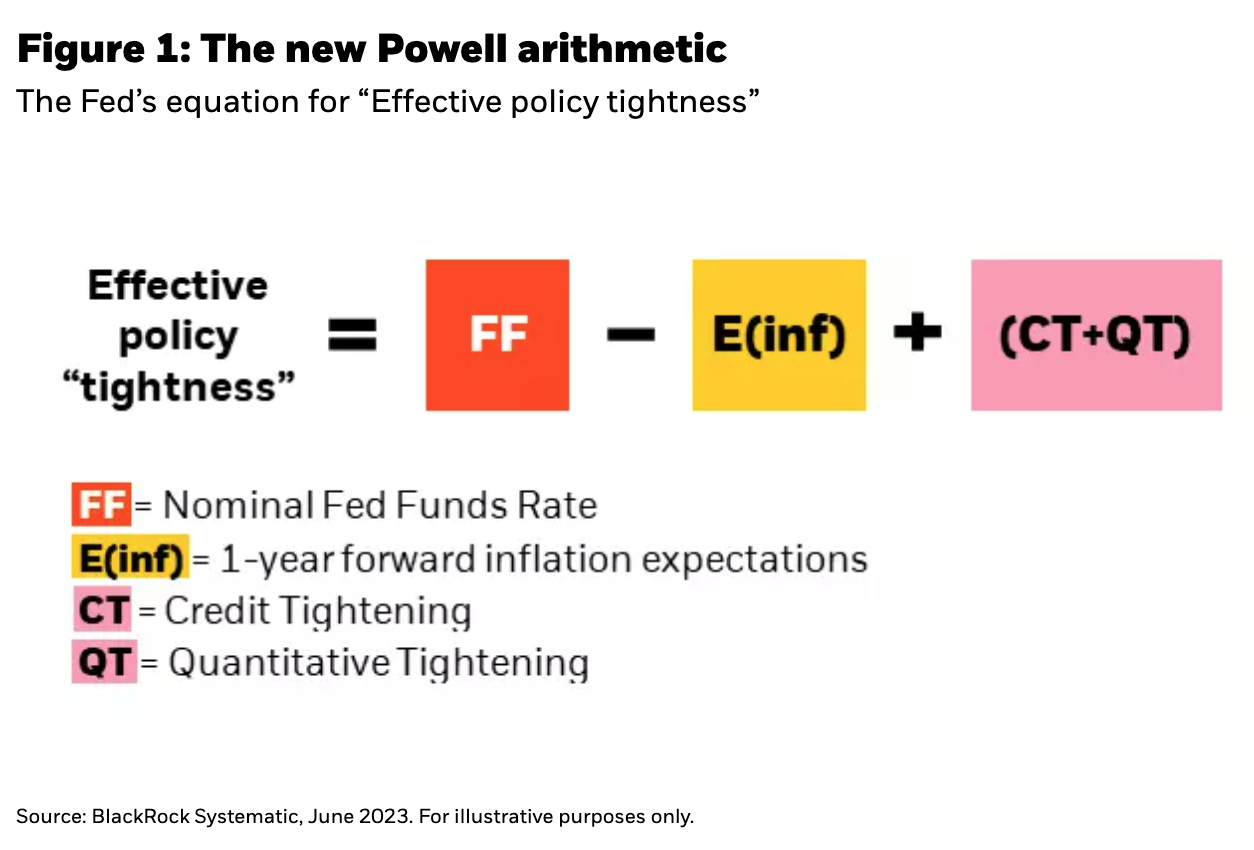
The first two terms (FF and E(inf)) can be quantified. The second two terms (CT and QT) are directionally expected to deliver tighter policy, but the degree of tightening that they provide is highly uncertain and difficult to quantify.
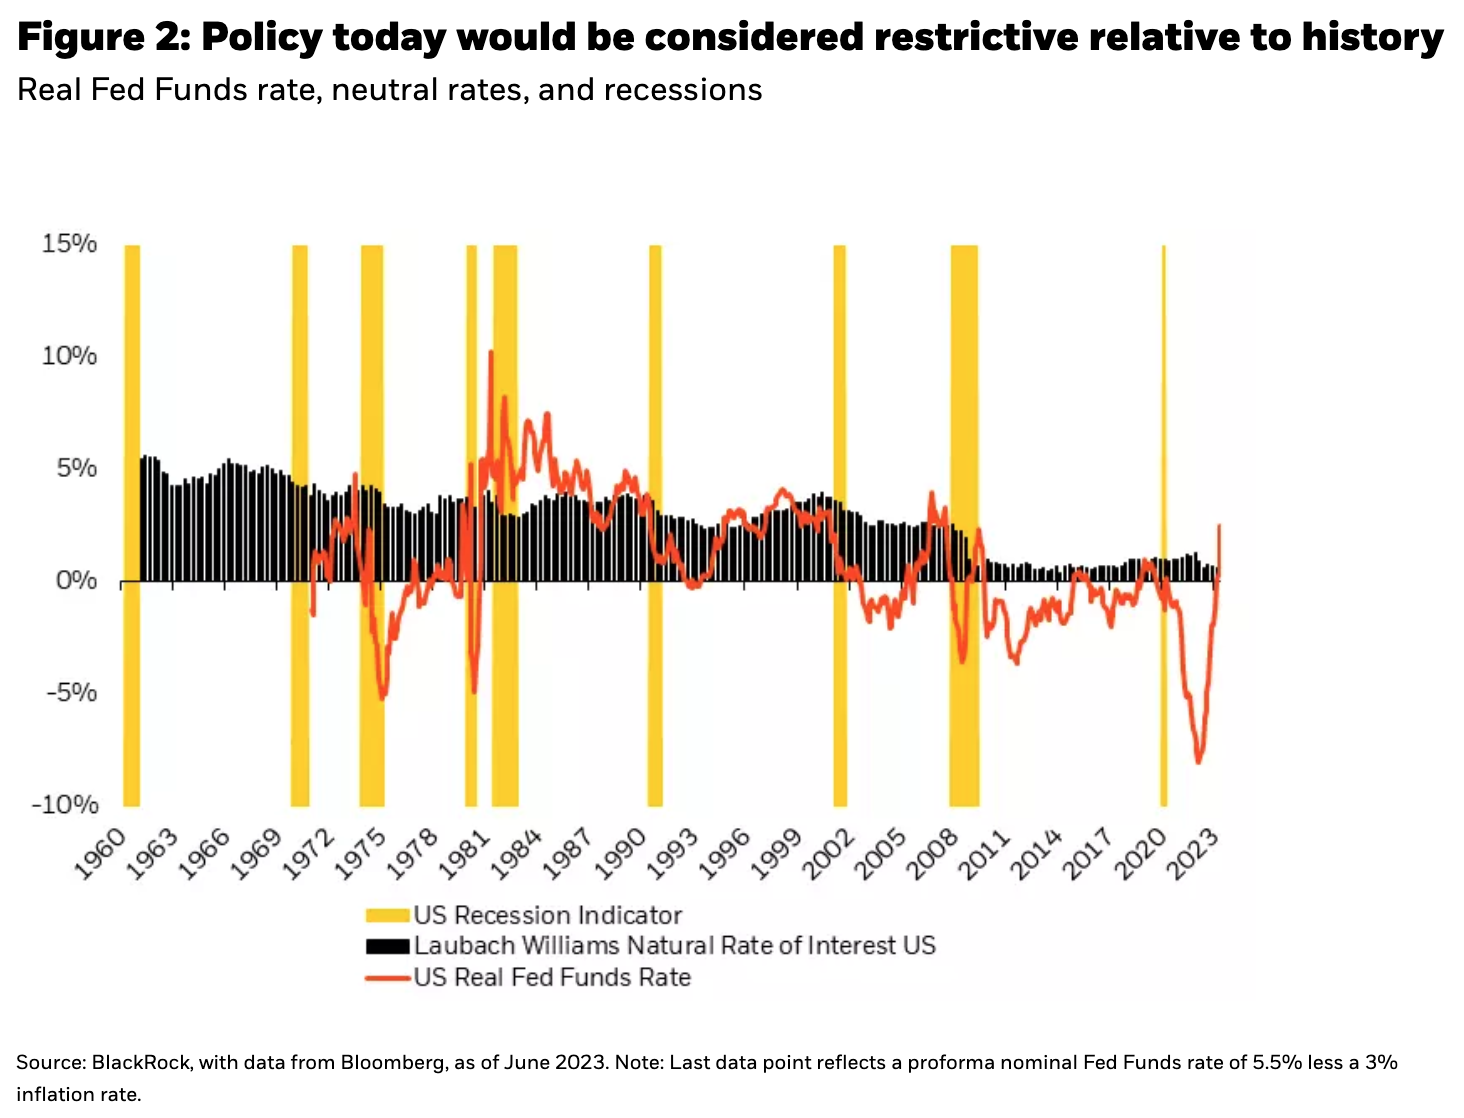
Let’s consider what the quantifiable piece of the equation tells us about the restrictiveness of policy. Based on a 5.5% nominal rate and 3% inflation (the average of 2% market-based forecasts and 4% survey-based forecasts), the real policy rate would be 2.5%. A 2.5% real policy rate would be considered tight relative to history. This is because the degree of policy tightness is equivalent to the degree that real policy rates exceed estimates of real neutral rates. Based on assumptions of both forward inflation and real neutral rates, policy today would be as tight as it was to end the inflationary episode in the late 1970s and early 1980s (Figure 2)—before considering the impact of CT and QT.
It’s important to consider that those are just estimates, and any errors in those estimates can impact the degree of actual policy restrictiveness. Let’s first consider the 3% inflation estimate. That estimate is the average of a 2% 1-year inflation breakeven measure (the market-based measure) and the NY Fed and University of Michigan inflation expectation survey for 1-year forward inflation expectations (4.45% and 4.2%, respectively). If inflation ends up closer to the sticky end of expectations (in line with survey measures), the real Fed funds rate would be over 100 basis points lower (i.e. more accommodative).
Similarly, real neutral rates may be higher than consensus expectations in the post-COVID era—driven by the pandemic shock to long-running trends such as globalization, demographics, technology, and new investment demand from carbon transition and supply chain resilience as well changes to global trade and savings. If this is the case, policy rates would be more accommodative than currently perceived. John Williams cited the original paper on the real neutral rate in his recent speech, underlining that, “estimates of the natural rate of interest, however, are very imprecise and subject to real-time measurement error.” 1 Real-time measurement error was one of the policy errors leading to the Great Inflation of the 1970s.
The risk to the Fed’s pause in rate hikes is the possibility that rather than monetary policy working with long and variable lags, measurement error—both in terms of inflation and real rates—could result in policy being significantly more loose than it is currently thought to be.
Pressing “pause” for long and variable lags
The trouble with the real neutral interest rate is that it can’t be measured. It can only be inferred from the data. If policy rates are tight enough (above the neutral rate), then the economy should slow. Estimating the neutral rate of interest is—in the words of Williams—to “let the data speak.” The difficult part for the Fed, and markets, is that near-term data has been suggesting that despite 500 basis points of interest rate increases, the economy and inflation remains remarkably hesitant to slow.
That could be due to either difficulties in real time measurement or to the “long and variable lags” of monetary policy. A reasonable response is to pause and wait. But that is also the hardest part. Why? Because as they wait, it’s difficult to know whether that is the correct course (to assume long and variable lags) or a policy error that’s resulting from a measurement error. It’s impossible to know in real time and evaluation only becomes clear with hindsight—after you’ve witnessed the evolution in the economy.
Are recession probabilities overstated?
One contributing factor to the Fed’s decision to pause is widespread consensus that the Fed will overtighten and cause the next recession. Consensus forecasts for economic growth cite a near unanimous agreement on a US recession in the next 12 months (Figure 3).

Similarly, model-based recession estimates reflect high recession probabilities that have increased significantly since mid-2022. However, market pricing reflects very different probabilities.
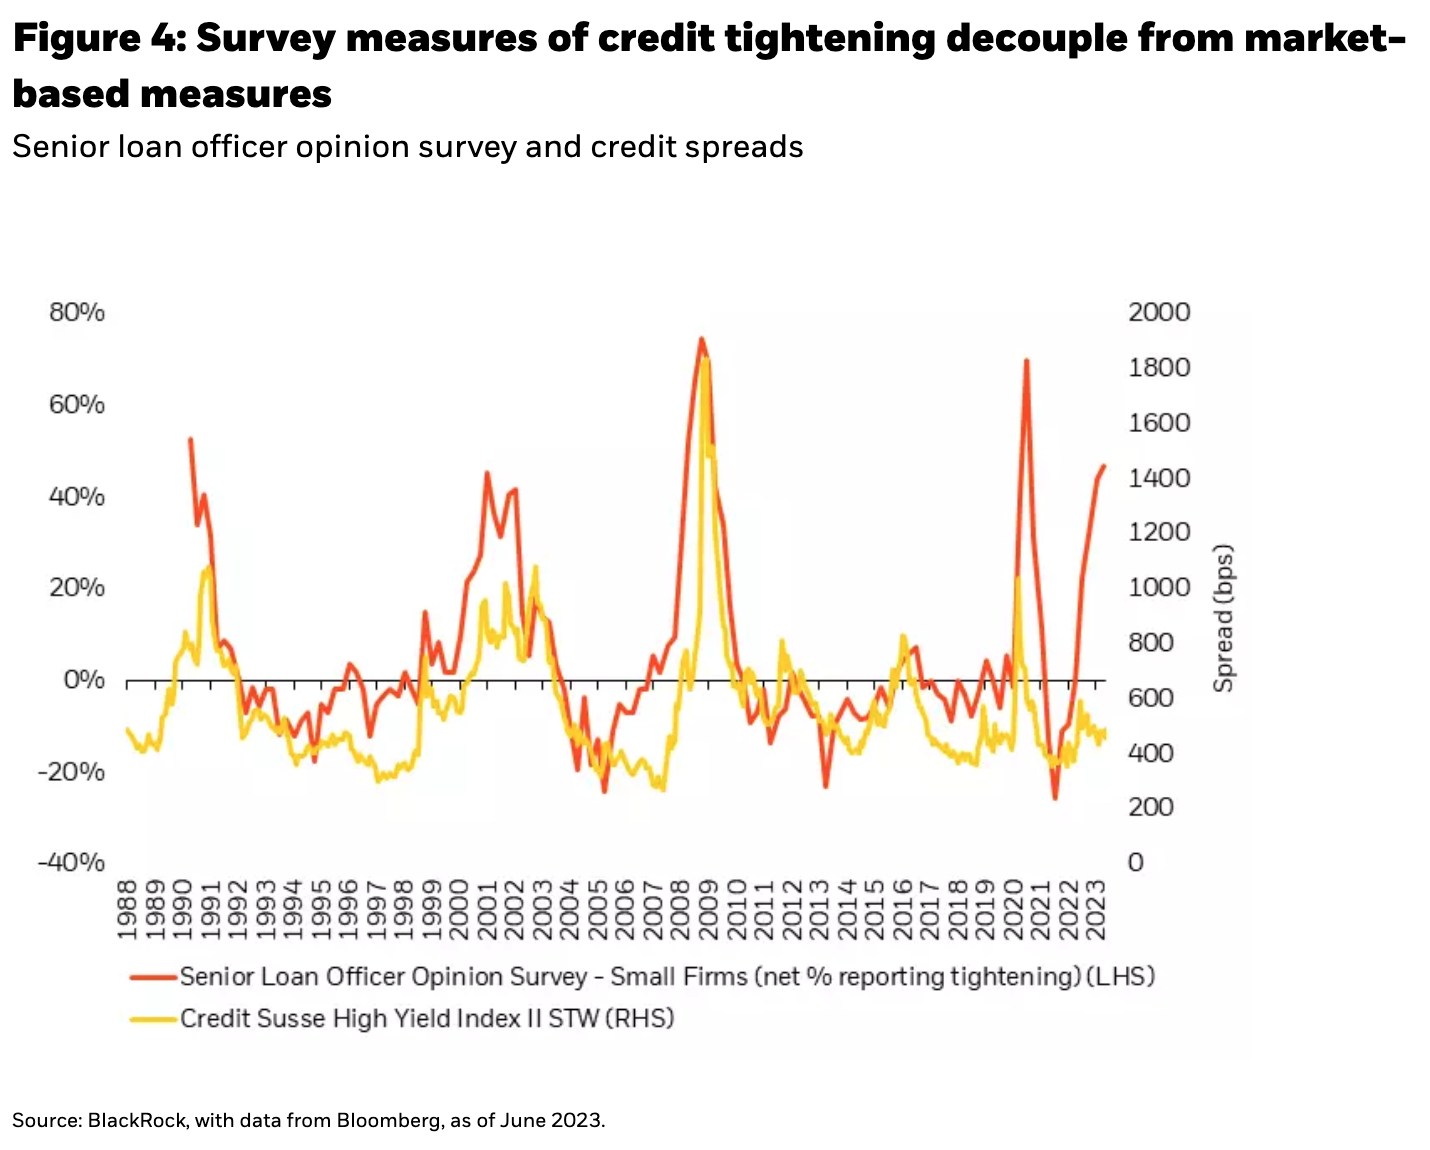
Across a range of asset classes, we see market pricing increasingly suggest more benign economic outcomes. Inflation markets have priced in the “immaculate” disinflation back down to the pre-COVID 2% Fed target. We’ve also been focused on the disconnect between credit markets and consensus forecasts, as credit spreads reflect mid-economic expansion levels (Figure 4). Historically, this level of divergence is usually a precursor to trouble in credit markets. Just like banking stress is expected to result in tighter lending conditions, the significant gap in credit markets and consensus forecasts suggests that a credit crunch (while not here) may be near.
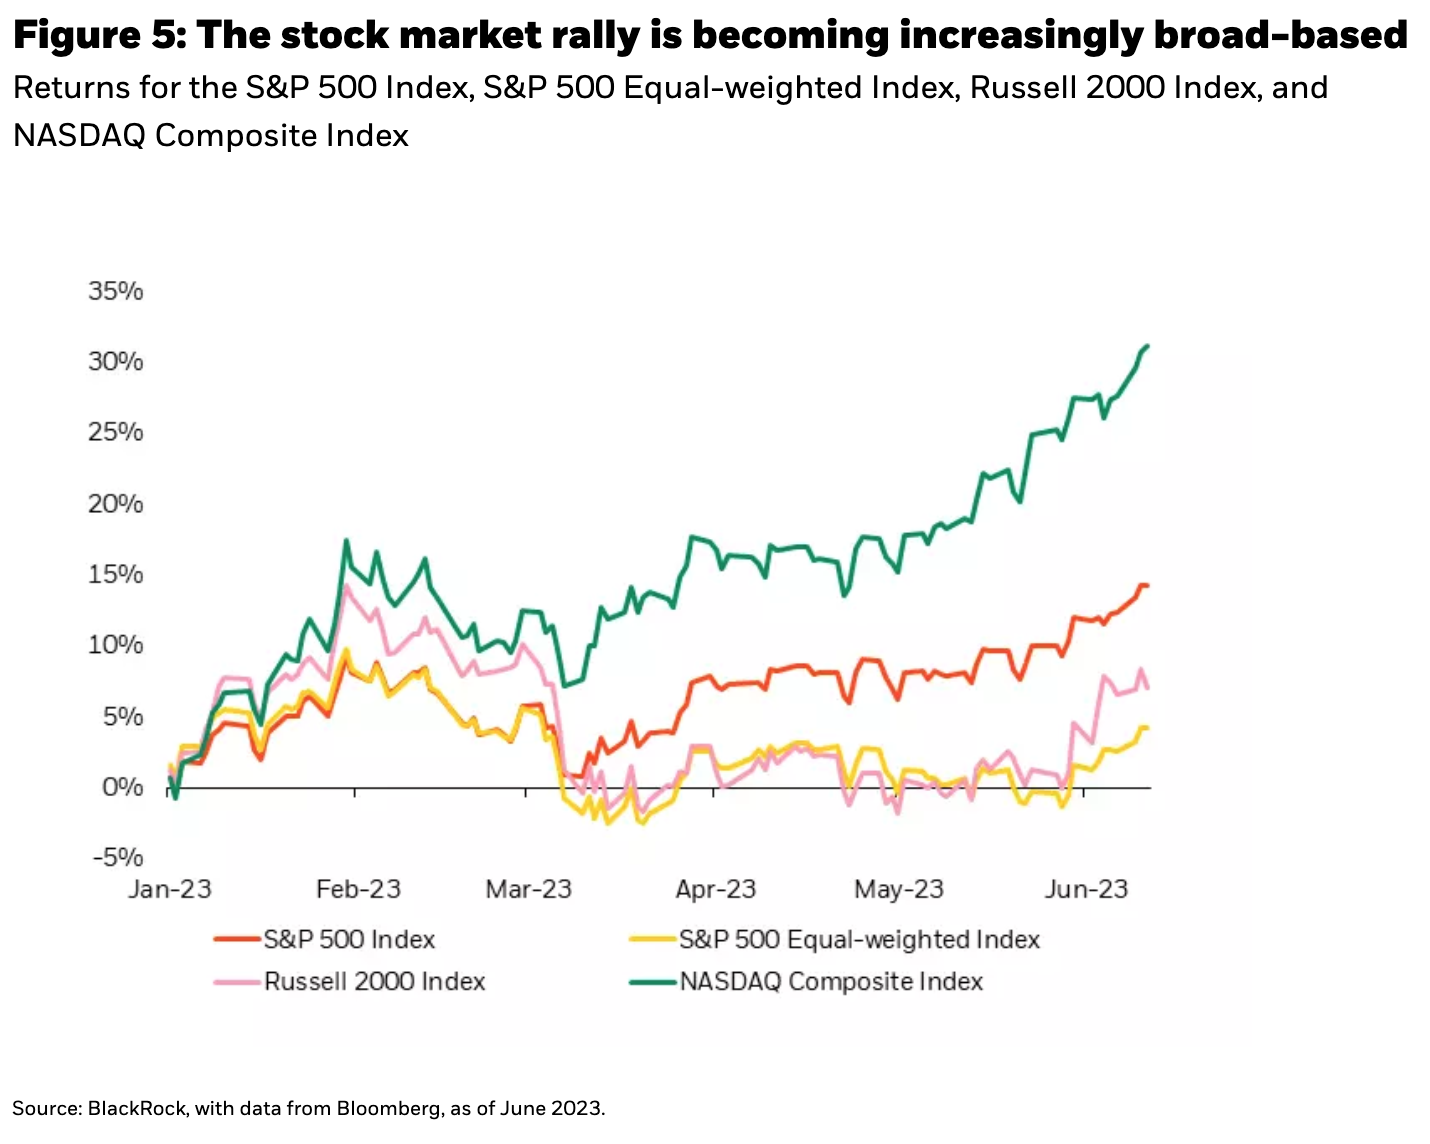
The market metric that tops the list for opposing expectations of a recession is this year’s stock market performance. While this has largely been driven by the positive returns of a handful of large cap technology stocks, even equal-weighted indices and small cap companies have recently started to show positive performance—signaling a broadening stock market rally (Figure 5).
This disconnect may be partly due to the unique features of the post-pandemic economy. As JPMorgan economists recently highlighted, recession probability models suffer from three key vulnerabilities.2 First, they rely on measures of momentum downshifts. This means that the degree of recession risk can be overstated as growth normalizes from outsized pandemic growth rates. Second, recession odds tend to be focused on activity in the goods economy, with a lower weight placed on service sector indicators. The pandemic introduced significant supply side disturbances that impacted the goods-producing economy—causing rapid shifts from bust to boom and back to bust again. Those historically large swings are significantly pushing up recession probabilities. This lower weight on the services sector can be seen most prominently in the disconnect between services and manufacturing Purchasing Managers Indexes (“PMIs”) and the continued strength in job openings, wage gains and low services unemployment. Third, recession forecasts focused on the monetary policy shock expected from the significant tightening, but tended to ignore the positive shock from the fall in food and energy.
Additionally, credit availability surveys may also suffer from pandemic-related distortions. The large COVID swings in credit have surpassed any historical precedent, yet the diffusion-based nature of the surveys may not fully capture this nuance. For example, while there was widespread agreement that bank credit lending standards would tighten following bank failures, the degree of tightening captured in lending surveys was extremely modest. The more significant uptick in credit tightening reflected in surveys actually occurred prior to the banking crisis in March. While this could be related to the lagged effects of bank tightening measures, it may also be due to the limitations of diffusion-based surveys that ask whether lending increased, decreased, or remained unchanged compared to last quarter. In Figure 6, we cross-check these survey-based measures with financial conditions and other measures for a deeper understanding of credit availability.

Figure 6 shows the senior loan officer survey of net tightening conditions for small firms. These surveys ask bank loan officers whether credit conditions have tightened, loosened or remained the same with a zero-reading implying no change. The net percentage tightening as of the second quarter reached 46.7%, a historically high level. The second quarter reading post-banking stress, however, was only marginally tighter than the first quarter reading of 43.8%.
The figure also cross checks these bank surveys of credit lending with small business surveys of credit availability. The National Federation of Independent Business (“NFIB”) asks its members about both availability of loans and expected future credit conditions. Both have been steadily deteriorating since 2022, but the sharp downturn in survey responses in March (likely related to bank failures) was reversed in subsequent months. From the borrowers’ perspective, credit conditions have not materially become tighter relative to the March banking crisis, and expectations only marginally deteriorated.
Finally, the chart highlights the Chicago Fed Adjusted National Financial Conditions Index. This index measures financial conditions “uncorrelated with economic conditions.” The measure was constructed to have an average value of zero and a standard deviation of one. Positive values indicate tighter financial conditions than average. The latest reading is a minus .268. That means financial conditions are looser than average. Although the Fed has tightened monetary policy aggressively, the tightening cycle follows a period of extreme levels of accommodation in response to the pandemic. Even after over 500 basis points of interest increases and some quantitative tightening, financial conditions by this measure are barely even back to average. However, since the more recent readings on this measure have averaged below zero, this measure shows financial conditions at or slightly above (tighter) than this more recent average.
For financial conditions, as we also observed earlier in recession forecasting, the extreme pandemic response has made many normal measures of forecasting become less comparable to past cycles. So while financial conditions are tightening, assessing the degree of tightness relative to past cycles is obscured by the magnitude of pandemic-era accommodation. Relative to other measures of credit availability and expectations, the senior loan officer survey (so far) appears to be the outlier in indicating extreme measures of credit tightness associated with a recession, while the other measures are yet to reflect recession levels of lack of access to credit.
What have markets priced in?
To date, we see varying degrees of impact from the banking crisis and from the Fed’s tightening in terms of real economy pass-through into financial conditions and slowing economic activity. Market prices highlight a mixed picture as well. As mentioned above, stock market performance year-to -date has been largely driven by the resurgence of technology and AI-focused stocks. Yet more recently, we’ve witnessed some broadening of the rally and a notable uptick in small cap stock performance.
Simultaneously, credit markets remain benign. High yield spreads are stuck at mid-expansion levels, having fully reversed the widening induced by the banking crisis. Despite an increase in realized defaults to a two-year high, little has changed in the pricing of distressed credit and the proportion of bonds trading above 1000 basis points remains roughly flat.
Yield curve inversion won’t back down
Of all the market-based measures feeding the recession chorus, the persistence of the inverted yield curve continues to fuel market-based recession forecast models. During May and the beginning of June, the yield curve resumed its inversion. This followed the post-banking crisis steepening when the Fed was briefly expected to pivot to rate cuts and lower rates were led by shorter maturities. The market has since paired back those expectations as discussed previously, with early expectations for rate cuts in July replaced by even odds for another hike—despite continued expectations for cuts by the end of the year.
One of our long-time favorite measures of recession probability which combines market and economic information also increased its implicit forecast probability of a recession. The “aggregate spread” considers both financial market conditions, as measured by the yield curve, and economic conditions, as measured by the spread between inflation (core) and unemployment. When both inflation is high and unemployment is low, the real economy measure is “overheated.” This typically leads to Fed policy intervention and recession. By subtracting this difference (inflation less unemployment) from the slope of the yield curve (using 30-year rates vs. Fed target rates), you arrive at an “aggregate” spread of both real and financial indicators (Figure 7).
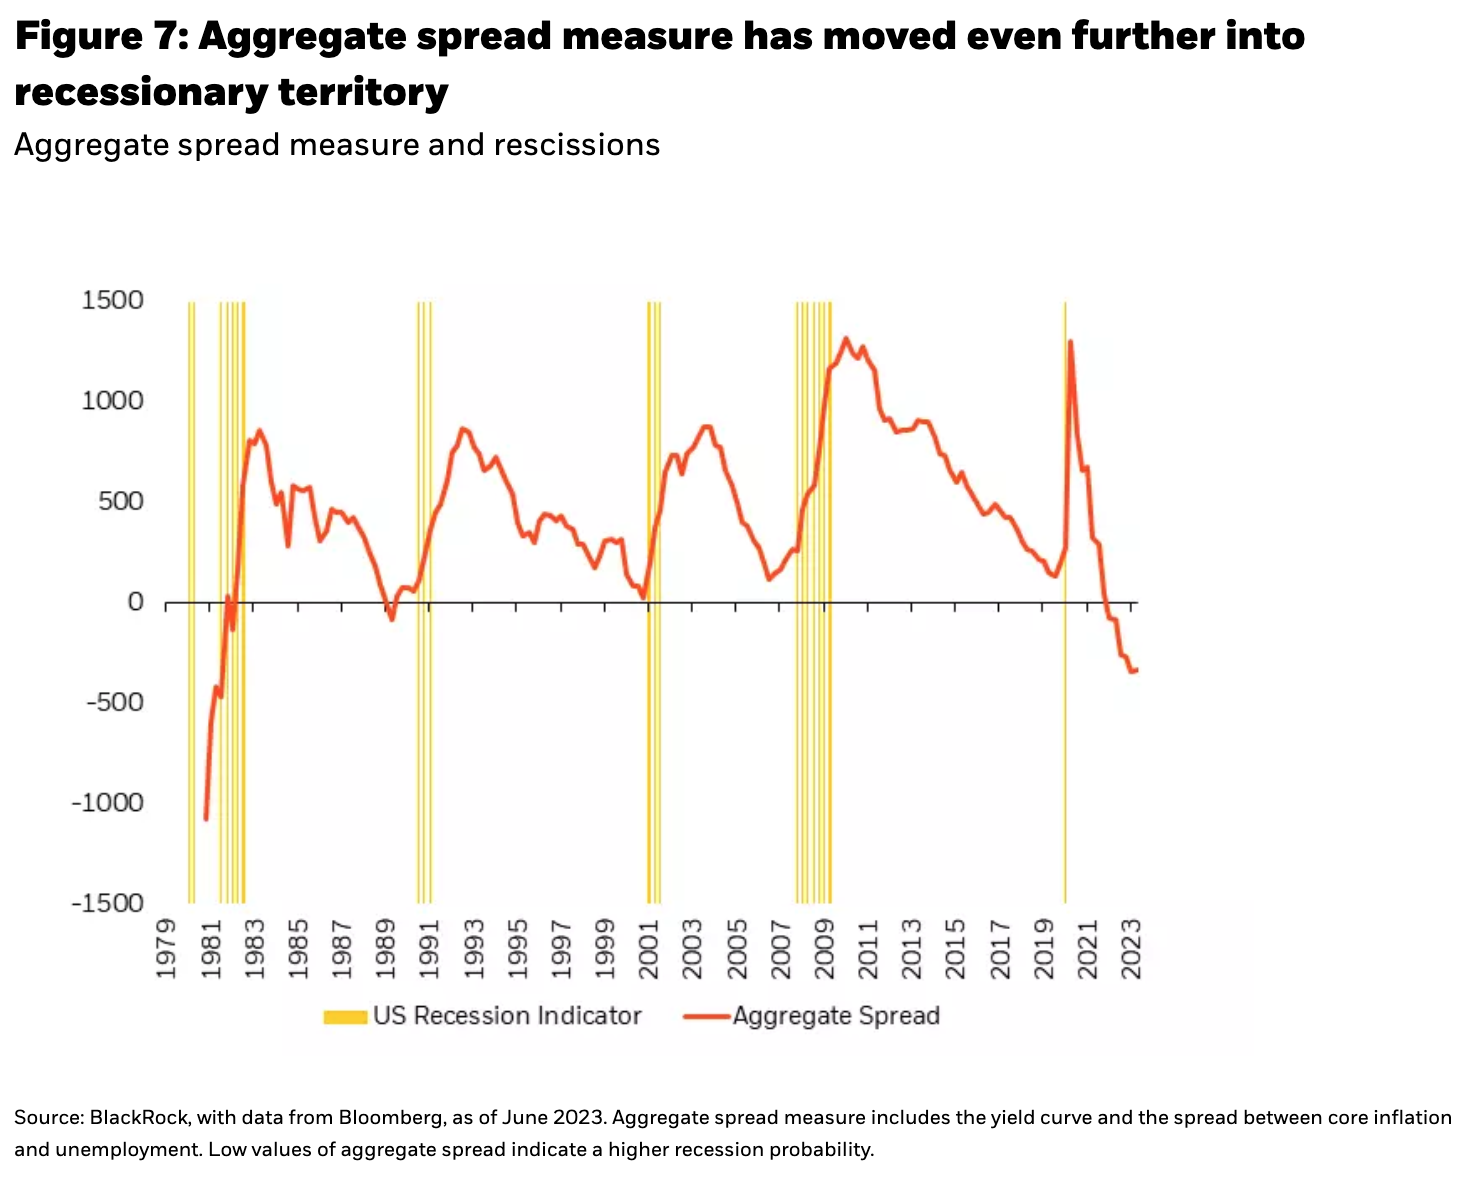
The measure moved even further into recession territory from continued yield curve flattening (further inversion) while the gap between elevated inflation and low unemployment decreased only slightly with mostly unchanged unemployment and very gradual progress moderating core inflation. Though the measure highlights levels far more negative than those associated with past recessions, again the question of pandemic-era distortions remains. Both the “real” side faces distortions due to the inflation shock and tight labor markets, while the financial side reflects the extreme levels of yield curve inversion and the aforementioned bond market expectations for inflation decline and the Fed to pivot to cuts by the end of the year.
Implications for investors
Both market and economic model-based measures of recession probabilities have been and continue to be elevated. That reflects the nature of both the overheated economy and the Fed’s need to reduce activity to bring inflation back down to target likely ending in recession as well as the rapid deceleration from the COVID stimulus peaks in economic activity. Recession timing remains highly uncertain however and the models continue to be early in providing their advanced warnings.
Conclusion
All of the measures mentioned discussed may indeed prove consistent with their past performance. Yet each of these measures—yield curve, the aggregate spread or momentum-based measures for economic recession forecasting—all rely on measures that may or may not be somewhat distorted by pandemic-era policy and economic normalization. One certainty is that neither today, nor in the past, have they provided a clear forecast of the time lag between the onset of such conditions and the realization of recession. Defensive portfolio positioning appears to be the consensus of investors and the prudent course of action. But validation has had to wait—and the longer it takes for expectations to be validated, the more consideration is given to other outcomes and explanations. That makes the waiting the hardest part.
Copyright © BlackRock


