


by John Lynch, Chief Investment Officer, Comerica Wealth Management
Mid-Year Market Outlook
Executive Summary
• Investors have had a lot to contend with thus far in 2023. Moderating economic growth, persistent inflation, volatile interest rates, falling profits, stress in the banking sector, war in Ukraine, and the debt ceiling debate all combined to weigh on sentiment.
• Nonetheless, large cap equities and mega-cap tech names have jumped higher, providing a degree of relief for investors. We remain concerned, though, that these moves are beyond optimism over growth prospects for AI, for example, and instead reflect misguided hopes for a change in the direction of monetary policy. Indeed, under the surface, the equity market looks less healthy than the major indexes suggest.
• After gaining clarity on the debt ceiling, we look for the Federal Reserve to remain steadfast in its policy pursuits, with elevated interest rates and tighter credit standards weighing on economic activity for the remainder of the year. Falling corporate profits historically have led to reductions in employment and capital expenditures, and we see no reason why this experience should prove any different. Therefore, it is conceivable that we will need to retest the October equity market lows before investors reprice a recovery in GDP and corporate profits next year. After a bout of further volatility this summer, we look for the S&P 500® Index to be fairly valued near current levels (4,150-4,200) by year end.
In the meantime, we will continue to emphasize our diversified strategies for long-term portfolios favoring quality in bonds and value for equities.
Policy
Fiscal Policy Risks Temporarily Supplant Monetary Concerns
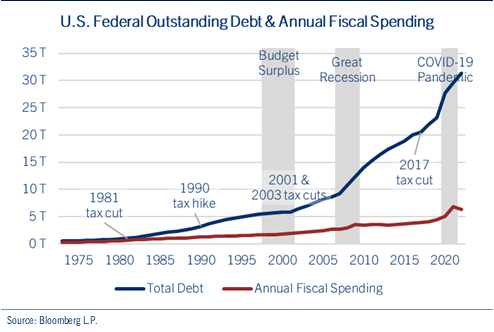
After months of negotiations and accusations, it appears we are finally close to resolution to raise the federal debt ceiling from $31.4 trillion. To be sure, the process has been concerning to the financial markets, as investors attempted to divine the ramifications from a failed negotiation, potentially leading to missed payments for critical programs like Social Security and Medicare, as well as the possibility for an unconscionable federal debt default. The risks to these potential outcomes were severe, ranging from recession to a multi-year global financial crisis. See chart: U.S. Federal Outstanding Debt & Annual Fiscal Spending.
Fortunately, cooler heads prevailed in Washington and the framework for a deal has been reached…although final congressional approval is not guaranteed. As of this writing, the House of Representatives has advanced the bill and we are waiting for Senate approval.
President Biden and House Speaker McCarthy agreed to terms to extend the debt ceiling through January 2025, past the next presidential election. Nonmilitary spending remains essentially flat for the next two years, before a 1.0% increase in fiscal 2025. Adjustments for IRS funding, student loans, and Covid-19 relief funds were addressed, along with the establishment of work requirements for federal aid recipients. The agreement also requires more prompt reviews for the permitting of energy and infrastructure projects.
Nevertheless, the fiscal environment necessitates higher debt service costs going forward, as monetary decisions return to the policy forefront, remaining a key risk for the economy and financial markets.
The Federal Reserve continues to battle persistent inflation while monitoring the extent to which banking stress will translate to decreased lending activity, likely weighing on economic output. At the conclusion of its most recent policy meeting in early May, the Fed raised its target for the Federal Funds rate by an additional 25 basis points, to a range of 5.0% to 5.25%, the highest level in 16 years. Though Fed Chair Jerome Powell noted that monetary policy may be due for a pause, he gave no indication supporting the view that rates would be cut in the second half of the year. See chart: Fed Funds Futures.
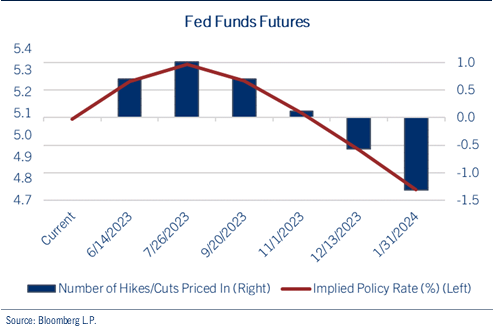
We believe a pause is likely to better gauge the lagged effects from previous rate hikes while assessing the impact of tighter bank lending standards. A sustained policy path, however, is in direct contrast with market expectations, likely setting the stage for further volatility in the months ahead.
Economy
The Elusive Recession Appears Imminent
The U.S. Treasury yield curve has been pointing to recession for the past year. Yet, economic growth continues to confound, with strength in employment and consumption offsetting weakness in manufacturing and housing.
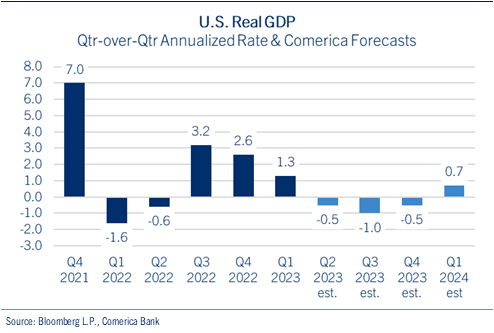
In the first quarter, U.S. real GDP grew at a 1.3% rate as weak inventories added to the case for a recession in manufacturing. Personal spending remained strong, though, backed by solid employment and the mild winter.
Comerica Bank Chief Economist Bill Adams notes that business and consumer surveys have weakened to start the second quarter, though, suggesting economic activity will lose momentum in the months ahead as high prices and tighter credit conditions weigh on activity. Consequently, we look for economic growth to contract through the remainder of 2023. See chart: U.S. Real GDP with Comerica Bank Forecasts.
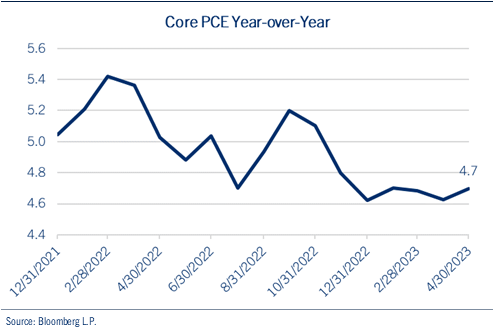
While headline inflation measures have declined from last year’s peak levels, other components suggest pricing pressures remain sticky, likely forcing the Fed to keep rates higher, and for longer, than the consensus currently forecasts. For example, the Fed’s preferred pricing measure, the core Personal Consumption Expenditures (PCE) Index, rose 4.7% on a Year-over-Year (YOY) basis in April, and was up from the prior month’s reading. See chart: Core Personal Consumption Expenditures Index.
In addition to higher than anticipated inflation, employment remains stronger than expected at this point in the economic cycle, further adding to pricing concerns as wages represent approximately 70.0% of total business costs. Employers added 253,000 jobs in April, ahead of expectations and the best gain since January, as the unemployment rate fell to match a 54-year low of 3.4%.
Given these conflicting data points, we look for discourse to increase on the idea of a “rolling recession,” whereby inflation, interest rates, manufacturing, housing, falling profits, and credit tightening ultimately affect employment, consumption, capital expenditures, and services activity, prolonging economic and market anxiety.
Fixed Income
U.S. Treasuries Point to Recession, Corporate Credits Suggest Low Defaults
The government bond market experienced a great deal of volatility thus far in 2023, as yields plunged on banking industry stress before surging again over concerns of inflation and monetary policy. Indeed, the early year gains in the bond market helped offset some of the dismal mindset from 2022, and higher short-term yields have helped provide ballast for diversified portfolios.
Nevertheless, volatility persists in the markets for risk assets, including bonds. The yield on the benchmark 10-year Treasury recently climbed back above 3.75%, a level not seen since prior to the failure of Silicon Valley Bank in early-March. Solid employment and consumption, along with persistent inflation, have many fixed income investors reconsidering the potential for Fed rate cuts later this year.
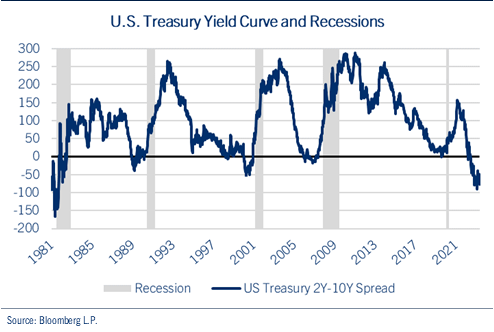
Though market interest rates have remained volatile, the message from the U.S. Treasury yield curve has been consistent. Even though the degree of the inversion has narrowed, this transition should not be misconstrued by investors, as spread consolidation has preceded each of the past five recessions. See chart: U.S. Treasury Yield Curve and Recessions.
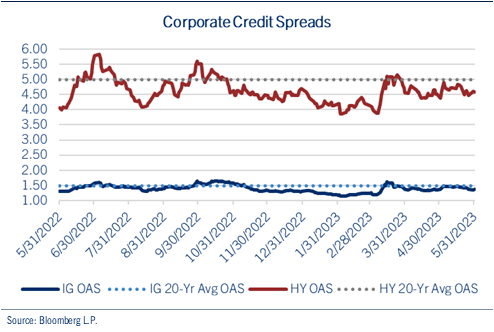
While the yield curve’s message points to recession, we view the signal from corporate bonds as less ominous. The interest rate differentials, or spreads, between the 10-year U.S. Treasury note and investment grade (IG) and high yield (HY) corporate bonds continue to hover within their average width over the past 25 years, a bond market signal indicating the likelihood of a less severe recession, with traders pricing in fewer corporate defaults. See chart: Corporate Credit Spreads.
As the fixed income markets interpret these varying data points, we continue to position portfolios favoring credit quality while keeping duration, or interest rate sensitivity, at or slightly below benchmark.
Equities
The Market Remains Top-Heavy, with the Largest Stocks Driving, and Masking, Performance
While the S&P 500® has enjoyed gains of ~9.0% year-to-date (YTD), the Index has largely traded in a narrow range of 3800-4200. Of course, many challenges weigh on sentiment including inflation, monetary policy, moderating demand, falling profits, war in Ukraine, stress in the banking sector, and the debt ceiling debate.
Technical Analysis
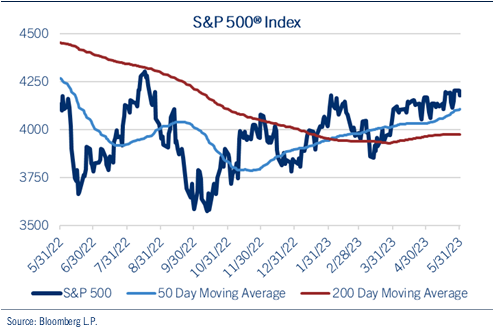
Since rallying impressively off the October lows, the S&P 500® Index has been stuck in a trading range with the upper bound (~4200) providing solid resistance. See chart: S&P 500® Index.
Despite optimism for the successful conclusion of the debt ceiling talks, we remain concerned about several technical patterns suggesting the equity market may struggle in the near-term.
For example, a review of the equity market’s momentum and trend questions the sustainability of any short-term rally. When the S&P 500® last hovered near 4,200 in early February, the percentage of companies trading above their 50-day moving average (DMA) and 200-DMA (~75.0%) were significantly higher than they are currently (~50.0%) for both measures.
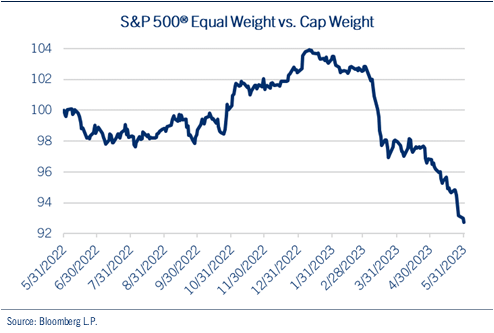
Another mitigating factor is participation, as the “average stock” is underperforming the Index. The relative performance of the S&P 500®’s Equal Weighted Index lags the more popular S&P 500® Cap-Weighted Index by approximately 900 basis points, suggesting weakness under the equity market’s surface. See chart: S&P 500® Equal Weight vs. S&P 500® Cap Weight.
The inconsistent message from the headline S&P 500® YTD return and the performance of the “average stock” can be attributed to the cap-weighted nature of the Index, whereby the largest companies exert the greatest influence on returns.
Fundamental Analysis
Indeed, it is a top-heavy market as mega-cap tech and “tech-like” names are the largest companies in the S&P 500® Index. The two largest companies in Technology, Communication Services, and Consumer Discretionary each comprise approximately 50.0% of the market capitalization of their respective sectors, resulting in extraordinary influence on valuation and returns, essentially masking the weakness in other areas of the market. For example, the average forward price to earnings ratio (P/E) for the largest 6 companies in the S&P 500® is approximately thirty six times next twelve-month (NTM) profits, which is essentially double that of the overall Index.
The equity market is also contending with valuation headwinds relative to higher interest rates and inflation, in which history suggests P/E multiple contraction may result.
In addition, the earnings recession has already begun as profit growth for companies in the S&P 500® Index has declined for two consecutive quarters, with further weakness anticipated in the current quarter before resuming growth by year end. See chart: YOY Change in S&P 500® Quarterly EPS.
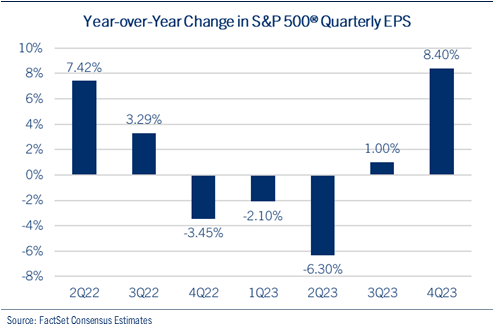
For the full year, we continue to look for essentially flat EPS for the S&P 500®. In our mild recession scenario, the Index would generate profits of ~$220.00 in 2023. Assuming a trailing twelve-month (TTM) P/E ratio of ~19 times, we would view the S&P 500® as fairly valued in the range of 4150-4200 by year end, though not before retesting last October’s market low.
In this environment, we will need to see improved technical and fundamental trends to substantiate further market gains. In the meantime, we are positioning portfolios with an emphasis on value, profitable small caps, and cyclical sectors including Energy, Industrials, and Financial Services, which appear to have priced in looming economic weakness.
Global
China’s Recovery Loses Steam, Weighing on Growth Prospects Around the World
After plunging to their lows last fall, global equities stabilized, and then rallied, on China’s reopening and the potential impact for economic growth. Though post Covid-19 activity in China initially surged, bringing many developing markets along with it, demand has recently sputtered. A variety of economic data points in China, including retail sales, capital investment, and industrial production, have come in below expectations as joblessness also increases, particularly among the nation’s youth.
Consequently, the outlook for the world’s second largest economy remains questionable after last year’s multi-decade low (~5.0%) in output growth. Many developing nations are struggling as a result, given their dependency on trade with China. In addition, a recent firming of the U.S. dollar, due to the combination of tighter U.S. monetary policy and weaker growth in China, may also weigh on capital flows for emerging economies, further pressuring economic activity and market performance.
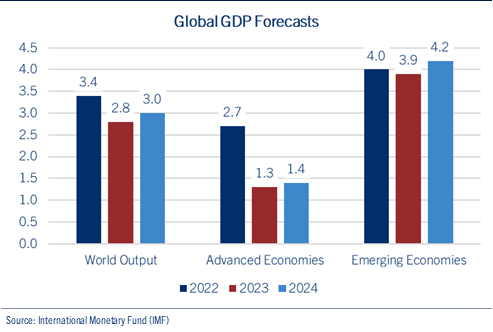
This adds to the uncertainty for global growth, which is already facing headwinds from inflation, interest rates, banking stress, and the war in Ukraine. Indeed, the International Monetary Fund (IMF) recently reduced its outlook for global GDP as interest rates and inflation remain elevated. See chart: Global GDP Forecasts.
In the developed world, monetary policy continues to play an outsized role as the post-pandemic pricing problems persist.
In Europe, Germany recently entered recession and the European Central Bank (ECB) continues its efforts against inflation. While Fed Chairman Jerome Powell signaled the potential for a pause, ECB President Christine Lagarde has forecast additional tightening.
The ECB base rate currently stands at 3.25% with inflation growth projected in excess of 4.5% this year. We view inflation risks as skewed to the upside in Europe due to wage pressures, resilient consumption, and sticky core inflation. Despite economic weakness, it is conceivable the ECB raises rates at least two more times this year, likely bringing the terminal ECB base rate to 3.75%.
In Japan, the central bank is curiously unaffected by inflation measures running at a four-decade high. The Bank of Japan (BOJ) has not yet adjusted their YCC (Yield Curve Control) policy but appears poised to doing so having recently increased their inflation forecasts.
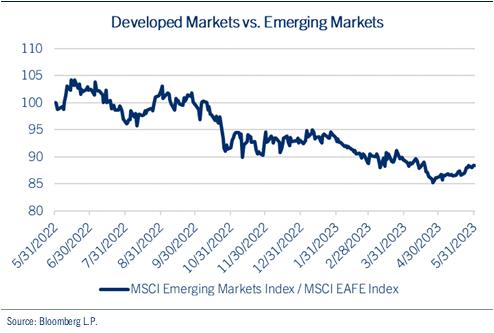
Considering these dynamics, global equity markets rallied to start the year, only to give up gains as the combination of a slowdown in China (resulting in a new bear market for Chinese shares) and persistent inflation in Europe. As a result, Developed Market shares have managed to outperform Emerging Market equities, which have given up most of their YTD gains. See chart: Developed Markets vs. Emerging Markets.
Until we see improved clarity relative to economic growth and currency stability, we will maintain our market neutral exposure to global equities.
Currencies and Commodities
Firming U.S. Dollar Weighs on Commodity Prices.
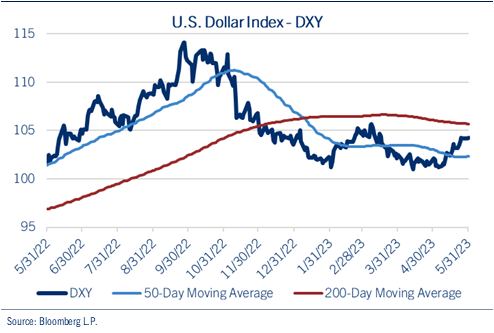
Seemingly just as consensus turned bearish on the dollar, inflation measures persisted higher in the U.S. and economic activity weakened in China, reversing the trade. Indeed, the dollar has stabilized in recent weeks, weighing on global currencies and pressuring commodity prices. See chart: U.S. Dollar Index (DXY).
In addition, despite talk of the U.S. dollar losing its global reserve currency status, the greenback has maintained its impact on global capital flows. The Bank of International Settlements reports that the dollar factored into almost 90.0% of global foreign-exchange transactions last year, consistent with its pace over the past two decades.
With respect to its impact on commodities, which are largely priced in dollars, the stabilization has weighed on prices. Yet, weaker growth in China, for example, has also played a large role, particularly for the weakness in copper prices.
We have previously spoken and written about the fundamental and technical tailwinds supporting gold, as geopolitical tensions boost its support as both a safe-haven and store of value.
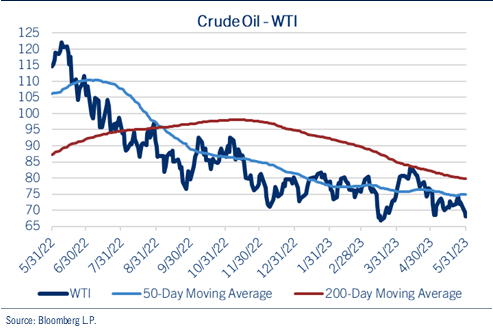
To the extent to which the dollar has weighed on oil prices, however, we attribute the more important driver for weakness in Brent and WTI to global recession fears. See chart: Crude Oil - WTI.
Given our belief that the Fed will remain steadfast in its battle against inflation, we look for the dollar to hover near current levels, boosted by domestic interest rates and overcoming concerns related to the U.S. fiscal position. Commodity prices, therefore, may be less dependent on currencies for the remainder of this year as markets instead focus on the degree of global economic weakness.
Be well and stay safe!