by Ben Inker, GMO
Executive Summary
A core concern for investors contemplating taking advantage of the incredible cheapness of deep value stocks today is the potential for a near-term recession. A common perception is that value stocks are more cyclical and therefore more vulnerable to economic downturn.
We find that this conventional wisdom is false: empirical evidence shows that value stocks actually tend to outperform in recessions. Value stocks have the charm of low expectations. No one is expecting all that much from them, so they have less to lose in an economic environment in which companies of all stripes wind up having a tough time.
Based on current valuations, deep value is priced to significantly outperform the rest of the market. Our analysis suggests that the prospect for deteriorating economic conditions in no way impairs this thesis.
Introduction
Perhaps the most common question we have been getting lately when expressing our enthusiasm for value stocks is “But isn’t value just dialing into recession risk?” Answering this question is a bit complicated by the fact that there is no single agreed upon valuation metric to define value stocks. At GMO, when we build a valuation metric, we first try to remove accounting distortions that make measures such as reported book value and earnings problematic. Our standard “pure” value model, called Composite Value, makes those adjustments but no others. For building strategies such as Equity Dislocation
1
and U.S. and International Opportunistic Value
2
(strategies we have created recently to take advantage of today’s market extremes), we use value models that make further adjustments for company quality and growth.
As a result, we have no single answer to the question, “How does value do in a recession?” But honestly, the nuances of different value models don’t matter much in answering that question, since pretty much every way of defining value has done just fine across most recessions.
3
The only recession in which value models did notably badly across the board was the Covid recession of 2020, and that event was so utterly unique that I’d argue it was a different sort of event entirely.
Certainly, the next recession – whenever it comes and however it transpires – is much more likely to look like one or other of the prior recessions of the past 50 years than the COVID crisis, a rare event that completely shut the economy for on-premises businesses (think value) while simultaneously launching online companies and enablers to the moon (think growth). So I believe it is more instructive to look at the performance of value across the range of recessions we’ve seen over the last half century.
Historical Performance of Value in Recession
Exhibit 1 shows the relative performance of the cheap half of the market in every U.S. recession since 1969 on four different valuation models: price/book, price/earnings, Composite Value, and the blend of value models that we use in our Opportunistic Value strategies.
Exhibit 1: Relative Performance of Value (Cheap Half of U.S. Stock Market) in Recessions
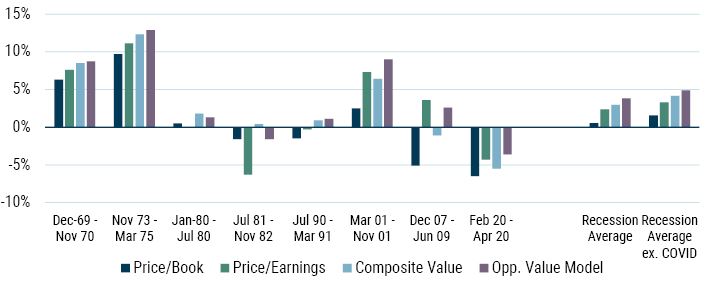
Data from 1969 – 2020 | Source: Compustat, Worldscope, NBER, GMO
Robust Value and Opp. Value Model are GMO proprietary value models.
We would not recommend building value portfolios on the basis of standard price/book or price/earnings ratios. But even if an investor insisted on doing so, on average they'd have done decently well across recessions of the last 55 years. In fact, every version of value besides price/book performed better in an average recession month (even including Covid) than in a non-recession month since the end of 1969!
That analysis is for broad value and today we have been arguing that among U.S. equities it is only deep value stocks that are really interestingly priced. One could imagine that the cheapest tail of the market dials more heavily into recession risk, but that simply isn’t the case, as we can see in Exhibit 2.
Exhibit 2: Relative Performance of Cheapest 20% of U.S. Stock Market in Recessions
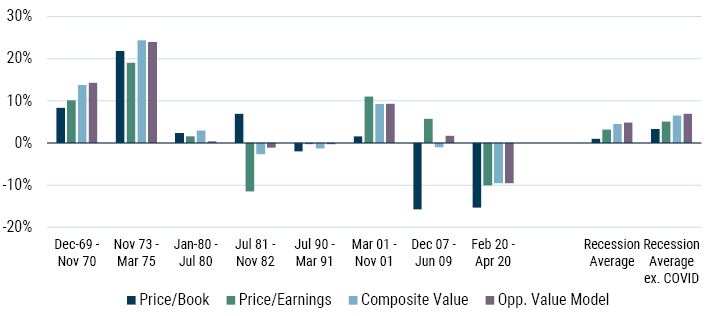
Data from 1969 – 2020 | Source: Compustat, Worldscope, NBER, GMO
Robust Value and Opp. Value Model are GMO proprietary value models.
Once again, apart from Covid, there isn’t a particular pattern of trouble across recessions for deep value. Let me emphasize this point: despite the common narrative about value in economic downturns, there is simply no empirical evidence to suggest value stocks consistently underperform during recessions. The cheapest price/book stocks did have quite a rough time of it in the Global Financial Crisis, but for the lowest quality way to define value one can readily imagine,
4
one notably bad outcome across seven recessions is substantially better than one would have naively expected. For versions of value that pay more attention to quality considerations, there were simply no noteworthy negative performances for value in U.S. recessions other than during Covid.
For those of you less uniquely oriented towards the U.S. stock market and economy, the pattern is not particularly different in the rest of the world. Exhibit 3 shows the performance of the cheap half of the market in recessions for the four largest developed economies outside the U.S.
Exhibit 3: Global Performance of Value (Cheapest 50%) in Recessions
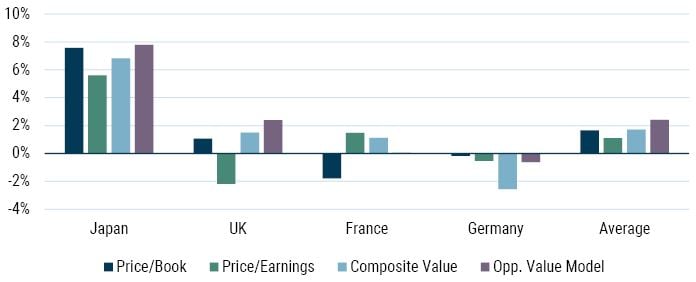
Data from 1969 – 2020 | Source: Compustat, Worldscope, Japanese Cabinet Office, Bundesbank, French Economic Assoc., Wikipedia, GMO
Robust Value and Opp. Value Model are GMO proprietary value models.
While the very impressive performance of value in Japan is a bit of a standout, even the worst of these country/parameter pairs – cheap Composite Value in Germany – only underperformed by 2.6% in the average recession.
Moving into the cheapest 20% of securities, which we find quite appealing today in all these markets, is actually even more reassuring, as we can see in Exhibit 4. Even the 2.6% average loss for cheap Composite Value in Germany has turned into a 2% gain instead.
Exhibit 4: Global Performance of Deep Value (Cheapest 20%) in Recessions
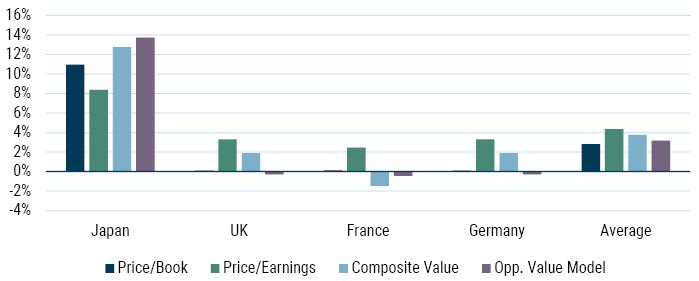
Data from 1969 – 2020 | Source: Compustat, Worldscope, Japanese Cabinet Office, Bundesbank, French Economic Assoc., Wikipedia, GMO
Robust Value and Opp. Value Model are GMO proprietary value models.
I’ll admit to finding it slightly odd that the larger quality bias in the blend of models we use in Opportunistic Value was a negative influence within European markets, but in no market and in no model was the performance of value in recessions particularly scary, and across the average market all the value models outperformed in recessions.
Why doesn’t value underperform?
So why doesn’t value struggle in recessions when it seems intuitive that it should do poorly? We think there are a couple of places where investors are misunderstanding value and growth that are relevant here. First, I think there is an assumption that value stocks are uniquely sensitive to the business cycle and that they are hence much more likely to disappoint investors in a recession than growth stocks are. This turns out not to be the case, as we will see looking at value traps and their counterparts in the growth universe, which I am attempting to get the investing world to recognize as “growth traps.”
Exhibit 5: Value and Growth Trap Weights
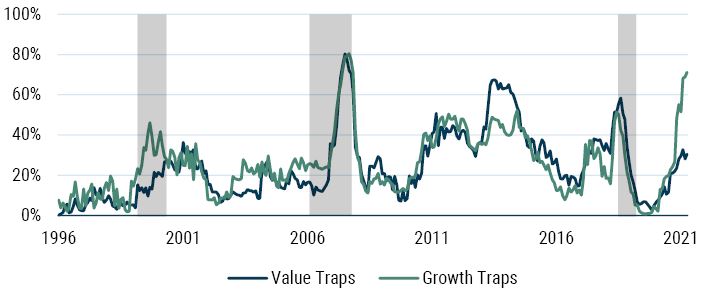
Data from 1996-2023 | Source: NBER, GMO, IBES, Compustat, Worldscope
Traps are stocks that disappoint on revenues in a year and see following year’s revenue growth forecast drop. Value and Growth are the cheap and expensive 50% of Top 1,000 U.S. stocks on GMO Robust Value metric.
Everyone has a good idea of what a value trap is, and investors are used to grilling their value managers on how they go about trying to avoid them. We came up with a definition of value trap that allowed us to measure just how problematic the issue is. Since a value trap is generally thought of as a company that looked cheap but proved to be less cheap than the investor thought because its fundamentals deteriorated, we define a value trap as a company that disappoints on revenues in a given year and also sees its future revenue growth expectations fall. We choose to use revenues rather than earnings for this purpose since it can be hard to know exactly what version of earnings analysts are forecasting, but the basic idea is simple. We are looking for companies whose fundamentals wind up disappointing, and where that disappointment is not merely a short-term problem but reflects a downgrading of the future prospects of the company that is at least as severe as the near-term headwinds. On average, about 25% of the value half of the market
6
is a trap in a given year. But as we see in Exhibit 5,
7
the percent of the value universe that winds up being a trap is not constant over time and generally rises in recessions (shaded in gray).
8
Exhibit 5 also shows the analogous group in the growth universe. Value stocks are not the only stocks that disappoint their investors. As we can see from the orange line on the chart, growth stocks on average are just as likely to meet our definition of traps as value stocks are. Furthermore, the shaded sections of the chart show that growth stocks see their odds of becoming a trap rise in a similar fashion in recessions.
We see spikes in value traps and growth traps in all three recessions. The last year has been a really interesting case as well. The U.S. does not seem to be in a recession at the moment, but the vast majority of growth stocks have both disappointed on revenues in the past 12 months and seen future revenue growth estimates come down. Each of the top 10 growth names in the U.S. were officially traps in the last year, although the scale of the issue varies by company. Apple disappointed by 4% on their revenues and saw their future growth expectations fall by 4% as well, whereas Tesla disappointed about 9% and saw its future growth forecast come down by a massive 34%. The huge prevalence of growth traps last year does call into question the common narrative about the 2022 growth carnage. Rather than being a case of growth stock valuation premia coming down due to rising interest rates, I’d argue that an awful lot of the pain was from growth stock valuation premia coming down because the growth stocks proved less growthy than investors had hoped.
At the risk of banging the same drum I have been on for some time: though value traps seem to be a much bigger concern for investors than growth traps, growth traps are every bit as prevalent (actually, they are slightly more so). And what’s more, they turn out to be much more damaging to investors when they occur. Exhibit 6 shows the performance of value traps and growth traps relative to the rest of the value and growth universes.
Exhibit 6: Value Trap and Growth Trap Returns
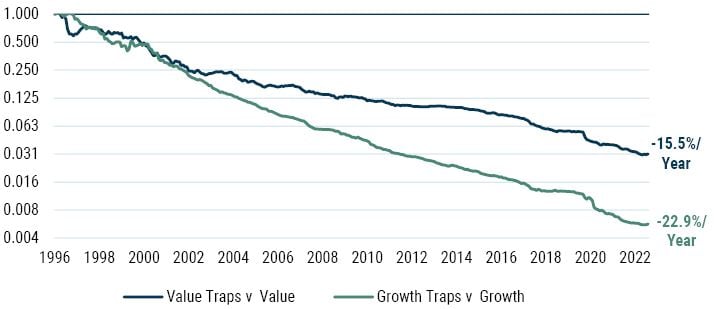
Data from 1996-2023 | Source: GMO,IBES, Compustat, Worldscope
Traps are stocks that disappoint on revenues in a year and see following year’s revenue growth forecast drop. Value and Growth are the cheap and expensive 50% of Top 1,000 U.S. stocks on GMO Robust Value metric.
I am not claiming that value traps are not painful. They are extremely painful, and we see in Exhibit 6 that they underperform the rest of the value universe by more than 15% in an average year. They are a group well worth avoiding, and feel free to continue to pester your value managers about how they go about trying to avoid them. But growth traps are a whole lot worse, and you can see in Exhibit 6 that they underperform the rest of the growth universe by a stunning 22.9% per year. At some level, this does make sense. While value companies are capable of disappointing investors, and any company that disappoints will generally underperform, when a growth company disappoints, it means not only that their fundamentals are worse than expected, but that they are less worthy of being considered a growth stock in the first place. Since growth stocks trade at a premium to the market because investors believe they will grow strongly in the future, an event which calls that future growth into question is likely to be particularly painful since their valuation premium deserves to fall. For our purposes here, the basic point is a simple one. Value stocks and growth stocks are basically equally likely to disappoint in a recession and when growth stocks disappoint, they are generally going to be punished a lot more.
I’ll admit that the trap percentages might not tell the whole story about the vulnerability of value stocks in recessions. While similar percentages of value and growth stocks might disappoint in recessions, and we know that on average when growth stocks disappoint it hurts more, it might be the case that when specifically looking at recessionary periods, things are different. Since I can only take the trap data back to 1996, I’ve only got three recessions to look at. In the 2001 and 2008-2009 recessions, value traps and growth traps underperformed the rest of their cohorts by 19.8% and 24.1%, respectively. Once again, the Covid recession of 2020 proved to be the outlier, with value traps underperforming by 18.5% versus 12.2% for growth traps.
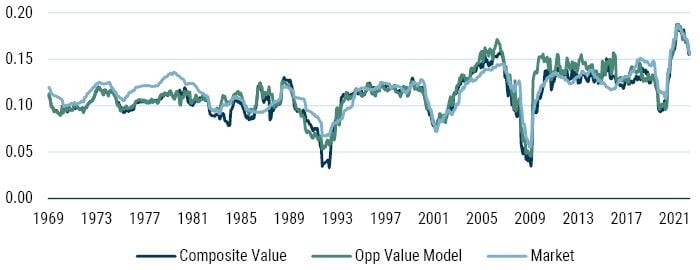
Value profitability and cyclicality is in line with the market
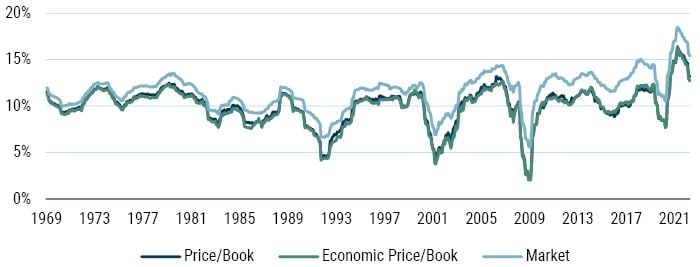
Still, I hear some of you saying, “But surely value stocks are more cyclical than growth stocks, and that must wind up hurting them in recessions somehow.” Here we need to be a little more careful about how we define our value stocks. If we define value on price/book (even after correcting book value for its various distortions with a measure we call GMO’s price/economic book), value is a lower-profitability group than the market on average, and it is noticeably more cyclical, as you can see in Exhibit 7.
Exhibit 7: Return on Capital for Cheapest 50% of Market on Price/Book and the Broad Market
Data from 1969-2023 | Source: GMO, Compustat, Worldscope
On average, the cheap half of the market on either measure has a return on capital
10
about 1.5% worse than the market as a whole, and the gap grows to between 2.0% and 2.5% in recessions. In the GFC of 2007-2009, the gap was as much as 3.6%, which probably goes some way toward explaining why cheap price/book did as badly as it did in that event (i.e., the most severe recession in the U.S. since the Great Depression). But not all definitions of value are as junky as price/book, which is by a decent margin the worst of the lot.
Exhibit 8 shows the same data for the Composite Value model and the blend we use for U.S. Opportunistic Value.
Exhibit 8: Return on Capital for Cheapest 50% on Composite Value and the GMO Opportunistic Value Blend
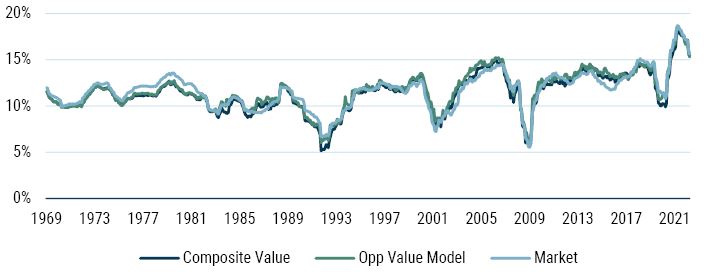
Data from 1969-2023 | Source: GMO, Compustat, Worldscope
That substantial profitability gap we saw for price/book is entirely absent here. Composite Value has an average profitability decrement of -0.3% relative to the market, and the blended model we use in our Opportunistic Value portfolios almost precisely matches the market. And measured at the profitability low of each recession in our data, the difference is a profitability decrement of -0.4% for Composite Value and again zero on the blend. In other words, these value measures have almost exactly the same amount of cyclicality as the market and very similar levels of profitability in the first place.
When we tighten our definition to the best 20% of value on these measures, there is a little more cyclicality to value, but it’s only a couple of tenths of a percent of return on capital, as you can see in Exhibit 9.
Exhibit 9: Return on Capital for Cheapest 20% on Composite Value and the GMO Opportunistic Value Blend
Data from 1969-2023 | Source: GMO, Compustat, Worldscope
If you squint very hard, you could make the case that deep value is slightly more cyclical than the market, but the benefit of low expectations for these companies seems to more than compensate for any mildly greater deterioration in profitability during the average recession.
Conclusion
The common assumption that value is destined to underperform in a recession simply does not fit the historical data. I’ll freely admit that value did strikingly poorly in the Covid crisis period, but when we widen our view to look at other more typical recessions, we see that the Covid event was very much the exception rather than the rule. Even in the GFC, only the junkiest definition of value substantially underperformed, with other definitions holding up decently well and a couple notably outperforming the market. The reasons for this are fairly straightforward. Most thoughtful metrics for defining value have similar profitability characteristics to the broad market. While plenty of value stocks will end up disappointing investors when a recession comes, historically they have not been any more likely to disappoint than their growth counterparts. It is the disappointing growth stocks that are the biggest headache for investors, since their disappointments call into question their premium valuations. Value stocks, by contrast, have the charm of low expectations. No one is expecting all that much from them, so they have less to lose in an economic environment in which companies of all stripes wind up having a tough time. In a market that seems fraught with risk, deep value stocks are underheld by most investors, despite their extraordinary valuations. As we reference above, we believe those holding back due to recession fears should take some comfort in history and have a second look.
Download article here.