
Pre-opening Comments for Thursday April 6th
U.S. equity index futures were mixed this morning. S&P 500 futures were unchanged at 8:30 AM EDT.
The Canadian Dollar added $0.06 to US74.22 cents after release of Canada’s March Employment report at 8:30 AM EDT. Consensus for job creation was 7,000 positions. Actual was an increase to 34,700. Consensus for the Unemployment Rate was an increase to 5.1% from 5.0% in February. Actual was unchanged at 5.0%.
Costco dropped $11.13 to $486.48 after reporting lower same store March sales.

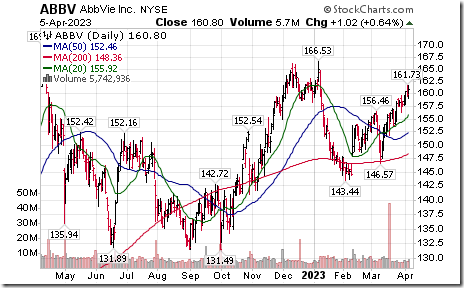
AbbVie fell $3.00 to $157.80 after the company lowered guidance.
FedEx gained $2.69 to $232.62 after Raymond James upgraded the stock from Market Perform to Outperform. Target price is $285.

EquityClock’s Daily Comment
Headline reads “Benchmarks with a core-cyclical influence continue to chart threatening technical setups as investors rotate to defensive alternatives”.
http://www.equityclock.com/2023/04/05/stock-market-outlook-for-april-6-2023/
Technical Notes
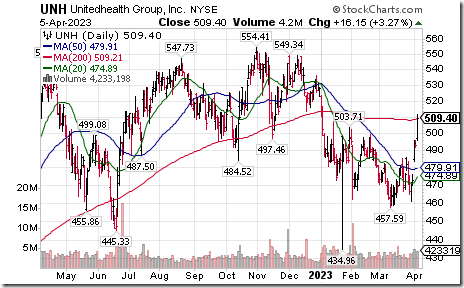
UnitedHealth Group $UNH a Dow Jones Industrial stock moved above $503.71 extending an intermediate uptrend.
PACCAR $PCAR a NASDAQ 100 stock moved below $$68.22 extending an intermediate downtrend.

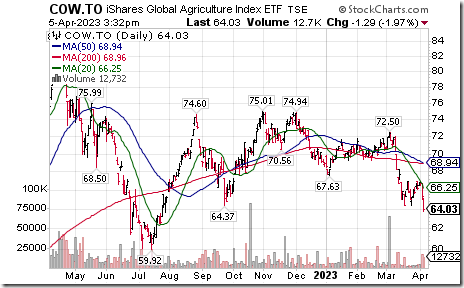
Agriculture ETF $COW.TO moved below intermediate support at $64.37.
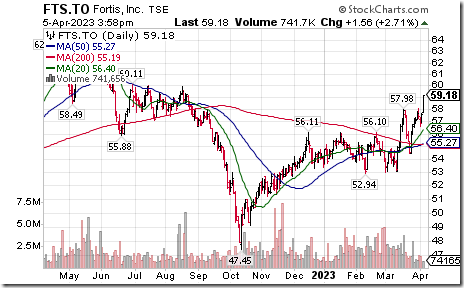
Fortis $FTS.TO a TSX 60 stock moved above $57.98 extending an intermediate uptrend.
Trader’s Corner
Equity Indices and Related ETFs
Daily Seasonal/Technical Equity Trends for April 5th 2023
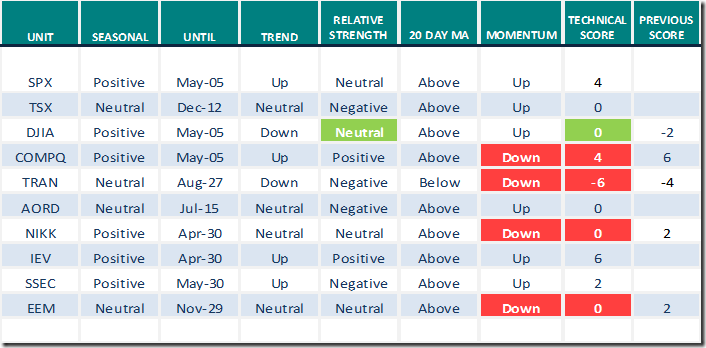
Green: Increase from previous day
Red: Decrease from previous day
Commodities
Daily Seasonal/Technical Commodities Trends for April 5th 2023

Green: Increase from previous day
Red: Decrease from previous day
Sectors
Daily Seasonal/Technical Sector Trends for April 5th 2023
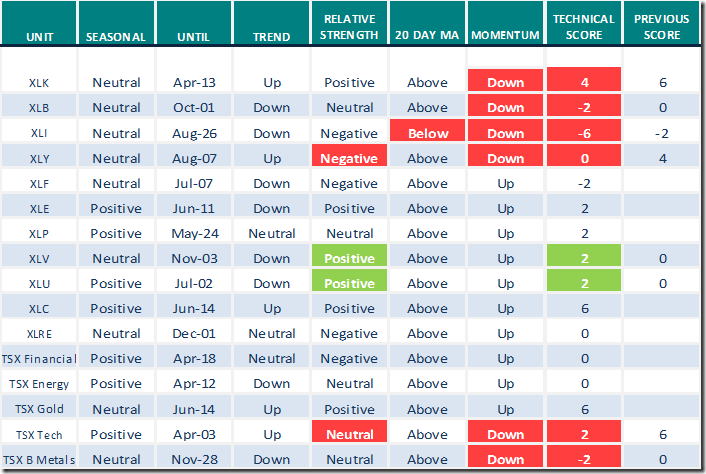
Green: Increase from previous day
Red: Decrease from previous day
Source for positive seasonal ratings: www.equityclock.com
Seasonality Chart of the Day
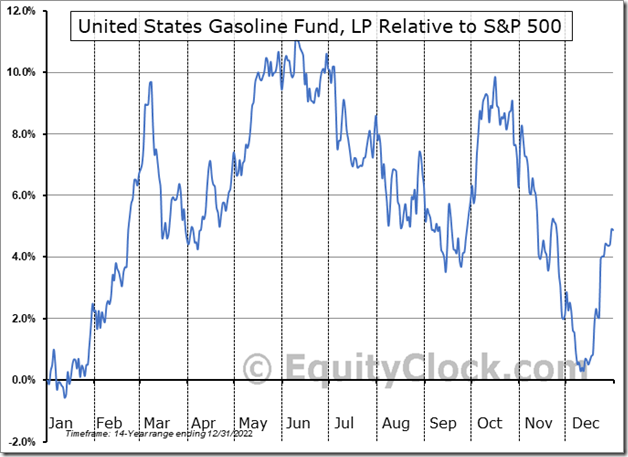
Seasonal Chart Analysis
Analysis of the United States Gasoline Fund, LP (NYSE:UGA) seasonal charts above shows that a Buy Date of March 30 and a Sell Date of June 29 has resulted in a geometric average return of 5.66% above the benchmark rate of the S&P 500 Total Return Index over the past 14 years.

Breakout has just occurred during its period of seasonal strength.
S&P 500 Momentum Barometers
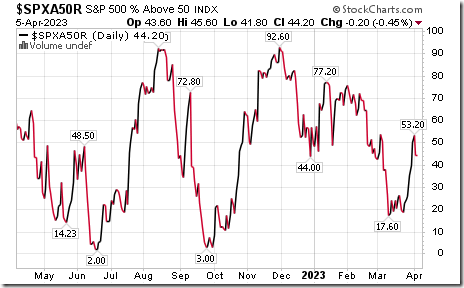
The intermediate term Barometer slipped 0.20 to 44.20. It remains Neutral.
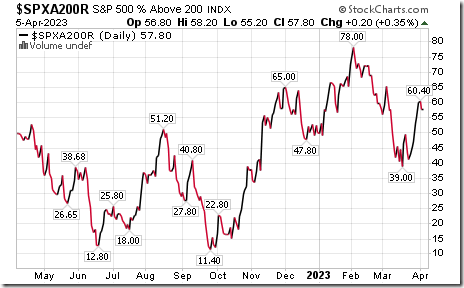
The long term Barometer added 0.20 to 57.80. It remains Neutral.
TSX Momentum Barometers
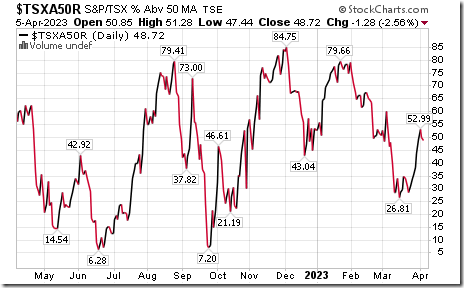
The intermediate term Barometer slipped 1.28 to 48.72. It remains Neutral.
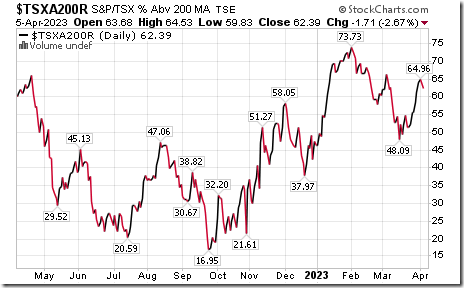
The long term Barometer slipped 1.71 to 62.39. It remains Overbought.
Disclaimer: Seasonality ratings and technical ratings offered in this report and at
www.equityclock.com are for information only. They should not be considered as advice to purchase or to sell mentioned securities. Data offered in this report is believed to be accurate, but is not guaranteed