
Pre-opening Comments for Friday March 31st
U.S. equity index futures were higher this morning. S&P 500 futures were up 12 points in at 8:40 AM EDT..
U.S. equity index futures moved higher following release of economic news at 8:30 AM EDT:
U.S. February Core PCE Price Index was expected to increase 0.4% versus a gain of 0.6% in January. Actual was an increase of 0.3%. On a year-over-year basis, February Core PCE Price Index is expected to increase 4.7% versus a gain of 4.7% in January. Actual was an increase of 4.6%.
U.S. February Personal Income was expected to increase 0.3% versus a gain of 0.6% in January. Actual was an increase of 0.2%. February Personal Spending was expected to increase 0.3% versus a gain of 1.8% in January. Actual was a drop of 0.1%.
The Canadian Dollar added 0.04 to US73.84 following release of Canada’s GDP report at 8:30 AM EDT. Consensus was an increase of 0.4%. Actual was an increase of 0.5%. On a year-over-year basis. Consensus was an increase of 2.9%. Actual was an increase of 3.0%.
First Quantum Minerals FM.TO added $0.75 to Cdn$31.50 on news that the company acquired a 55% interest in a copper prospect in Peru for $105 million.

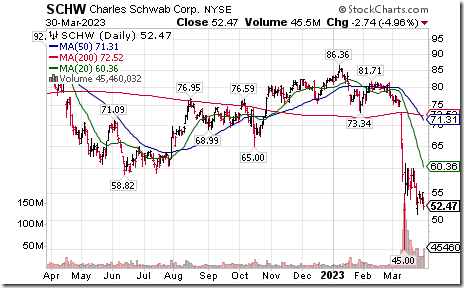
Charles Schwab slipped $0.38 to $52.09 after Morgan Stanley downgraded the stock from Overweight to Equal Weight.
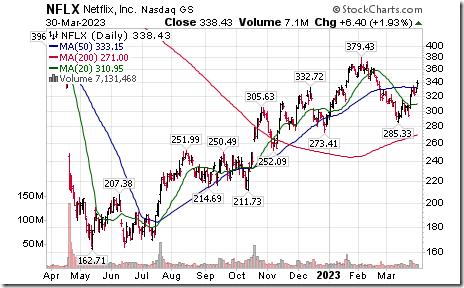
Netflix added $2.88 to $341.31 after Moody’s raised its credit rating.
EquityClock’s Daily Comment
Headline reads “Intermediate technicals of the market remain undamaged heading into the new quarter”.
http://www.equityclock.com/2023/03/30/stock-market-outlook-for-march-31-2023/
Technical Notes
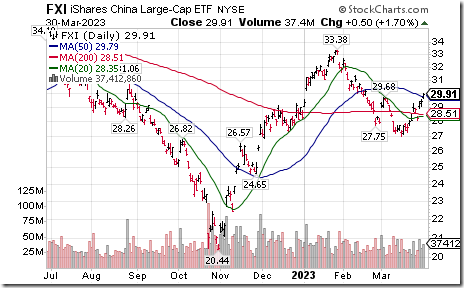
China Large Cap iShares $FXI moved above intermediate resistance at $29.68.
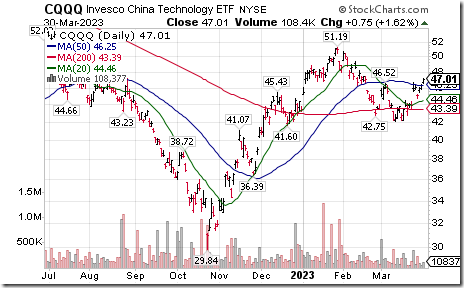
China Technology ETF $CQQQ moved above intermediate resistance at $46.52.
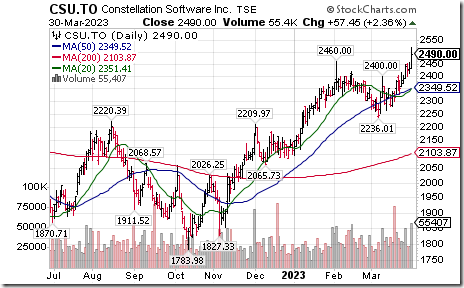
Constellation Software $CSU.TO a TSX 60 stock moved above $2,460.00 to an all-time high extending an intermediate uptrend.
Trader’s Corner
Equity Indices and Related ETFs
Daily Seasonal/Technical Equity Trends for March 30th 2023
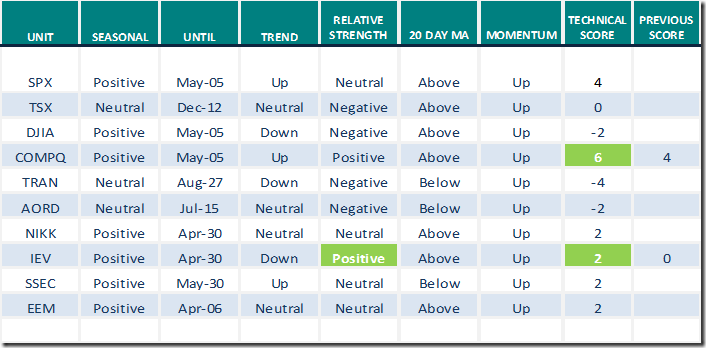
Green: Increase from previous day
Red: Decrease from previous day
Commodities
Daily Seasonal/Technical Commodities Trends for March 30th 2023
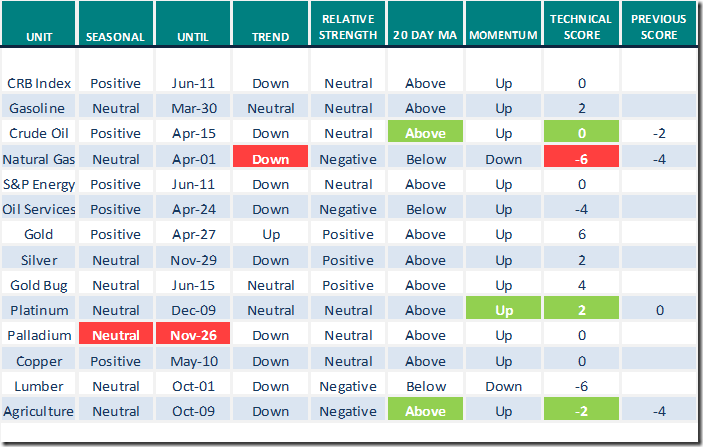
Green: Increase from previous day
Red: Decrease from previous day
Sectors
Daily Seasonal/Technical Sector Trends for March 30th 2023
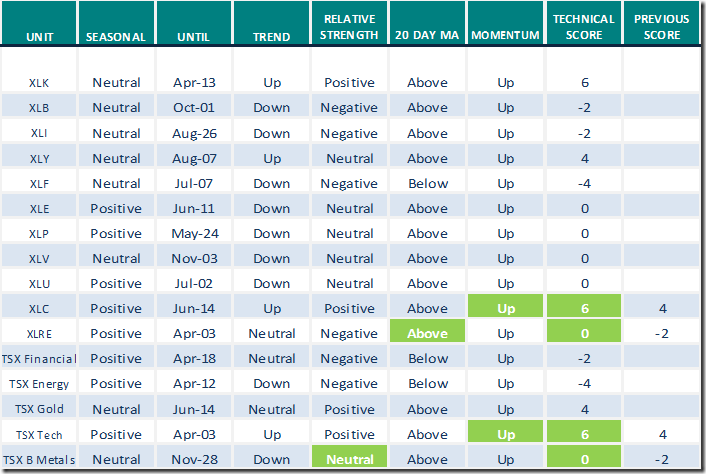
Green: Increase from previous day
Red: Decrease from previous day
Source for positive Seasonal ratings: www.equityclock.com
Seasonality Chart of the Day

Seasonal Chart Analysis
Analysis of the Invesco Golden Dragon China ETF (NASD:PGJ) seasonal charts above shows that a Buy Date of March 26 and a Sell Date of July 2 has resulted in a geometric average return of 3.15% above the benchmark rate of the S&P 500 Total Return Index over the past 18 years. This seasonal timeframe has shown positive results compared to the benchmark in 12 of those periods. This is a good rate of success and the return strongly outperforms the relative buy-and-hold performance of the stock over the past 18 years by an average of 6.74% per year.
Links offered by a valued providers
Charts Telling the Story of the Markets | Alex Cole and Tyler Wood, CMT (03.30.23)
2-Year Business Cycle: Expansion, Peak or Contraction? | Mish Schneider | Your Daily Five (03.30.23)
S&P 500 Momentum Barometers

The intermediate term Barometer advanced 4.60 to 39.80. It remains Oversold. Daily trend remains up.
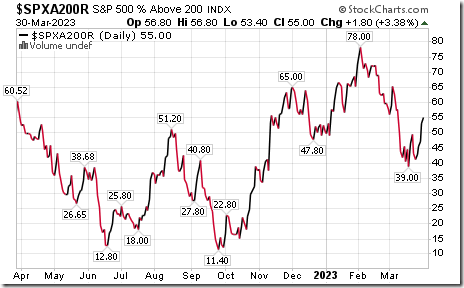
The long term Barometer added 1.80 to 55.00. It remains Neutral. Daily trend remains up.
TSX Momentum Barometers
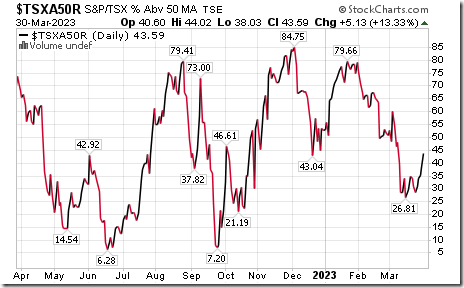
The intermediate term Barometer added 5.13 to 43.59. It changed from Oversold to Neutral on a move above 40.00. Daily trend remains up.

The long term Barometer added 2.56 to 61.11. It changed from Neutral to Overbought on a move above 60.00. Daily trend remains up.
Disclaimer: Seasonality ratings and technical ratings offered in this report and at
www.equityclock.com are for information only. They should not be considered as advice to purchase or to sell mentioned securities. Data offered in this report is believed to be accurate, but is not guaranteed