Pre-opening Comments for Monday March 27th
U.S. equity index futures were higher this morning. S&P 500 futures were up 24 points at 8:30 AM EDT. Index futures responded to news that First Citizens Bank has acquired a major part of the assets of failed Silicon Valley Bank.
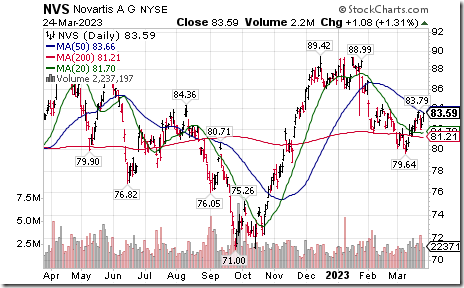
Novartis advanced $5.60 to $89.19 after announcing positive results from a breast cancer drug trial
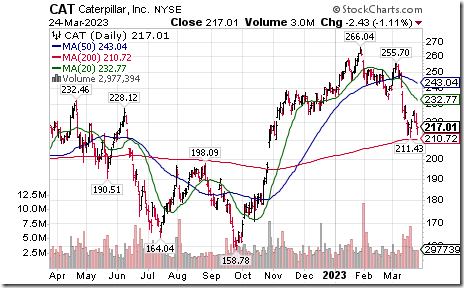
Caterpillar dropped $2.86 to $214.15 after Baird downgraded the stock from Neutral to Under Perform
Roku gained $2.22 to $62.22 following an upgrade from Neutral to Positive by Susquehanna
KeyCorp added $0.94 to $12.80 after Citigroup upgraded the stock to Buy.
EquityClock’s Daily Comment
Headline reads “Market ends the week on a defensive note as caution pertaining to the economy grows”.
http://www.equityclock.com/2023/03/25/stock-market-outlook-for-march-27-2023/
The Bottom Line
Between a rock and a hard place! That’s where the Federal Reserve finds itself. The FOMC raised its Fed Fund rate by another 0.25% to 4.75%-5.00% on Wednesday as anticipated. Efforts to dampen inflation by raising the Fed Fund rates in recent months are working, but selected regional and specialty banks (e.g. Silicon Valley and Signature) are experiencing a severe squeeze on their interest rate spreads. At least six additional regional banks are thought to be on the “watch list” by regulators for default action due to a possible run on their assets. The Federal Reserve now is expected to “wait for additional data points” before deciding its next move. Trader focus is on news from the next FOMC meeting on May 3rd. Next significant data point is released this Friday when February core PCE Price Index is released.
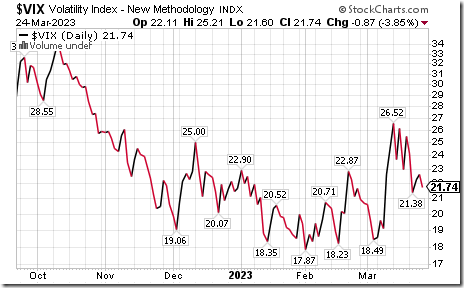
Meanwhile, the VIX Index, a measure of U.S. equity market uncertainty, is likely to remain elevated near 22% until the Federal Reserve offers a more definitive strategy.
According to the Washington Examiner, “cash is king”
The CNN Fear & Greed Index recovered slightly last week to 33, but remains stalled in the “Fear” category. See https://www.cnn.com/markets/fear-and-greed
Anticipation of first quarter earnings reports by major North American companies is unlikely to encourage trader interest during the next four weeks. Consensus for earnings by 5&P 500 companies in the first quarter calls for a drop of 6.1% on a year-over-year basis.
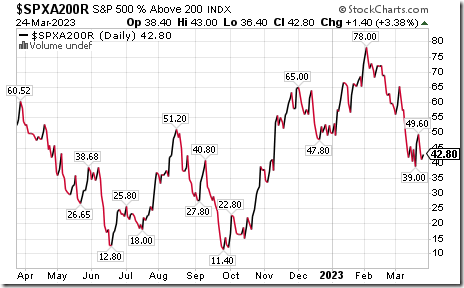
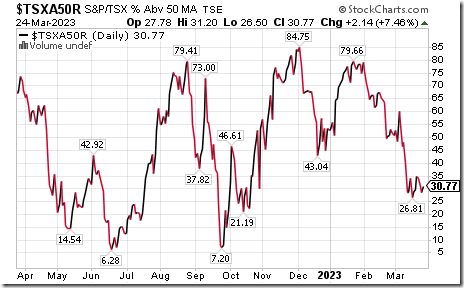
Technical action by broadly based U.S. and Canadian equity indices, based on Percent of stocks trading above their 50 and 200 day moving averages, likely bottomed on March 15th, an encouraging sign. See charts at the end of this report.
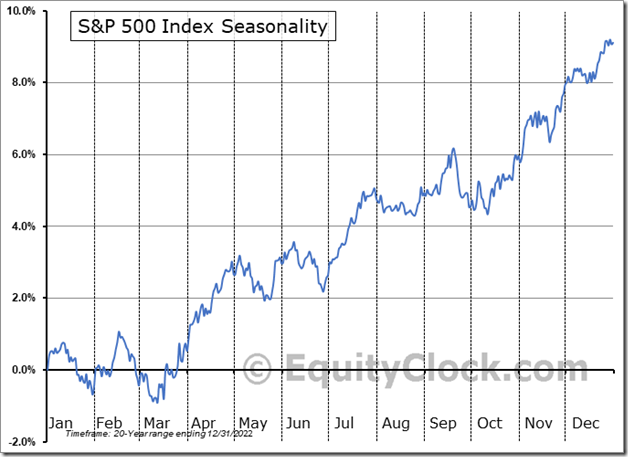
A low in mid-March fits the seasonal pattern for North American equity indices. During the past 20 years, the second best period in the year to own North American equities and related indices is between March 15th to May 5th (The best period is from October to early January)
Economic News This Week
Next estimate of fourth quarter annualized real U.S. GDP released at 8:30 AM EDT on Thursday is expected to remain unchanged with growth at a 2.7% rate.
U.S. February Core PCE Price Index released at 8:30 AM EDT on Friday is expected to increase 0.4% versus a gain of 0.6% in January. On a year-over-year basis, February Core PCE Price Index is expected to increase 4.7% versus a gain of 4.7% in January.
U.S. February Personal Income released at 8:30 AM EDT on Friday is expected to increase 0.3% versus a gain of 0.6% in January. February Personal Spending is expected to increase 0.3% versus a gain of 1.8% in January.
March Michigan Consumer Sentiment released at 10:00 AM EDT on Friday is expected to remain unchanged from February at 63.4.
Selected Earnings News This Week
Trader’s Corner
Equity Indices and Related ETFs
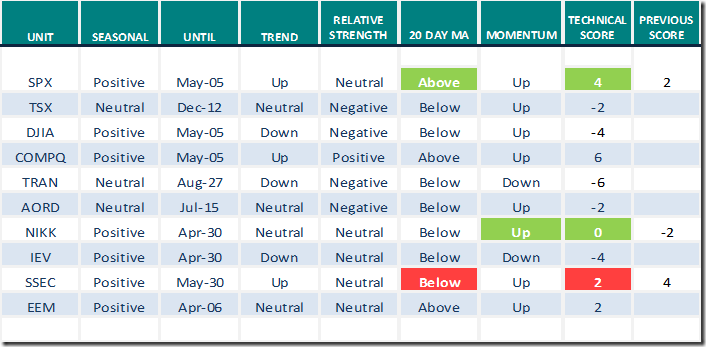
Daily Seasonal/Technical Equity Trends for March 24th 2023
Green: Increase from previous day
Red: Decrease from previous day
Commodities
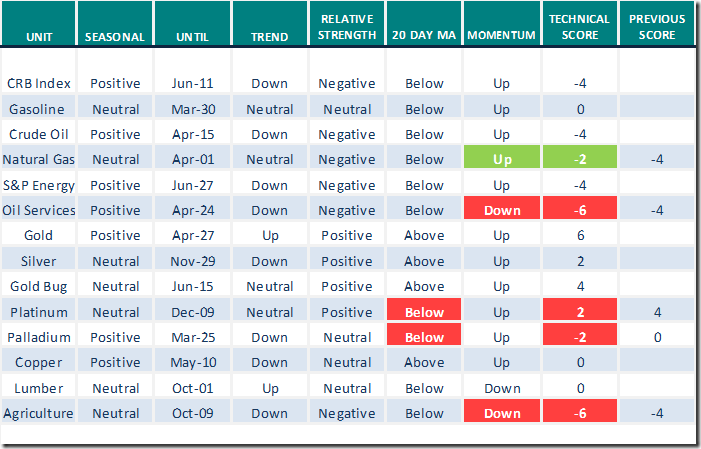
Daily Seasonal/Technical Commodities Trends for March 24th 2023
Green: Increase from previous day
Red: Decrease from previous day
Sectors
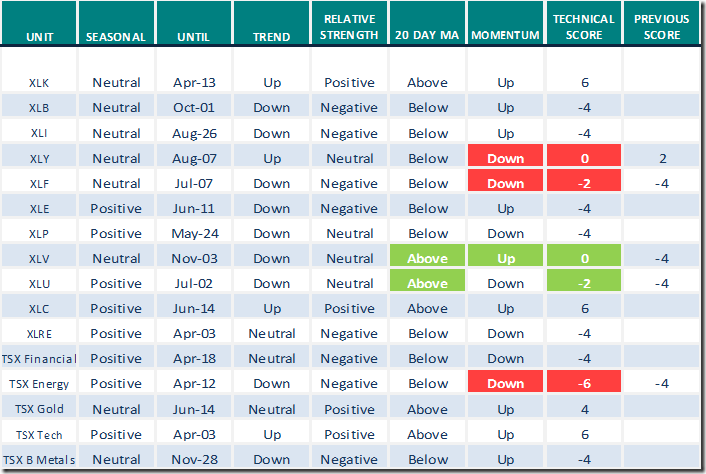
Daily Seasonal/Technical Sector Trends for March 24th 2023
Green: Increase from previous day
Red: Decrease from previous day
Source for positive Seasonal ratings: www.equityclock.com
Technical Scores
Calculated as follows:
Intermediate Uptrend based on at least 20 trading days: Score 2
(Higher highs and higher lows)
Intermediate Neutral trend: Score 0
(Not up or down)
Intermediate Downtrend: Score -2
(Lower highs and lower lows)
Outperformance relative to the S&P 500 Index: Score: 2
Neutral Performance relative to the S&P 500 Index: 0
Underperformance relative to the S&P 500 Index: Score –2
Above 20 day moving average: Score 1
At 20 day moving average: Score: 0
Below 20 day moving average: –1
Up trending momentum indicators (Daily Stochastics, RSI and MACD): 1
Mixed momentum indicators: 0
Down trending momentum indicators: –1
Technical scores range from -6 to +6. Technical buy signals based on the above guidelines start when a security advances to at least 0.0, but preferably 2.0 or higher. Technical sell/short signals start when a security descends to 0, but preferably -2.0 or lower.
Long positions require maintaining a technical score of -2.0 or higher. Conversely, a short position requires maintaining a technical score of +2.0 or lower
Changes Last Week
Links offered by valued providers
Mark Leibovit comment for March 23rd
Gold, The Fed, Bitcoin, Real Estate – HoweStreet
Confirming The 1-2-3 Reversal | Joe Rabil | Stock Talk (03.23.23)
Confirming The 1-2-3 Reversal | Joe Rabil | Stock Talk (03.23.23) – YouTube
Odd or Resilient? European Banks: Greg Schnell March 24, 2023
https://stockcharts.com/articles/canada/2023/03/odd-or-resilient-european-bank-824.html
Michael Campbell’s Money Talks for March 25th
Michael Campbell’s MoneyTalks – Complete Show (mikesmoneytalks.ca)
Were There Technical Warnings Ahead of the Regional Banking Crash? Oh, Yeah!
Despite Bank Chaos, Technology Remains Strong | The Final Bar (03.24.23)
Despite Bank Chaos, Technology Remains Strong | The Final Bar (03.24.23) – YouTube
March 24, 2023 | Can We Trust Canadian Banks? Bob Hoye
Can We Trust Canadian Banks? – HoweStreet
Victor Adair Trading Desk Notes for March 25th 2023
Trading Desk Notes For March 25, 2023
Mark Bunting and www.uncommonsenseinvestor.com
Yardeni & Rosenberg on Banking Storm – Uncommon Sense Investor
Technical Scoop from David Chapman and www.EnrichedInvesting.com
Technical Notes for Friday
The S&P 500 Index moved above its 20 and 200 day moving averages on Friday
Water Resources ETF $PHO moved below intermediate support at $50.32
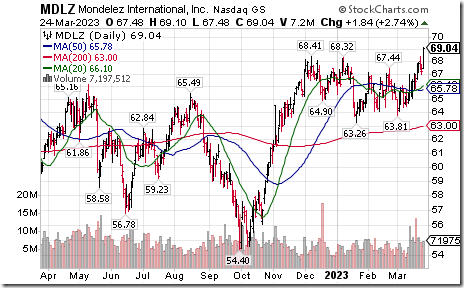
Mondelez $MDLZ an S&P 100 stock moved above $68.41 to an all-time high extending an intermediate uptrend.
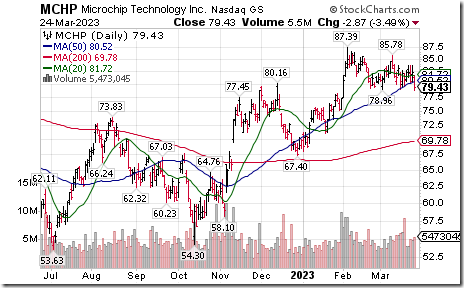
Microchip Technologies $MCHP a NASDAQ 100 stock moved below $78.96 completing a double top pattern.
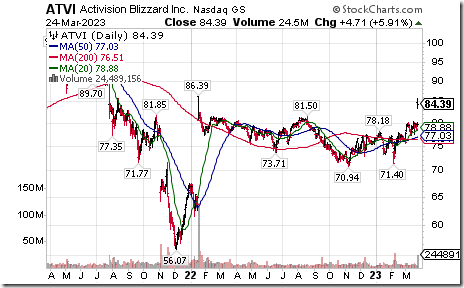
Activision Blizzard $ATVI a NASDAQ 100 stock moved above $46.50 extending an intermediate uptrend. The takeover by Microsoft took another legal step forward.
American International Group $AIG an S&P 100 stock moved below $46.50 extending an intermediate downtrend.
S&P 500 Momentum Barometers
The intermediate term Barometer added 4.20 on Friday and 2.60 last week to 23.00. It remains Oversold, but shows early signs of passing a seasonal low.
The long term Barometer added 1.40 on Friday and 3.80 last week to 42.80. It changed last week from Oversold to Neutral on a recovery above 40.00.
TSX Momentum Barometers
The intermediate term Barometer added 2.14 on Friday and 0.98 last week to 30.77. It remains Oversold, but shows early signs of passing a seasonal low.
 The long term Barometer added 0.85 on Friday and 2.78 last week to 52.14. It remains Neutral.
Disclaimer: Seasonality ratings and technical ratings offered in this report and at
www.equityclock.com are for information only. They should not be considered as advice to purchase or to sell mentioned securities. Data offered in this report is believed to be accurate, but is not guaranteed


