


The Bottom Line
Focuses in the U.S. this week are on reports by U.S. retailers and comments on monetary policy by at least three members of the FOMC. Elevated retail sales in January should help performance by the sector. On the other hand, volatility in U.S. equity indices is likely to be elevated until an intermediate peak in the Fed Fund Rate is acknowledged by the stock and bond markets, an event that is unlikely to occur before the next FOMC meeting report on March 22nd
Focuses this week in Canada are fiscal first quarter reports by Canada’s banks. Look for good and bad news: Good news from operating earnings (e.g. Commerce Bank’s report on Friday) and bad news from a large increase in loan loss provisions.
Consensus for Earnings and Revenues for S&P 500 Companies
Analyst estimates for fourth quarter 2022 earnings and revenue changed slightly from our last report on February 21st. Ninety four percent of S&P 500 companies have reported quarterly results to date. According to www.factset.com fourth quarter earnings are expected to decrease 4.8% (versus previous decrease of 4.7%) but revenues are expected to increase 5.4% (versus previous increase of 5.1%).
Preliminary earnings and revenue estimates for 2023 continued to move lower. According to www.factset.com first quarter 2023 earnings are expected to decrease 5.7% (versus previous decrease of 5.4%) but revenues are expected to increase 1.8% (versus previous increase of 1.9%). Second quarter 2023 earnings are expected to decrease 3.7% (versus previous decrease at 3.4%) and revenues are expected to decrease 0.2% (versus previous decrease of 0.1%) Third quarter earnings are expected to increase 3.0% (versus a previous increase of 3.3%) and revenues are expected to increase 1.3% (versus previous increase of 1.4%). Fourth quarter earnings are expected to increase 9.7% and revenues are expected to increase 3.3% (versus previous increase of 3.4%). For all of 2023, earnings are expected to increase 2.2% (versus previous increase of 2.3%) and revenues are expected to increase 2.2% (versus previous increase of 2.3%)
Economic News This Week
Focuses this week are on leading economic indicators (i.e. the ISM indices) reported at 8:30 AM EST on Wednesday and Friday.
January Durable Goods Orders released at 8:30 AM EST on Monday are expected to drop 4.0% versus a gain of 5.6% in December.
Canadian December Gross Domestic Product released at 8:30 AM EST on Tuesday is expected to increase 0.1% versus a gain of 0.1% in November.
February Chicago Purchasing Managers Index released at 9:45 AM EST on Tuesday is expected to improve to 45.0 from 44.3 in January.
January Construction Spending released at 10:00 AM EST on Wednesday is expected to increase 0.2% versus a drop of 0.4% in December
February ISM Manufacturing Purchasing Managers Index released at 10:00 AM EST on Wednesday is expected to improve to 48.0 from 47.4 in January.
February ISM Non-manufacturing Purchasing Managers Index released at 10:00 AM EST on Friday is expected to slip to 54.5 from 55.2 in January.
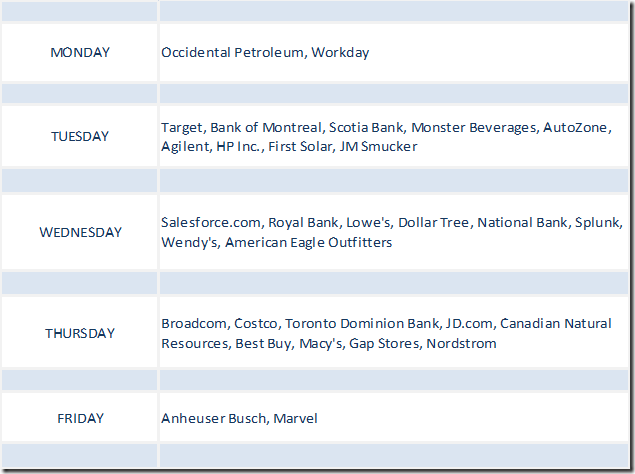
Selected Earnings News This Week
Twenty seven S&P 500 companies and one Dow Jones Industrial Average company (Salesforce.com) are scheduled to report quarterly results this week.
Five Canadian banks and Canadian Natural Resources are scheduled to report this week.
Trader’s Corner
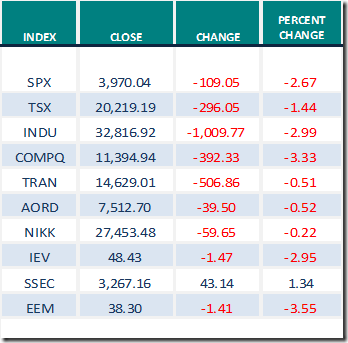
Equity Indices and Related ETFs
Daily Seasonal/Technical Equity Trends for Feb.24th 2023
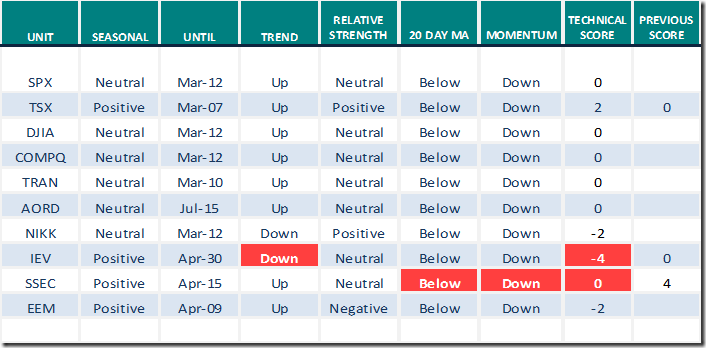
Green:Increase from previous day
Red: Decrease from previous day
Commodities
Daily Seasonal/Technical Commodities Trends for Feb.24th 2023
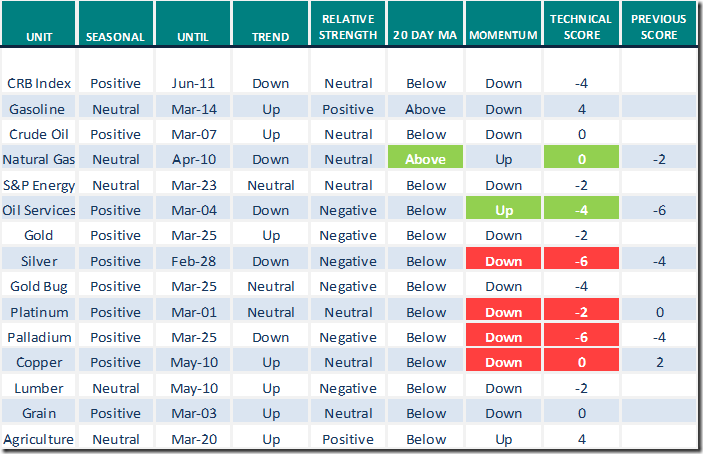
Green: Increase from previous day
Red: Decrease from previous day
Sectors
Daily Seasonal/Technical Sector Trends for Feb.24th 2023
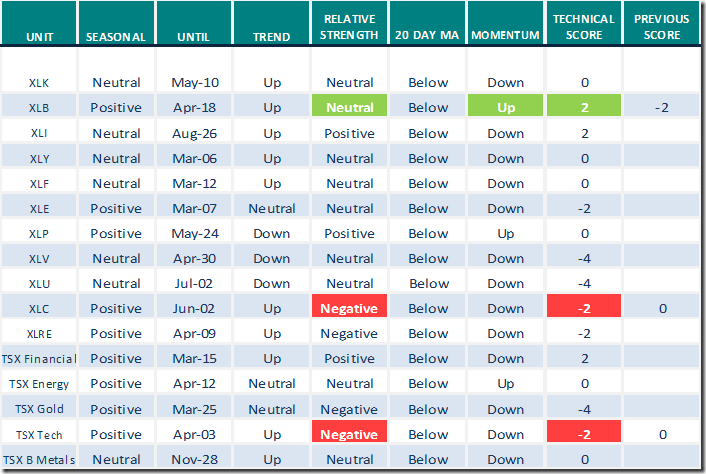
Green: Increase from previous day
Red: Decrease from previous day
Notes developed for the interview on Saturday for Michael Campbell’s Money Talks: An update to the yearend interview
Comment: North American equity indices follow a four year Presidential cycle after a new president from the previous party takes control (As happened when Biden, the Democrat became President by defeating Trump, the Republican).
Seasonal expectation: North American equity indices reach a four year low in mid-year during the second year after the new President is elected. Historically, North American equity indices record their strongest year in the third year of the four year Presidential cycle.
Actual observations: North American equity indices completed double bottom patterns with lows reached near the end of June and in mid-October. As of February 23rd, the S&P 500 Index had added 14.6% and the TSX Composite Index had advanced 13.0%.from their lows in mid-October.
Outlook: Seasonal analysis of North American equity markets since 1930 indicates that the third year of the Presidential Cycle (e.g. 2023) is the strongest period in the four year cycle. Average gain per period for the Dow Jones Industrial Average since 1930 was 14.0%. North American equity markets started strong in January this year with the S&P 500 gaining 6.2% and the TSX Composite Index advancing 7.1%. However, technical indicators for both markets became short term overbought. Moreover, the third year is not without an occasional “speed bump” in its first half. This year, investors have become concerned about moves by the Bank of Canada and the Federal Reserve to reduce inflation rates by increasing their Bank Lending Rate in Canada and their Fed Fund Rate in the U.S. Their efforts have been hampered by exceptional job creation in both countries where unemployment rates remain near generational lows and growth in labour compensation levels remain high. In the U.S., investors are focusing on March 21st and May 3rd when the Federal Open Market Committee is scheduled to update its Fed Fund Rate. Consensus calls for an increase in the Fed Fund Rate on March 22nd by 0.25% to 4.75%-5.00%.
Comment: Preferred sector investment for the first half of 2023 is the Mines and Metals sector. An Exchange Traded Fund, that tracks the sector, is S&P Metals and Mining SPDRs (Symbol: XME).
Seasonal expectation: Favourable seasonal influences peak in early June and bottom in early October.
Actual observation: XME continued to advance following our last comment at the end of December, up another 9.8%.
Outlook: Demand for products in the Mines and Metals sector in the U.S. is expected to expand significantly in 2023 as funds for the U.S. Infrastructure Program are employed. Demand also is expected to increase from China as its economy reopens from COVID 19 restrictions. XME is expected to benefit for a seasonal trade lasting to early June.
Comment: Wholesale gasoline prices in the U.S. based on the Exchange Traded Note: (UGA Price: $58.44) have a history of moving higher in the first half of the year as the summer driving season arrives.
Seasonal expectation: Gasoline prices move higher from mid-December to the end of June. Optimal holding period is from March 30th to June 29th. Average return per optimal period for the ETN (Symbol: UGA) during the past 14 years was 8.0%.
Actual observation: Wholesale gasoline prices in Canada and the U.S. were virtually unchanged from the end of December to now.
Outlook: Gasoline prices bottomed in mid-December on schedule. Since then, they have formed a base building pattern on the charts. A move above US$65.21 will complete the pattern.
Accumulation for a seasonal trade from March to June is preferred.
Comment: TSX Gold iShares (XGD.TO) have two periods of seasonal strength each year related to recurring annual events: Gold is purchased from mid-June to early September by jeweler manufacturers in India for the Diwali season and from mid-December to end of February by jeweler manufacturers in China for the Chinese New Year.
Seasonal Expectations: Gold and gold stocks move higher from mid- December to the end of February and from mid-June to early September.
Actual observations: XGD.TO advanced 11% from the end of December 2022 to February 1st 2023 corresponding with weakness in the U.S. Dollar Index. When the U.S. Dollar began to recover, gold and gold stocks moved lower.
Outlook: The sector currently is out of favour on a seasonal basis until mid-June.
Technical Scores
Calculated as follows:
Intermediate Uptrend based on at least 20 trading days: Score 2
(Higher highs and higher lows)
Intermediate Neutral trend: Score 0
(Not up or down)
Intermediate Downtrend: Score -2
(Lower highs and lower lows)
Outperformance relative to the S&P 500 Index: Score: 2
Neutral Performance relative to the S&P 500 Index: 0
Underperformance relative to the S&P 500 Index: Score –2
Above 20 day moving average: Score 1
At 20 day moving average: Score: 0
Below 20 day moving average: –1
Up trending momentum indicators (Daily Stochastics, RSI and MACD): 1
Mixed momentum indicators: 0
Down trending momentum indicators: –1
Technical scores range from -6 to +6. Technical buy signals based on the above guidelines start when a security advances to at least 0.0, but preferably 2.0 or higher. Technical sell/short signals start when a security descends to 0, but preferably -2.0 or lower.
Long positions require maintaining a technical score of -2.0 or higher. Conversely, a short position requires maintaining a technical score of +2.0 or lower
Changes Last Week
Technical Notes for Friday
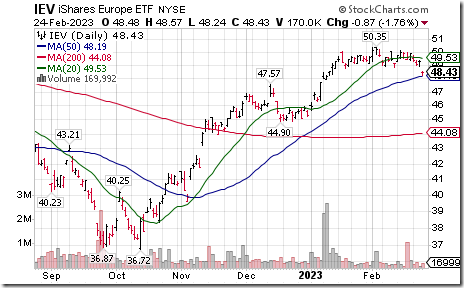
Europe iShares $IEV moved below $48.89 and $48.76 completing a Head & Shoulders pattern.
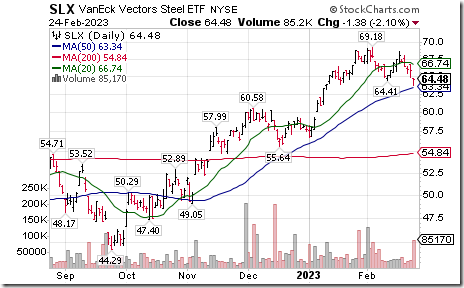
Steel ETF $SLX moved below $64.41 completing a double top pattern.
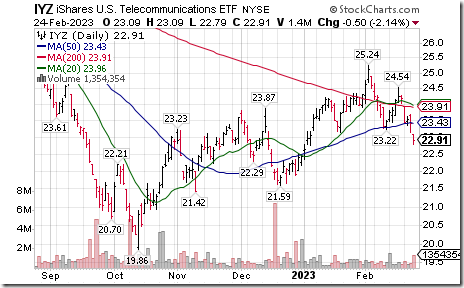
U.S. Telecommunications iShares $IYZ moved below $23.22 completing a Head & Shoulders pattern.
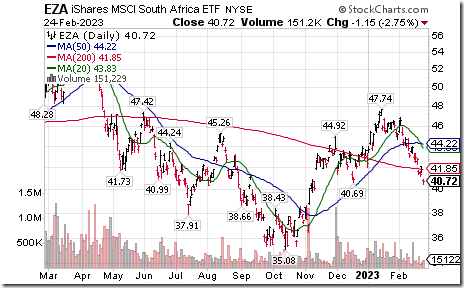
South Africa iShares EZA moved below intermediate support at $40.69.
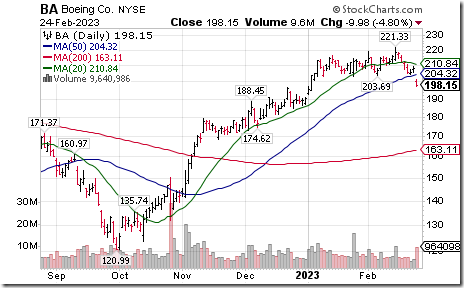
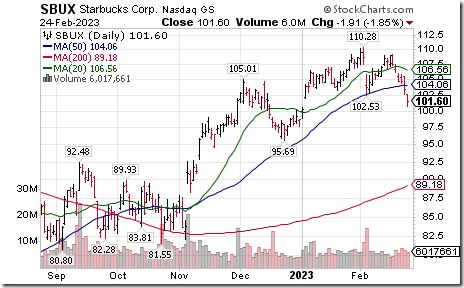
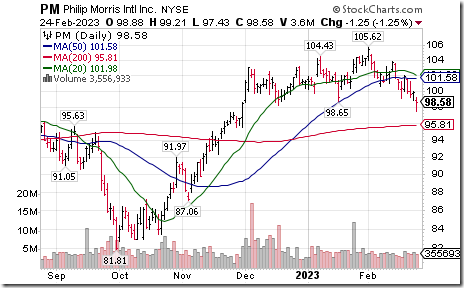
S&P 100 stocks moving below intermediate support included Boeing $BA, Duke Energy $DUK, Starbucks $SBUX and Philip Morris $PM.
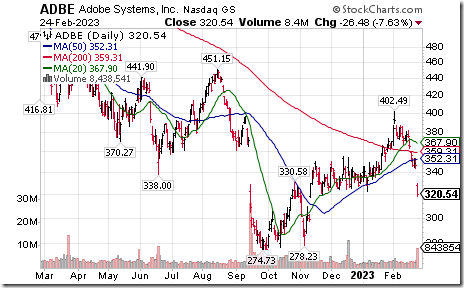
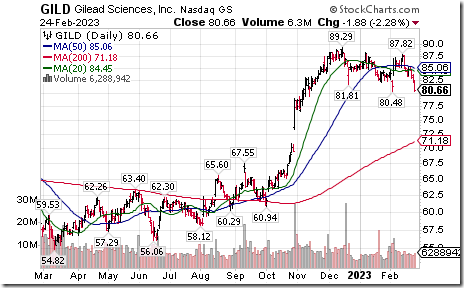
NASDAQ 100 stocks moving below intermediate support included Verisk Analytics $VRTX, Trip.com $TCOM, Adobe $ADBE, Intel $INTC and Gilead $GILD
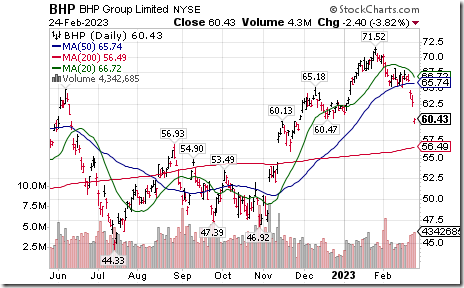
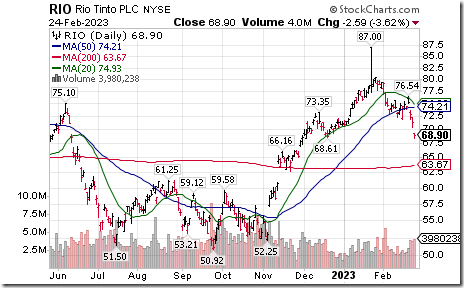
BHP $BHP and Rio Alto $RIO two of the world’s largest base metals producers moved below intermediate support
Links offered by valued providers
Michael Campbell’s Money Talks for February 25th
(Includes the interview with Don Vialoux0
Michael Campbell’s MoneyTalks – Complete Show (mikesmoneytalks.ca)
Mark Leibovit comment February 23 2023,
Ides of March and Market Madness – HoweStreet
Hammer And Nails: Homebuilders: Greg Schnell February 24, 2023
Hammer And Nails: Homebuilders | The Canadian Technician | StockCharts.com
Dave Keller says “Nothing good happens below the 200 day moving average”
Nothing Good Happens Below the 200-Day | The Mindful Investor | StockCharts.com
Looks Like a Major Shift in Leadership in the Energy Sector:
Julius de Kempenaer | February 24, 2023
Looks Like a Major Shift in Leadership in the Energy Sector | RRG Charts | StockCharts.com
Victor Adair’s Trading Notes for February 25th
https://victoradair.ca/trading-desk-notes-for-february-25-2023/
Bob Hoye’s weekly comment
Central Banks in No Position to “Have Your Back” – HoweStreet
Berkshire Hathaway’s holdings
Links from Mark Bunting and www.uncommonsenseinvestor.com
How Rich Companies Get Richer When the Going Gets Tough – Uncommon Sense Investor
Aggressively Investing to Grow & Protect the Moat – Uncommon Sense Investor
Best Blue Chip Stocks: 21 Hedge Fund Top Picks | Kiplinger
David Chapman and www.EnrichedInvesting.com Feb.27
https://enrichedinvesting.com/wp-content/uploads/2023/02/Inflation-bugaboo-Russia-bent-real-charts-teetering-equity-yields-up-debt-load-golden-languish-oil-poise.pdf
S&P 500 Momentum Barometers

The intermediate term Barometer dropped another 6.20 to 45.40 on Friday and plunged 19.20 last week to 45.40. It changed from Overbought to Neutral last week on a move below 60.00. Trend is down.
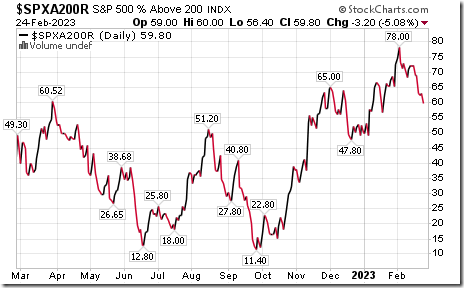
The long term Barometer dropped 3.20 on Friday and plunged 9.00 last week to 59.80.It changed on Friday from Overbought to Neutral on a move below 60.00. Trend is down.
TSX Momentum Barometers
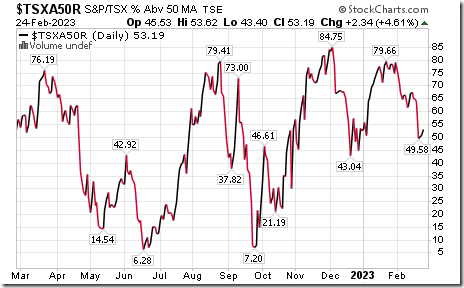
The intermediate term Barometer added 2.34 on Friday, but plunged 10.37 last week to 53.19. It changed from Overbought to Neutral on a move below 60.00. Trend remains down.
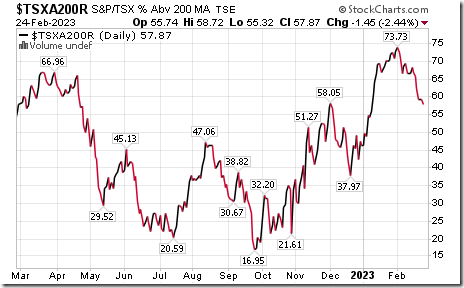
The long term Barometer slipped 1.46 on Friday and dropped 4.42 last week to 57.87. It changed last week from Overbought to Neutral on a drop below 60.00. Trend is down.
Disclaimer: Seasonality ratings and technical ratings offered in this report and at
www.equityclock.com are for information only. They should not be considered as advice to purchase or to sell mentioned securities. Data offered in this report is believed to be accurate, but is not guaranteed