
by Kristina Hooper, Chief Global Market Strategist, Invesco
Key takeaways
| A new paradigm? After a year of interest rate hikes, U.S. inflation appears to be coming down rapidly while the unemployment rate has been holding steady. |
The national conversation It’s time again for America’s least favourite pastime: Waiting to see if the U.S. Congress will raise the debt ceiling. |
In or out? What’s in and what’s out for 2023? I make the case for embracing alternative weighting methodologies, ditching market timing strategies, and more. |
Mercifully, it’s a new year. I found myself singing on New Year’s Eve, “should old inflation be forgot and never brought to mind?” It’s looking that way. Investors are, thus far, “tak(ing) a cup o’ kindness yet,” toasting and rejoicing in what appears to be a new paradigm for markets. After a year of interest rate hikes, U.S. inflation appears to be coming down rapidly while the unemployment rate has been holding steady. Has the U.S. Federal Reserve (Fed) managed a soft landing for the economy? A return to auld lang syne? Time will tell as monetary policy operates with a lag, but markets will take good news as it comes.
Speaking of which, let’s check in on the three key questions we ask every month …
A ‘keep It simple’ strategy
1) Where is the U.S. in the market cycle?
Lest we get too optimistic, it’s still late. The Fed gave 450 basis points of interest rate hikes in nine months — a historical amount of tightening in a very short time.1 But don’t forget: The market leads the economy, not vice versa. A 25.4% peak-to-trough decline in the S&P 500 Index from Jan. 3, 2022, to Oct. 13, 2022, is in line with past market declines associated with mild recessions.2
2) What’s the direction of the U.S. economy?
Financial markets are signaling recovery. Financial conditions have been easing3, driven by weakness in the U.S. dollar4, declining credit spreads, and improving equity returns5 led by the more cyclical parts of the global stock market.6 You may ask, a recovery from what? Largely, the fear that inflation would be persistent and interest rates would move ever higher.
3) What will be the Fed’s policy response?
The end of policy tightening is likely near. The 2-year U.S. Treasury rate, which tends to lead the fed funds rate, peaked at 4.72% in November and has since fallen by over 50 basis points.7
This recovery trade likely has legs, potentially through much of the first half of the year, at least. By then we should have greater insight on the impact of the Fed’s policy tightening on the economy. As they say, we make hay when the sun shines.
The U.S. debt ceiling
It’s time again for America’s least favourite pastime: Waiting to see if the U.S. Congress will raise the debt ceiling. In times like these, I always return to the immortal words of Winston Churchill (even though he may not have actually said them), “Americans always do the right thing, but only after exhausting all other options.”
1. Why does the U.S. keep doing this?
In 1917, Congress passed the Second Liberty Bond Act, which placed a statutory limit on total federal debt — which they call the debt ceiling. Raising the debt ceiling requires Congressional approval. (In 1917, the limit was $8 billion. Today it’s $31.4 trillion, which they hit on Jan. 19.)
2. Isn’t failure to raise the debt ceiling just the Congress reneging on commitments it’s already made?
Yes.
3. How have they handled it in the past?
Raising the debt limit used to be treated as a mere formality. Since 1960, Congress has acted 78 times to raise the debt limit — 49 times under Republican presidents and 29 times under Democratic presidents.8
4. What could be done if Congress doesn’t have enough votes to raise the debt ceiling?
Mint a trillion-dollar coin and deposit it at the Federal Reserve? Invoke the 14th Amendment which says, “the validity of the public debt…should not be questioned”? More likely, the Democrats will be forced to make concessions on future spending to entice six Republicans to vote with them to raise the debt limit.
5. How have markets responded to past debt ceiling drama?
In 2011, the stalemate around the debt ceiling was so troubling that one of the credit rating agencies downgraded U.S. debt. There was a quick and sharp market selloff that lasted from July to September of that year. It ultimately represented a buying opportunity. Market leadership was as one might expect during a period of pronounced policy uncertainty. The S&P 500 Index was down 15%, with the size and value factors underperforming the low volatility factor.9 Cyclical sectors underperformed defensive sectors.10 U.S. Treasuries and the U.S. dollar were (ironically?) treated as safe-haven investments.11 High yield bonds sold off.12 Gold rallied.13
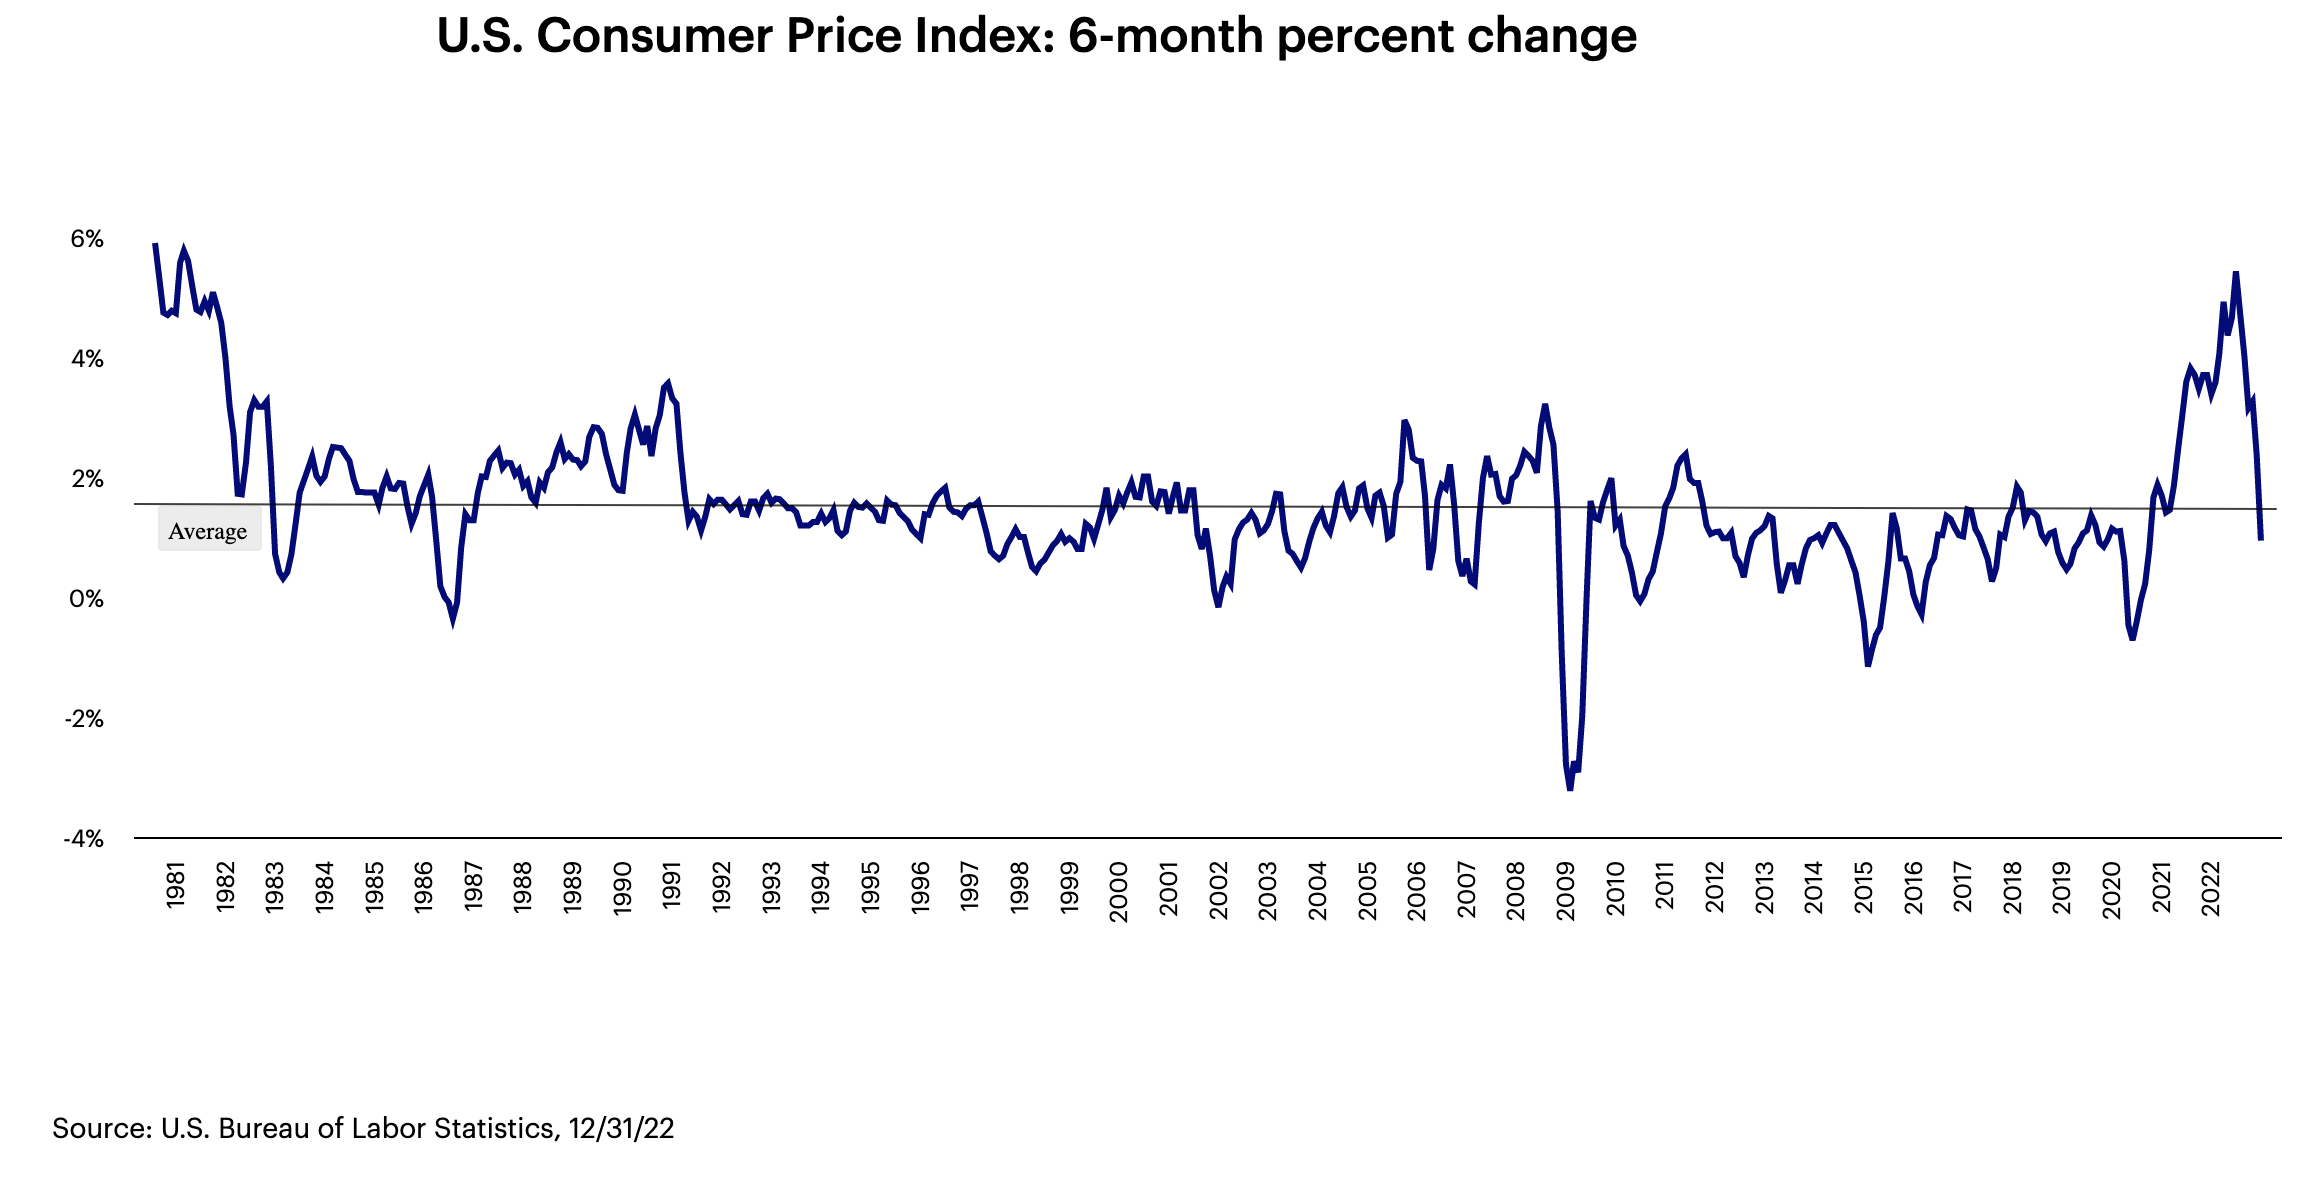
It may be confirmation bias, but U.S. inflation is falling …
… and it’s coming down faster than the naysayers predicted. Did anyone else notice that the much-maligned price of used cars and trucks fell by 8.8% over the past year?14 It’s not just used cars. The chart below shows the 6-month change in the U.S. Consumer Price Index.15 The reading is already below its multi-decade average! Was inflation transitory after all? I guess it depends on what your definition of transitory is.
 What’s in, What’s out?
Mangling the lyrics to “Auld Lang Syne” isn’t the only New Year’s tradition we’re marking this month. Here’s my attempt to sort out what’s in and what’s out for 2023 — the investing version.
• In: Alternative weighting methodologies
The S&P 500 Index, a market-cap weighted index, has tended to underperform other weighting methodologies, such as equal-weight, in the later stages of the U.S. economic cycle and the beginning of new cycles.16
• In: Credit
Remember when U.S. investment-grade corporate bonds and high yield bonds were only yielding 2% and 4%, respectively? That was so one year ago. Currently, investment-grade corporate bonds are yielding 5% while high yield bonds are yielding over 8%17, the latter generally in line with longer-term U.S. equity return assumptions. While a default cycle may be looming in the high yield space, investors appear to be being compensated for the risk.
• In: International investing
Strong dollar cycles tend to conclude with the end of Fed tightening.18 U.S.-based investors can potentially benefit from appreciating currencies overseas, as well as position themselves for the global economic recovery that tends to ultimately occur following tightening cycles.
• Out: Declaring the death of the 60/40 portfolio
This was a popular sentiment in 2022, fueled by the fact that bonds sank along with stocks and didn’t provide the type of diversification benefit investors expect. But as Mark Twain might say, rumours of its demise have been greatly exaggerated. The Bloomberg U.S. Aggregate Bond Index is yielding over 4.25%19 and will likely return to serving as ballast in portfolios should economic activity deteriorate meaningfully.
• Out: Growth-concentrated portfolios
Remember value investing? Value stocks have significantly outperformed growth stocks since the beginning of 2023.20 If history is an accurate guide, that trend should persist in a recovery.
• Out: Timing the market
I know. Timing the market will never be “out,” but we need to keep trying. Did you know that in 2022, five trading sessions accounted for more than 95% of the S&P 500 Index’s losses (Sep. 13, May. 18, Jun. 4, Apr. 22, and May. 5)?21 Admittedly, it was a tough spring. But how much tougher would it have been if you bailed from the market on May 18? The S&P 500 is up 3.7% from May 19, 2022, through the second week of January 2023.22
• Out: Me
At least that’s what my children tell me.
Since you asked
One of the more popular questions I’m fielding at the moment: Should investors take advantage of the yields at the short end of the U.S. Treasury yield curve or instead extend the maturity and duration of their fixed income portfolios?
I favour taking advantage of the bird in the hand. The 2-year Treasury is yielding over 4.15% and may rally as the Fed comes off its tightening stance.23 Long rates, on the other hand, have already rallied considerably. The 10-year rate peaked at 4.25% in mid-October and has already fallen by as much as 75 basis points to roughly 3.50%.24
At risk of being Eddie Mush, I hear that January returns are a good barometer for the year’s returns. I’m not a huge believer in these types of things, but an 86% success rate25 is one that I am at least willing to quote.
Footnotes
1 Source: U.S. Federal Reserve, 12/31/22. Based on the federal funds rate.
2 Source: Bloomberg. It is not yet known if Oct. 13, 2022, will prove to be the market trough of this cycle.
3 Source: Bloomberg, 1/17/23. Based on the Goldman Sachs U.S. Financial Conditions Index.
4 Source: Bloomberg, 1/17/23. Based on the U.S. Dollar Index.
5 Source: Bloomberg, 1/17/23. Based on the S&P 500 Index.
6 Source: Bloomberg, 1/17/23. Based on the performance of the MSCI World Cyclical Sectors Capped Index and the MSCI World Defensive Sectors Capped Index.
7 Source: Bloomberg, 1/18/23.
8 Source: U.S. Department of the Treasury, 12/31/22.
9 Source: Bloomberg. Performance listed is from July 2011 to September 2011. Size and value are represented by the Russell 2000 Index and the Russell 1000 Value Index, respectively. The low volatility factor is represented by the S&P 500 Low Volatility Index.
10 Source: Bloomberg. Performance listed is from July 2011 to September 2011. Cyclical and defensive stocks are represented by the MSCI USA Cyclical Sectors Index and MSCI USA Defensive Sectors Index.
11 Source: Bloomberg. Performance listed is from July 2011 to September 2011. U.S. Treasuries are represented by the Bloomberg US Treasury Index. The U.S. dollar is based on the performance of the U.S. Dollar Index.
12 Source: Bloomberg. Performance listed is from July 2011 to September 2011. High yields bonds are represented by the Bloomberg US Corporate High Yield Bond Index.
13 Source: Bloomberg. Performance listed is from July 2011 to September 2011. Gold is measured in price per troy ounce.
14 Source: U.S. Bureau of Labor Statistics, 12/31/22.
15 Source: U.S. Bureau of Labor Statistics, 12/31/22.
16 Source: Bloomberg and Invesco 12/31/22. Based on the relative performance of the S&P 500 Equal Weight Index and S&P 500 Index.
17 Source: Bloomberg, 1/17/23. Based on the yield to worst of the Bloomberg U.S. Aggregate Bond Index.
18 Source: Bloomberg. Based on the U.S. Dollar Index.
19 Source: Bloomberg, 1/17/23. Based on the yield to worst of the Bloomberg U.S. Aggregate Bond Index.
20 Source: Bloomberg, 1/17/23. Based on the performance since the start of the year for the Russell 1000 Growth Index (up 5.96%) and the Russell 1000 Value Index (up 8.51%).
21 Source: Bloomberg, 12/31/22. As represented by the S&P 500 Index.
22 Source: Bloomberg, 12/31/22. As represented by the S&P 500 Index.
23 Source: Bloomberg, 1/17/23.
24 Source: Bloomberg, 1/17/23.
25 Source: Bloomberg, 12/31/22. Based on S&P 500 returns from 1972-2022. In the years in which the S&P 500 Index was positive in January, the returns were positive for the year 86% of the time.
Copyright © Invesco