
by Dina Ting, CFA, Head of Global Index Portfolio Management, Franklin Templeton ETFs
Dina Ting, our Head of Global Index Portfolio Management, offers her perspective on the allure of multifactor US mid-capitalization strategies for 2023.
Many investors are happy to be moving on from the market volatility of 2022, which left a mere few good places to hide. Quite notably, however, exchange-traded funds (ETFs) drew impressive investor interest last year. Overall ETF usage marked a new annual record of over US$45 trillion in trading volume by the end of 2022—about US$10 trillion more than 2021’s haul.1 US ETF net inflows also reached nearly US$600 billion in 2022, with nearly US$38 billion in December.2
Following an extended winning streak for the large-cap US growth sector, big technology sector weakness led to much of the red seen in 2022, which may signal that a rotation is underway. In our analysis, while US small-cap stocks remain cheap, they may experience greater volatility and encounter lower liquidity amid interest rate hikes, especially should markets enter recessionary territory. Looking ahead, investors seeking consistent exposure to equities that may be able to better withstand turbulence than other asset classes may find it an ideal time to consider overlooked mid-cap stocks.
Why mid caps?
Hitting the so-called “sweet spot,” US mid caps—generally defined as companies with market capitalization between US$2 and US$10 billion—can offer faster growth prospects than large caps along with a lower risk profile than small caps.
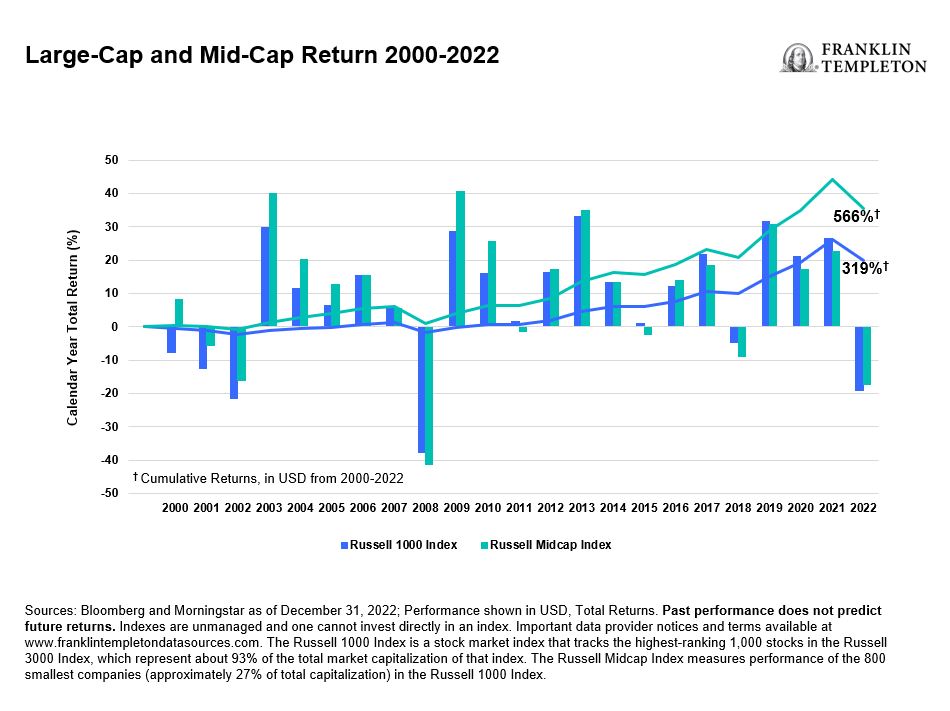
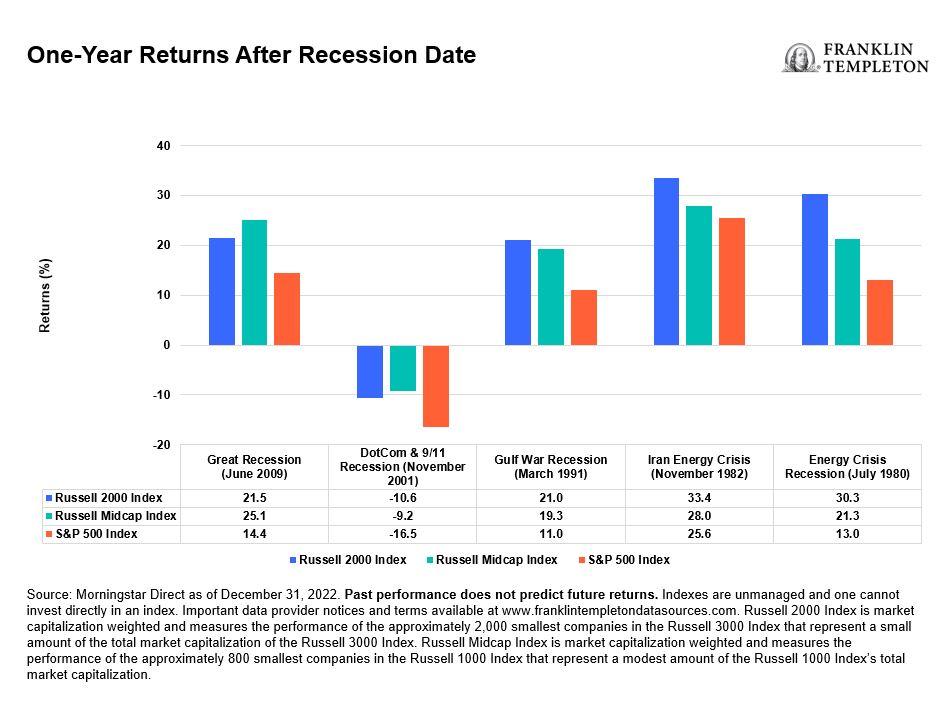
Mid caps also have a history of outperformance in periods following financial recessions. From 2003 until 2006, mid caps outperformed large-cap stocks for three consecutive years following the recession of the early 2000s. Looking at annual total return from 2009, mid caps similarly outperformed over four out of the five years after the global financial crisis. Not only did they also perform well compared to the small-cap segment post-recession, but the cumulative returns from the start of 2000 through December 2022 show the Russell Midcap Index far outpaced the large-cap Russell 1000 Index with returns of 598% versus 334%.3
Another added benefit of this sometimes-forgotten segment is diversification. Mid caps tend to be less impacted by currency fluctuations and global downturns than large caps, which often include major corporations and multinationals that operate around the world.
Investors also tend to be underallocated to mid caps. Based on overall market capitalization, we might expect funds to allocate three times as much to large caps compared to mid caps. However, investment in large-cap mutual funds and ETFs is about seven times more than that of their mid-cap peers.4 Market observers have lamented that US large caps have become even more concentrated, as they are dominated now by mega tech holdings.
At the end of 2022, technology sector holdings comprised 24% of the Russell 1000 Index, including 13.4% of the top 10 holdings in the index.5 Meanwhile, tech sector holdings in the Russell Midcap Index made up just half that at 12%, with tech representing just 1.5% of its top 10.6
Beyond the market-cap criteria, we believe that multifactor strategies can potentially deliver enhanced diversification with higher risk-adjusted returns and lower volatility than traditional market cap-based indexing. In our view, a forward-looking, rules-based index design that analyzes individual stock exposure against a well-vetted blend of factors—quality, value, momentum and low volatility—helps provide exposure to high-quality companies at a reasonable price while avoiding value traps.

As shown in the table above, the value factor—which emphasizes inexpensive stocks relative to their fundamentals—performed better than the broader market last year, with the S&P MidCap 400 Pure Value Index returning -3.6% against the S&P MidCap 400 Index, which was down about -13% for the year.7 By comparison, momentum stocks, which tend to show ongoing positive price trends, underperformed the most in 2022. Quality-tilted stocks, marked by profitable companies with capital efficiency and low volatility traits, together helped hedge against risks.
We believe a strategic combination of these factors can result in a smoother return profile, which should appeal to investors as we embark on another year of shifting market conditions.
*****
WHAT ARE THE RISKS?
All investments involve risks, including possible loss of principal. The value of investments can go down as well as up, and investors may not get back the full amount invested. Stock prices fluctuate, sometimes rapidly and dramatically, due to factors affecting individual companies, particular industries or sectors, or general market conditions. To the extent a strategy focuses on particular countries, regions, industries, sectors or types of investment from time to time, it may be subject to greater risks of adverse developments in such areas of focus than a strategy that invests in a wider variety of countries, regions, industries, sectors or investments.
ETFs trade like stocks, fluctuate in market value and may trade above or below the ETF’s net asset value. Brokerage commissions and ETF expenses will reduce returns. ETF shares may be bought or sold throughout the day at their market price on the exchange on which they are listed. However, there can be no guarantee that an active trading market for ETF shares will be developed or maintained or that their listing will continue or remain unchanged. While the shares of ETFs are tradable on secondary markets, they may not readily trade in all market conditions and may trade at significant discounts in periods of market stress.
Smaller, mid-sized and relatively new or unseasoned companies can be particularly sensitive to changing economic conditions, and their prospects for growth are less certain than those of larger, more established companies. Historically, these securities have experienced more price volatility than larger company stocks, especially over the short-term. Smaller companies may be more susceptible to particular events or economic conditions, less certain growth prospects, lack of depth of management and funds for growth and development and limited or less developed product lines and markets.
IMPORTANT LEGAL INFORMATION
This material is intended to be of general interest only and should not be construed as individual investment advice or a recommendation or solicitation to buy, sell or hold any security or to adopt any investment strategy. It does not constitute legal or tax advice. This material may not be reproduced, distributed or published without prior written permission from Franklin Templeton.
The views expressed are those of the investment manager and the comments, opinions and analyses are rendered as at publication date and may change without notice. The underlying assumptions and these views are subject to change based on market and other conditions and may differ from other portfolio managers or of the firm as a whole. The information provided in this material is not intended as a complete analysis of every material fact regarding any country, region or market. There is no assurance that any prediction, projection or forecast on the economy, stock market, bond market or the economic trends of the markets will be realized. The value of investments and the income from them can go down as well as up and you may not get back the full amount that you invested. Past performance is not necessarily indicative nor a guarantee of future performance. All investments involve risks, including possible loss of principal.
Any research and analysis contained in this material has been procured by Franklin Templeton for its own purposes and may be acted upon in that connection and, as such, is provided to you incidentally. Data from third party sources may have been used in the preparation of this material and Franklin Templeton (“FT”) has not independently verified, validated or audited such data. Although information has been obtained from sources that Franklin Templeton believes to be reliable, no guarantee can be given as to its accuracy and such information may be incomplete or condensed and may be subject to change at any time without notice. The mention of any individual securities should neither constitute nor be construed as a recommendation to purchase, hold or sell any securities, and the information provided regarding such individual securities (if any) is not a sufficient basis upon which to make an investment decision. FT accepts no liability whatsoever for any loss arising from use of this information and reliance upon the comments, opinions and analyses in the material is at the sole discretion of the user.
Products, services and information may not be available in all jurisdictions and are offered outside the U.S. by other FT affiliates and/or their distributors as local laws and regulation permits. Please consult your own financial professional or Franklin Templeton institutional contact for further information on availability of products and services in your jurisdiction.
CFA® and Chartered Financial Analyst® are trademarks owned by CFA Institute.
__________
1. Source: Bloomberg as of December 31, 2022.
2. Source: Morningstar as of December 31, 2022.
3. Source: Bloomberg as of December 30, 2022. Past performance does not predict future returns. Indexes are unmanaged and one cannot invest directly in an index. Important data provider notices and terms available at www.franklintempletondatasources.com. The Russell Midcap Index measures performance of the 800 smallest companies (approximately 27% of total capitalization) in the Russell 1000 Index. The Russell 1000 Index is a stock market index that tracks the highest-ranking 1,000 stocks in the Russell 3000 Index, which represent about 93% of the total market capitalization of that index.
4. Source: Morningstar as of December 31, 2022. Compares Morningstar large-cap blend/growth value categories vs. mid-cap blend/growth value categories.
5. Source: Bloomberg as of December 30, 2022.
6. Ibid.
7. Ibid. The S&P MidCap 400 Index serves as a gauge for the US mid-cap equities sector and is the most widely followed mid-cap index.