
Technical Notes
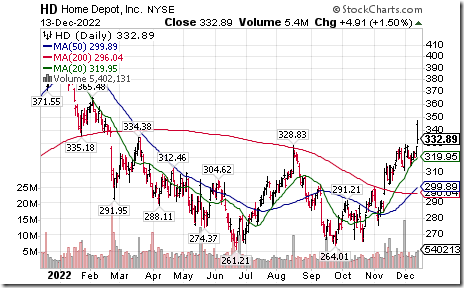
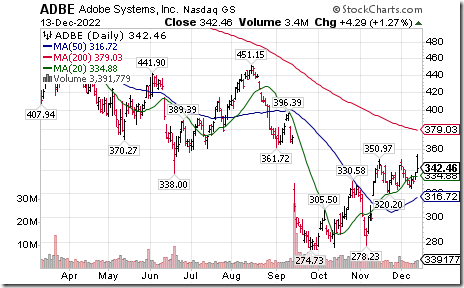
All of the upside technical action by broadly based U.S. equities occurred in the first hour of trading. S&P 100 stocks that extended intermediate uptrends included HD, ABT, DHR, EMR, IBM, ADBE and MA
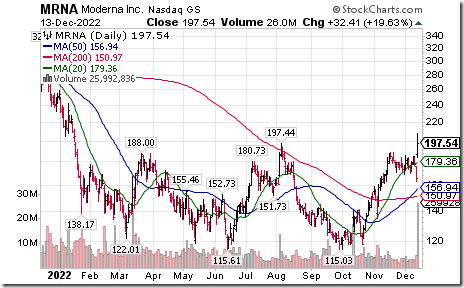
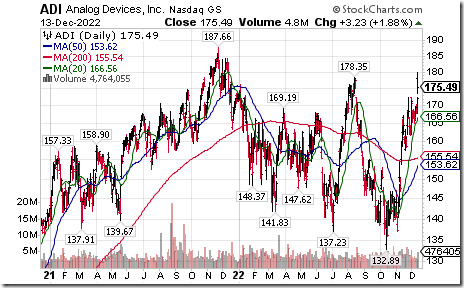
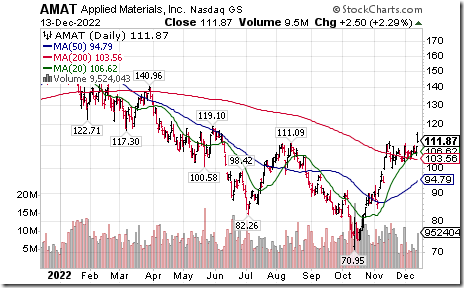
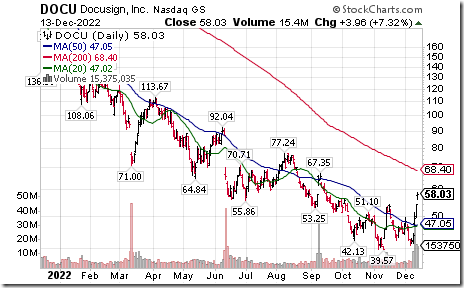
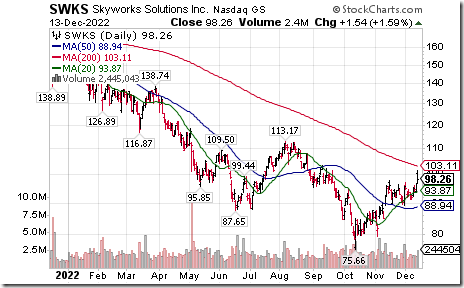
NASDAQ 100 stocks that extended intermediate uptrends included ADI, AMAT, DOCU, INTU, NXPI, SWKS, VRSN, MRNA, VRSK, ANSS
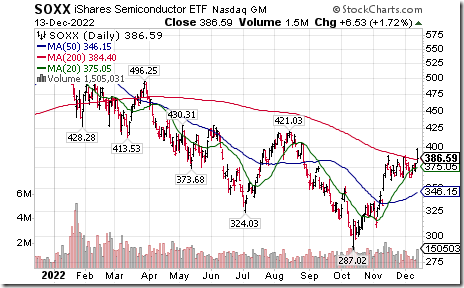
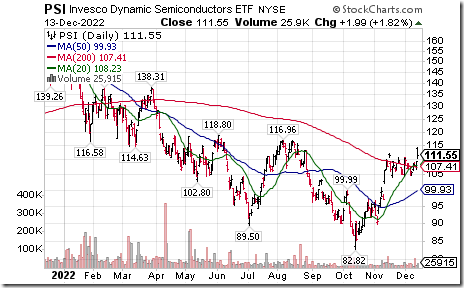
The technology sector led the advance in U.S. equity markets. Notable were breakouts by semiconductor ETFs: SMH, SOXX, PSI.
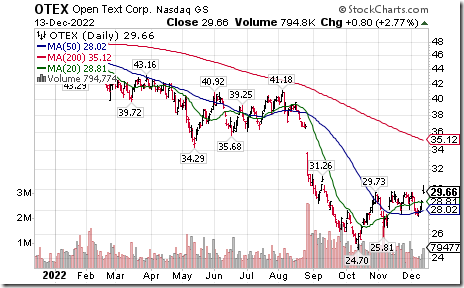
Canadian technology stocks and related ETFs (e.g.XIT.TO) also recorded strong technical action. Nice breakout by Open Text (OTEX) above US$29.73 completing a double bottom pattern!
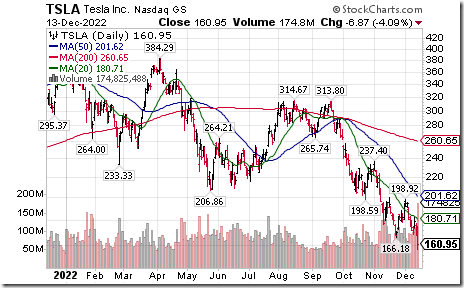
Tesla a NASDAQ 100 stock moved below $166.18 extending an intermediate downtrend.
Trader’s Corner
Equity Indices and Related ETFs
Daily Seasonal/Technical Equity Trends for December 13th 2022
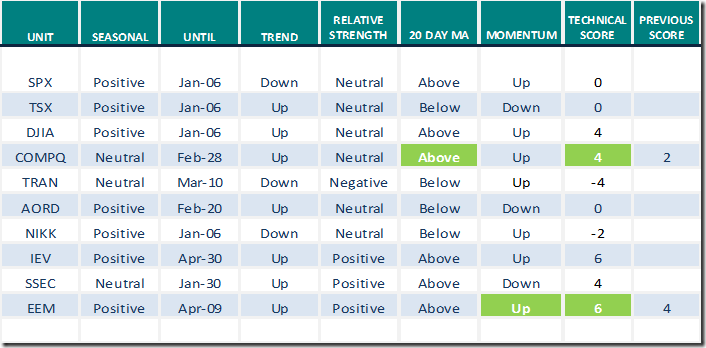
Green: Increase from previous day
Red: Decrease from previous day
Commodities
Daily Seasonal/Technical Commodities Trends for December 13th 2022
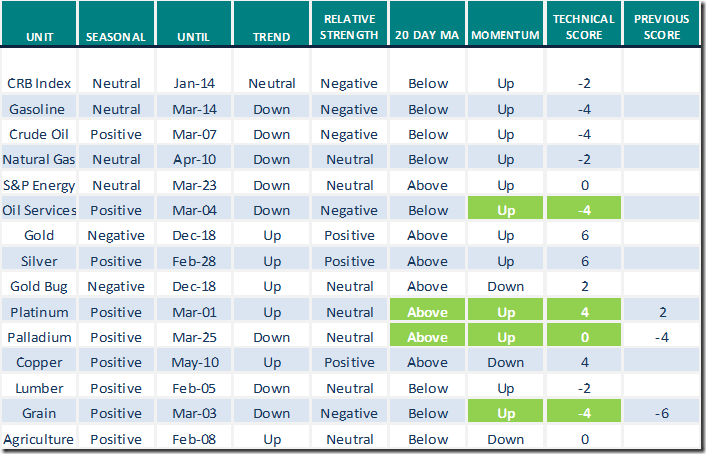
Green: Increase from previous day
Red: Decrease from previous day
Sectors
Daily Seasonal/Technical Sector Trends for December 13th 2021
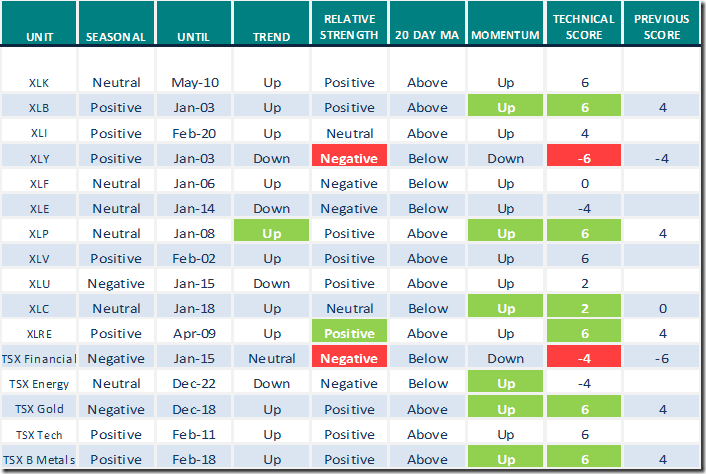
Green: Increase from previous day
Red: Decrease from previous day
Links offered by valued providers
Tom Bowley discusses significance of strength in the Technology sector.
Everyone Awaits Inflation Data | Tom Bowley | Trading Places (12.13.22) – YouTube
David Keller notes “Seasonality says strong December, weak January”
Seasonality Says Strong December Weak January | David Keller, CMT | The Final Bar (12.12) – YouTube
Seasonality Chart of the Day from www.EquityClock.com
Optimal time of the year to own the TSX 60 Index and its related ETF (XIU.TO) is from December 14th to March 7th.
iShares S&P/TSX 60 Index ETF (TSE:XIU.TO) Seasonal Chart
Arithmetic Average Seasonal Chart
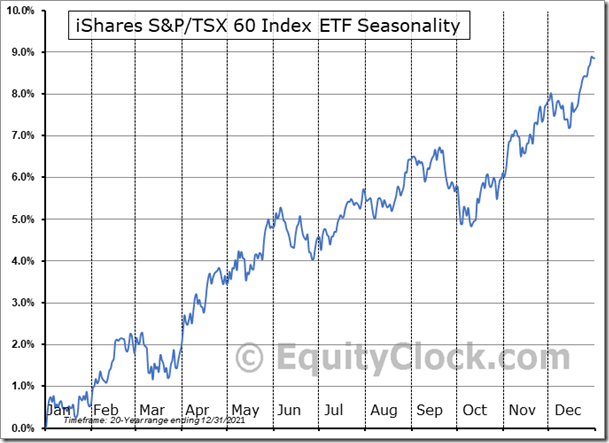
Seasonal Chart Analysis
Analysis of the iShares S&P/TSX 60 Index ETF (TSE:XIU.TO) seasonal charts above shows that a Buy Date of December 14 and a Sell Date of March 7 has resulted in a geometric average return of 2.43% above the benchmark rate of the S&P 500 Total Return Index over the past 20 years. This seasonal timeframe has shown positive results compared to the benchmark in 16 of those periods. This is a very good rate of success and the return strongly outperforms the relative buy-and-hold performance of the stock over the past 20 years by an average of 4.08% per year.
S&P 500 Momentum Barometers
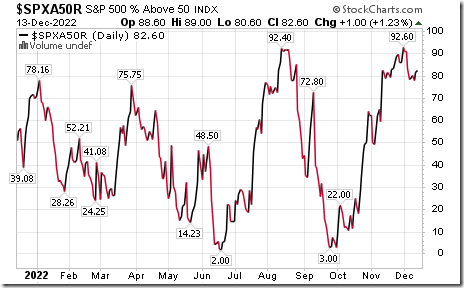
The intermediate term Barometer added 1.00 to 82.60. It remains Overbought.
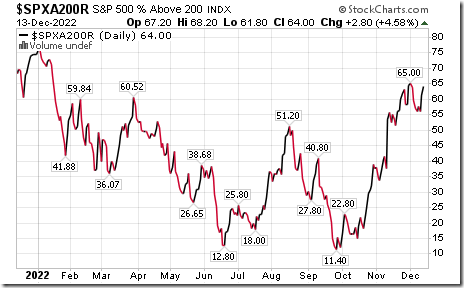
The long term Barometer added 2.80 to 64.00. It remains Overbought.
TSX Momentum Barometers
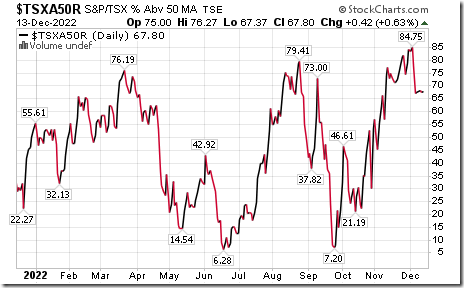
The intermediate term Barometer added 0.42 to 67.80. It remains Overbought.
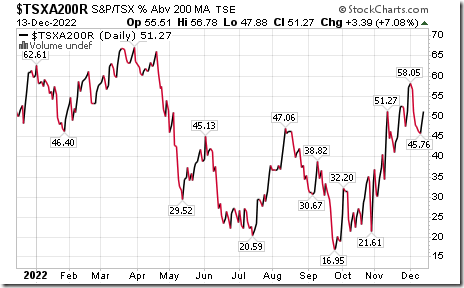
The long term Barometer gained 3.39 to 51.27. It remains Neutral.
Disclaimer: Seasonality ratings and technical ratings offered in this report and at
www.equityclock.com are for information only. They should not be considered as advice to purchase or to sell mentioned securities. Data offered in this report is believed to be accurate, but is not guaranteed