
Technical Notes
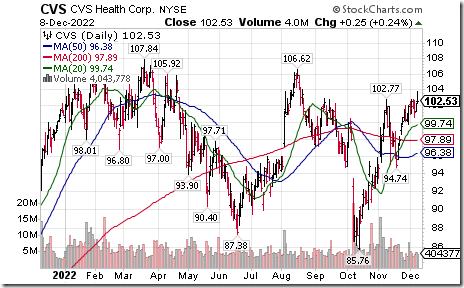
CVS Health an S&P 100 stock moved above $102.77 extending an intermediate uptrend.
Regeneron $RGEN a NASDAQ 100 stock moved above $769.63 to an all-time high extending an intermediate uptrend.

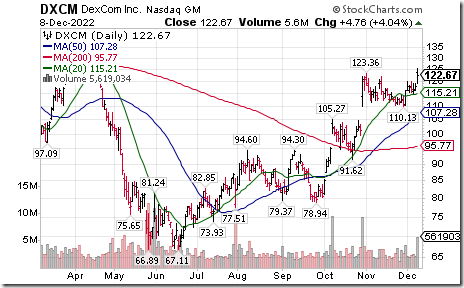
DexCom $DXCM a NASDAQ 100 stock moved above $123.36 extending an intermediate uptrend.
Vertex Pharmaceuticals $VRTX moved above $323.61 to an all-time high extending an intermediate uptrend.

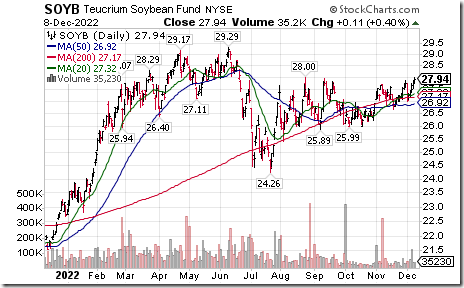
Soybean ETN $SOYB moved above $28.00 extending an intermediate uptrend.
Loblaw Companies $L.TO a TSX 60 stock moved above $124.33 to an all-time high extending an intermediate uptrend.

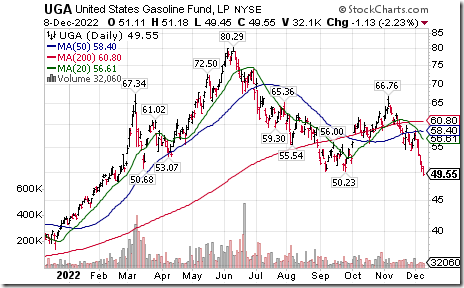
Gasoline ETN $UGA moved below $50.23 extending an intermediate downtrend.
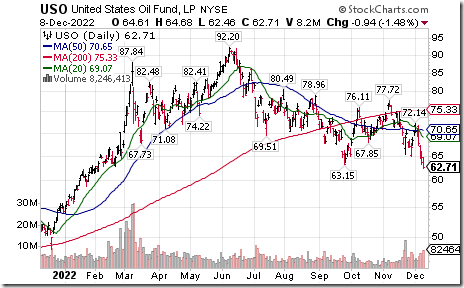
Crude Oil ETN $USO moved below $63.15 extending an intermediate downtrend.
Trader’s Corner
Equity Indices and Related ETFs
Daily Seasonal/Technical Equity Trends for December 8th 2022

Green: Increase from previous day
Red: Decrease from previous day
Commodities
Daily Seasonal/Technical Commodities Trends for December 8th 2022
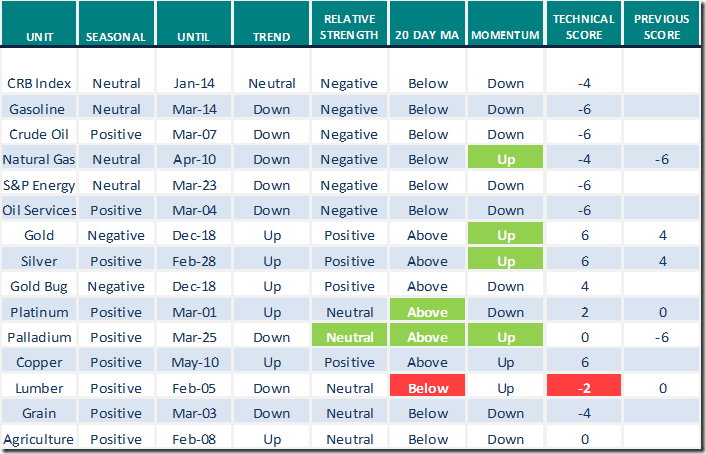
Green: Increase from previous day
Red: Decrease from previous day
Sectors
Daily Seasonal/Technical Sector Trends for December 8th 2021
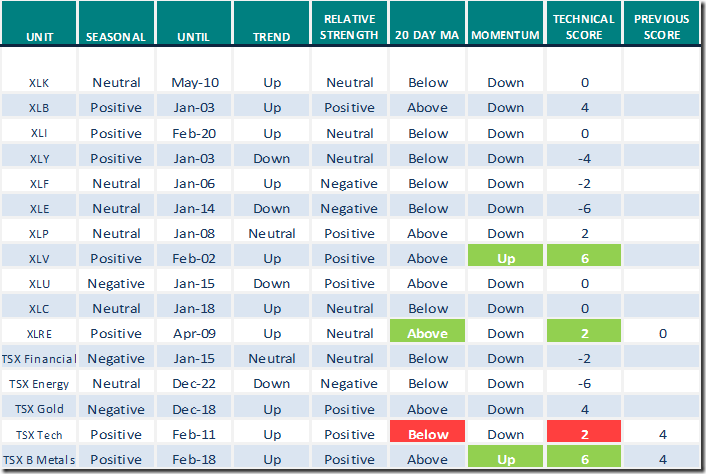
Green: Increase from previous day
Red: Decrease from previous day
Links offered by valued providers
Sprott Monthly Report: Includes an interesting study on seasonal gold buying by India, China and central banks
Sprott Monthly Report: Gold Higher After Peak Fed Hawkishness
Market Buzz from Greg Schnell
Banks Are Latching Down The Hatches | Greg Schnell, CMT | Market Buzz (12.08.22) – YouTube
Tom Bowley says “S&P 500 clinging to support”.
S&P 500 Clinging To Support | Tom Bowley | Trading Places (12.08.22) – YouTube
Seasonality Chart of the Day from www.EquityClock.com
iShares Core S&P/TSX Capped Composite Index ETF (TSE:XIC.TO) Seasonal Chart
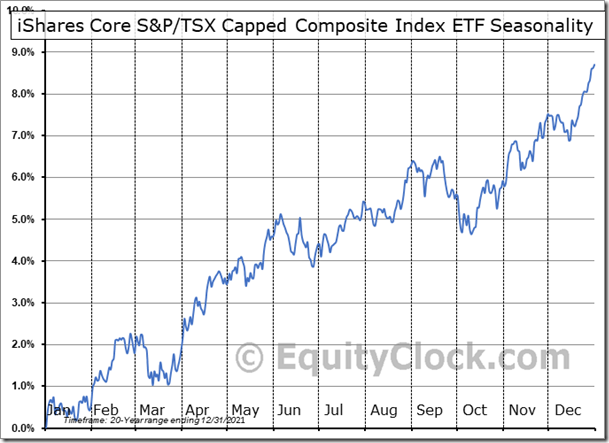
Seasonal Chart Analysis
Analysis of the iShares Core S&P/TSX Capped Composite Index ETF (TSE:XIC.TO) seasonal charts above shows that a Buy Date of December 8 and a Sell Date of March 7 has resulted in a geometric average return of 2.66% above the benchmark rate of the S&P 500 Total Return Index over the past 20 years. This seasonal timeframe has shown positive results compared to the benchmark in 16 of those periods. This is a very good rate of success and the return strongly outperforms the relative buy-and-hold performance of the stock over the past 20 years by an average of 4.55% per year.
Editor’s Note: Favourable seasonal influences are closely correlated with the period when individuals receive yearend bonuses and subsequently invest funds into tax efficient programs before the beginning of March (e.g. RRSPs TSFAs).
S&P 500 Momentum Barometers

The intermediate term Barometer added 1.20 to 80.40. It remains Overbought.
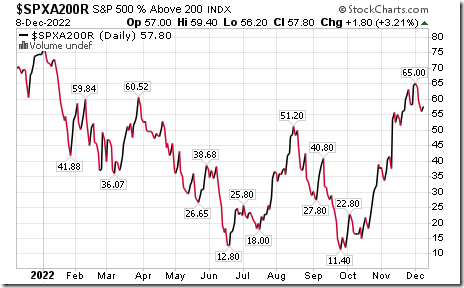
The long term Barometer added 1.80 to 57.80. It remains Neutral.
TSX Momentum Barometers
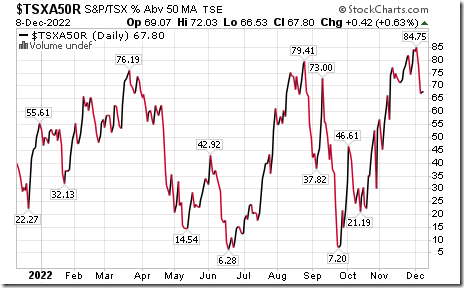
The intermediate term Barometer added 0.42 to 67.80. It remains Overbought.
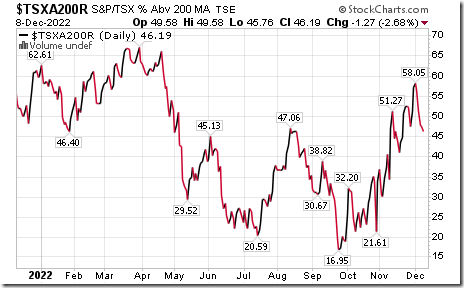
The long term Barometer slipped 1.27 to 46.19. It remains Neutral.
Disclaimer: Seasonality ratings and technical ratings offered in this report and at
www.equityclock.com are for information only. They should not be considered as advice to purchase or to sell mentioned securities. Data offered in this report is believed to be accurate, but is not guaranteed