
by John Lynch, Chief Investment Officer, Comerica Wealth Management
2023 Market Outlook
Executive Summary
The past year in the financial markets has been characterized by soaring
inflation, slowing economies, and tighter monetary policy. Consequently, market interest rates climbed, and equity markets weakened considerably, particularly securities in the growth and technology areas that are heavily dependent on low discount rates.
In 2023, we envision an environment of moderating, but persistent price
pressures that will keep monetary policymakers on a steady, but less aggressive, tightening path. Fixed income investors likely have seen the worst of price depreciation and can now look for improved yields to contribute to total return. The equity markets will likely transition their attention from P/E multiple contraction to margin erosion and a decline in profit forecasts.
A few scenarios could result, yet our base case calls for mild recession early in the year, steady market interest rates, a retest of the October lows (~3,500) in the S&P 500® Index, before investors price in a policy response and begin discounting recovery in late 2023 and early 2024. This scenario should experience flat profits in 2023 and expectations of 5.0% earnings gains in 2024, and we would view the S&P 500® as fairly valued within the range of 4,100-4,200 within the next twelve months.
In this 2023 Market Outlook, we take a look at the drivers for the financial markets and our portfolio positioning, including: Policy (Fed over fiscal), Economy (inflation over demand), Fixed Income (quality over high yield), Equities (value over growth), Global (domestic over international), and Currencies & Commodities (it’s all about the U.S. dollar).
We hope the detailed insights provide you with a degree of clarity and reinforce the necessity to adhere to long-term strategic allocations within diversified portfolios. Remember our belief that for successful investing, it’s about “time in” the markets vs. “timing the markets!”
Policy
After all the anticipation about the midterm elections, the outcome was much less impactful than investors anticipated. The Republicans gained a very slim majority in the House, while the Democrats are looking to build on the slimmest of majorities in the Senate at the conclusion of Georgia’s runoff vote. Considering narrow margins for each party, it appears investors are not looking for material developments in fiscal policy initiatives that would significantly alter economic or market activity.
It is important to note, however, that the lame duck session over the next several weeks may prove consequential, to the degree that deficit spending further elevates inflation and interest rates. Higher debt service costs going forward can crowd out other fiscal discretionary spending initiatives, potentially limiting the ability of legislators to support economic growth.
Therefore, the ability of this Congress to finalize spending bills and debt ceiling limits could reduce the risks for a pattern of fiscal cliffs and government closures over the next two years.
Fortunately, history has shown that Year 3 of the Presidential Cycle offers investors hope, with favorable trends supporting economic activity, monetary accommodation, and market performance, with the S&P 500® Index up by an average of 16.8%. Considering the many challenges in the current global environment, though, we suspect that next year may prove an exception to the rule. See chart: Presidential Cycle with S&P 500® Performance.
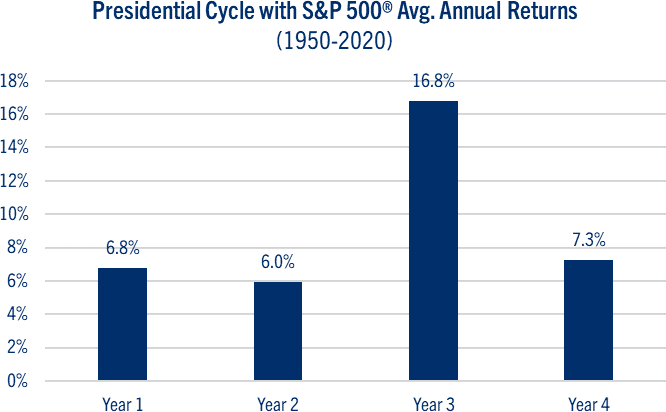
Source: Strategas Research Partners
Indeed, monetary policy is no longer in the position to enable fiscal legislation, and we look for the Federal Reserve to play a larger role once again for the financial markets in 2023.
After the most recent monetary policy meeting on November 2nd, the Federal Reserve announced a highly anticipated fourth consecutive 75 basis point interest rate increase, bringing the Fed Funds target range to 3.75% to 4.00%. This is the highest level since 2008, with expectations for an additional 100 basis points in the coming months. Moreover, Fed Chair Jerome Powell intensified his message to the financial markets, indicating that while the magnitude of future rate hikes may be smaller, interest rates will likely remain higher, and for longer, than market expectations are currently pricing. See chart: Fed Funds Futures.
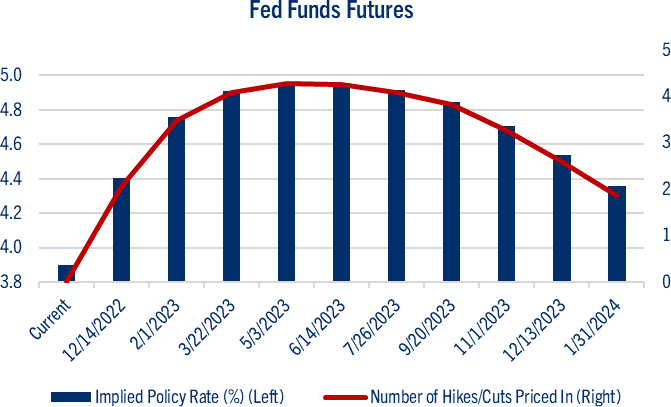
Source: Bloomberg L.P.
We believe the combination of persistent inflation and a history of policy miscues will result in elevated market interest rates as the Federal Reserve is loath to repeat the mistakes of the 1970’s, when it pivoted too early, and too often, resulting in even worse macroeconomic conditions. Supply has not been able to meet demand, so monetary officials are left with the difficult task of reducing demand to meet supply.
Economy
The past year proved somewhat of an enigma in economic analysis, as real GDP contracted in the first half of 2022, despite a solid combination of full employment, near record household cash levels, and strong corporate balance sheets. To be sure, the unwinding of emergency pandemic-related policy spending altered the trajectories for supply and demand, intensifying volatility in the economy and the financial markets.
After the weak start to the year, the U.S. economy expanded at an annualized rate of 2.9% during the third quarter. Signs of a looming slowdown were evident, though, as consumer spending and business investment weakened due to high inflation and rising market interest rates. Housing prices have been weakening and consumer confidence has declined in each of the past two months.
Economic Forecasts 2021 2022 2023 U.S. Real GDP 5.9 1.7 0.1 Consumer Price Index 4.7 8.1 4.0 Unemployment Rate 5.4 3.7 4.5 10-Year U.S. Treasury Note 1.44 2.97 3.73
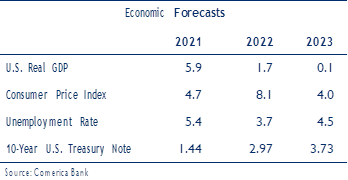
Source: Comerica Bank
Comerica Bank Chief Economist Bill Adams notes that these trends have weakened prospects for economic growth with the balance of risks pointing downward. He projects GDP growth of just 1.7% for this year with a decline in output these next two quarters and a gain of just of 0.1% in GDP for 2023. See chart: Economic Forecasts.
Inflation remains high, as the Consumer Price Index (CPI) climbed 7.7% on a year over year (YOY) basis in October. The core reading of 6.3% YOY indicates that price pressures are broadening beyond food and energy costs, and the trends for wages, housing/ rents, and energy remain “sticky.” After an energy related spike this winter, and the decline in money supply growth, we look for inflationary pressures to moderate from peak levels as the year progresses. See chart: Consumer Price Index.
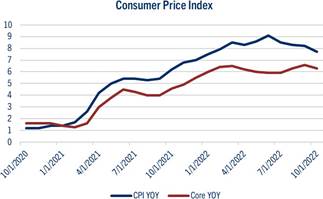
Source: Bloomberg L.P.
On the surface, employment growth looks solid, as the U.S. economy created 261,000 jobs and the unemployment rate came in at 3.7% in October. Yet, trends are moderating, as the three-month rate of
+289k jobs is well below the pace of +539k during the same period last year. We look for the unemployment rate to climb to 4.4% next year, and history suggests a move of this magnitude is consistent with previous recessionary periods.
Fixed Income
After a 40+ year bull market in bonds, investors endured a difficult 2022 due to the painful combination of surging inflation, slowing economic growth, and tighter monetary policy. Indeed, the broadest domestic measure of the fixed income markets, the Bloomberg Aggregate Bond Index, declined ~14.0% YTD through November, its worst showing since 1976.
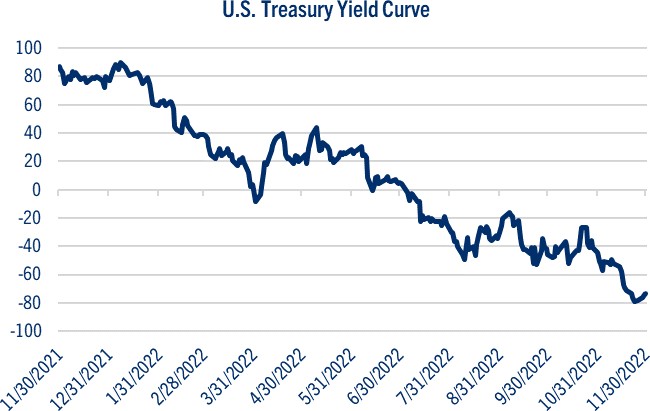
The dramatic increase in market interest rates was fueled by the Federal Reserve’s aggressive campaign to thwart inflation and restore price stability. Consequently, the yield on the benchmark 10-year U.S. Treasury note jumped from approximately 1.50% at the start of 2022 to a peak of ~4.20% in October, before moderating in recent weeks. Moreover, the yield on the 2-year U.S. Treasury bill, which is more sensitive to changes in monetary policy, also climbed from ~0.75% in January to ~4.50% currently. See chart: Yield Curve.
Source: Bloomberg L.P.
This surge in market interest rates caused the inversion of the U.S. Treasury yield curve to intensify, with the spread widening by more than 70 basis points since last spring. While there is a growing chorus of benign interpretations of this inversion – signaling the Fed’s victory over inflation with imminent rate cuts - history has shown little ambiguity in the relationship between yield curve inversions and recessions in the U.S. In our view, the bond market continues to display more consistency in its caution about the global macro-economic environment than other financial assets.
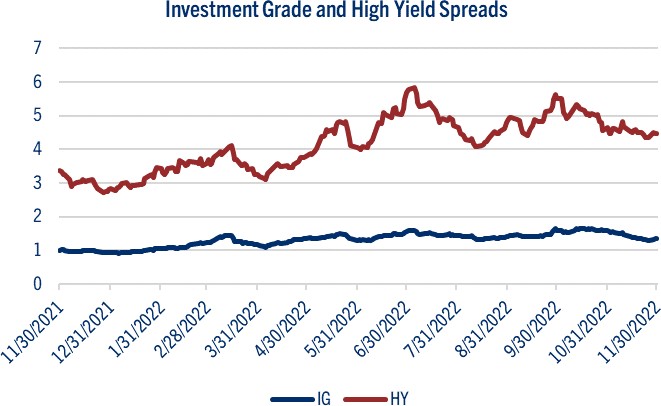
It should be noted that despite the volatility in market interest rates, corporate credit spreads have held up relatively well this year. The interest rate differentials between investment grade and high yield corporate bonds relative to the benchmark 10- year U.S. Treasury note largely held within their bands prevalent over the past 25 years. See chart: Corporate Investment Grade and High Yield Spreads.
Source: Bloomberg L.P.
We view this as an encouraging sign during a dismal year, as fixed income markets point toward confidence in the ability of corporations to withstand challenging conditions. After enduring a volatile start to 2023, we look for market interest rate volatility to settle down, with the yield on the benchmark 10- year Treasury finishing the year in the 3.75% range.
Given this backdrop, our fixed income positioning favors quality, with investment grade corporate bonds offering a combination of relative valuation and income. The current volatility in bond yields leads us to take interest rate risk on corporate credit over government bonds, as these securities offer quality ratings and strong balance sheets. We encourage investors not to get caught up in the pursuit of higher yielding bonds, though, as these credits often mask.
Fixed Income (continued)
We remain cautious on longer-term U.S. Treasuries in the coming months as persistently high inflation will likely lead to further volatility as investors demand a higher-term premium. We believe shorter- dated U.S. Treasuries, however, are closer to pricing in a peak for policy rates and offer relatively attractive income opportunities.
In the municipal bond space, we also favor investment grade over high yield offerings, particularly given their attractive tax-equivalent yields. The market for mortgage-backed securities, however, faces further challenges due to the combination of a tighter Fed, rising mortgage rates, a slowdown in housing, and the end of monetary support.
After a difficult year for bonds, we encourage investors to focus on quality and to look for coupons to contribute to total return as the worst stages of price depreciation appear behind us.
Equities
The equity markets struggled in 2022 as the combination of surging inflation, reactive monetary policy, weak economic growth, geopolitical tensions, and rising market interest rates weighed on investor sentiment and pressured stock valuations.
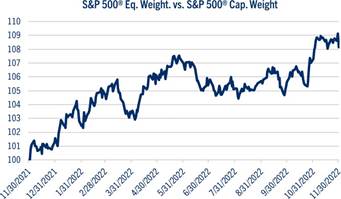
Higher market interest rates affected the discounting of future earnings growth, which weighed heavily on the most expensive names in growth and technology, areas that propelled the stock market higher over the past decade. As the year progressed, we therefore witnessed improved performance of the “average stock” as the equal- weighted S&P 500® gained traction on the more popular cap-weighted S&P 500®, whose performance is driven by the largest names in the index. See chart: SPW vs. SPX.
Source: Bloomberg L.P.
Market Technicals
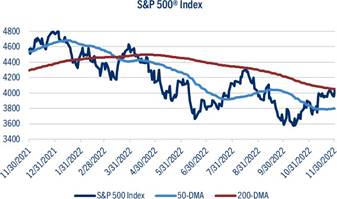
A unique characteristic of the past year was that the equity market peaked on just the second trading day in January, before slipping into a bear market by midyear. As with previous bear markets, volatility accelerated with massive selloffs and intraday market swings. It should be noted that history has shown a tendency for the S&P 500®’s biggest rallies to occur below the index’s 200-day moving average (DMA), often in a triumph of hope over reality. To be sure, the typical bear market rally has seen the index climb by an average of ~15.0% over a period of about two months, and we’ve experienced two of these countertrend moves since the equity market lows in June. See chart: S&P 500® Index.
Source: Bloomberg L.P.
Perhaps the most frequently asked question we’ve received from clients is whether a definable low for the equity market has occurred. We are of the opinion that for a true low to be achieved, it must be successfully tested, thereby forming a “double bottom.” For example, the S&P 500® hit a low of
~3,640 in the middle of June before entering a bear market rally. Trends reversed in late-August and through September, before failing to hold the June low on the last day of trading in the third quarter. In mid-October, during yet another session of intraday volatility, the Index hit an intraday low of ~3,500 before rallying impressively and embarking on the year’s second bear market rally.
Equities (continued)
Unfortunately, despite the recent equity market gains, we believe the October lows must be retested for technical confirmation of a cycle low. For a classic “double bottom” to form, we look for the 3,500 range to act as the next level of major technical support for the S&P 500®, as it represents the 50.0% retracement of the Index’s March 2020 low (~2200) and the January 2022 high (~4800).
Market Fundamentals
The past year has witnessed a dramatic move lower in the average price-to-earnings (P/E) ratio for the equity market. Higher market interest rates reduce the value of longer duration equities, which are dependent on low discount rates. Indeed, at the start of 2022, the S&P 500® was trading at 23x consensus earnings per share (EPS) forecasts, before declining to 16x as market interest rates accelerated higher in the third quarter, and has recently been trading near 18x. See chart: S&P 500® P/E.
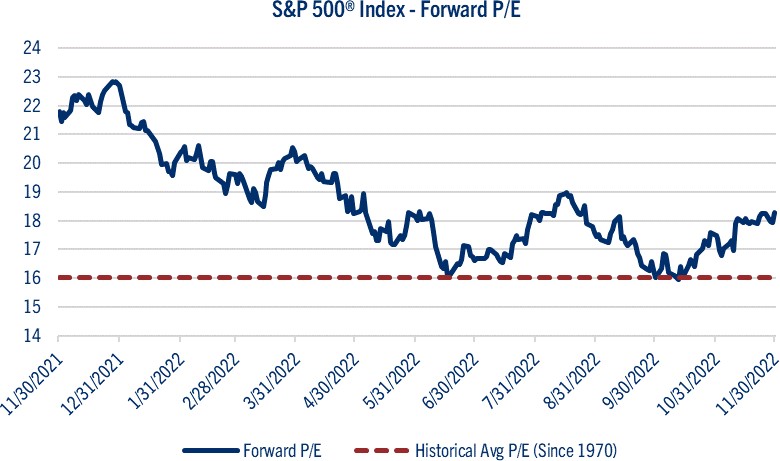
Source: Bloomberg L.P.
Given that the equity market addressed its valuation concerns through P/E contraction in 2022, we suspect next year will prove the comeuppance for corporate operating margins and EPS. To be sure, operating margins for companies in the S&P 500® have hovered near historic highs (>12.0%) in recent years, and we suspect the combination of higher wages, rising debt service costs, and elevated energy prices will conspire against operating earnings leverage in 2023.
As a reminder, last September we lowered our 2023 forecast in S&P 500® profits to $225.00, representing the potential for flat EPS next year. A P/ E ratio of 17x suggests the Index is currently fairly valued in the 3,825 range. See chart: S&P 500® EPS.
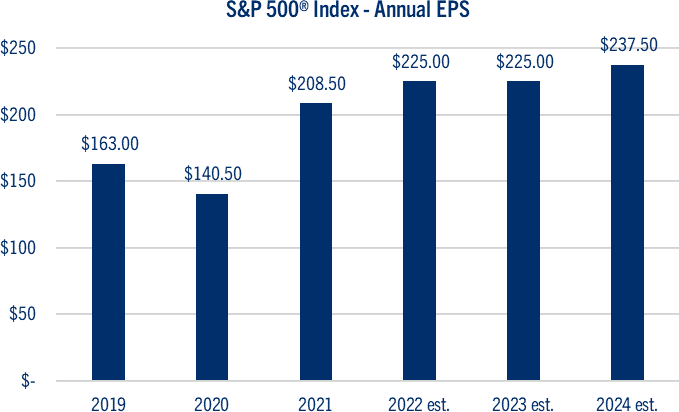
Source: FactSet: Comerica Wealth Management
Of course, a few scenarios can play out in 2023.
Our base case calls for a mild recession in the first half of the year, as full employment, household cash levels, and solid corporate balance sheets help minimize the damage more typically associated with economic downturns. In this case, we look for the October lows to be retested before the Federal Reserve ends its tightening campaign by midyear. At that point, equity investors will be looking to price in recovery for 2024, where we introduce a preliminary EPS forecast of $237.50, representing EPS growth potential of approximately 5.0%. As investors weigh the potential for Fed accommodation and economic renewal in the second half, we suspect a P/E of 17x- 18x our 2024 EPS forecast would have the S&P 500® fairly valued in the 4100 - 4,200 range by yearend 2023.
Equities (continued)
Should global conditions worsen and a deeper recession, or hard landing ensues it’s conceivable that S&P 500® profits decline to the $200.00 range in 2023. In this scenario, we do not expect technical support to hold at 3,500 for the S&P 500. Instead, we view a more typical recession-like P/E multiple of 15x to result, therefore taking the Index down to the 3,000 range. As the recession unwinds with a policy response, we suspect investors would begin pricing in a recovery for 2024 with a reduced Index EPS estimate of ~$220.00, leading to a fairly valued Index in the range of 3,800-3,900 by December 2023. See chart: 2023 Potential Scenarios.
Scenarios Base Case Hard Landing Soft Landing Probability 65% 25% 10% 2024 S&P 500® EPS Est. 237.5 220 237.5 Forward P/E Multiple 17-18x 17-18x 20x YE ‘23 S&P 500® Fair Value 4100-4200 3800-3900 4700-4800 Source: Comerica Wealth Management Scenarios Base Case Hard Landing Soft Landing Probability 65% 25% 10% 2024 S&P 500® EPS Est. 237.5 220 237.5 Forward P/E Multiple 17-18x 17-18x 20x YE ‘23 S&P 500® Fair Value 4100-4200 3800-3900 4700-4800
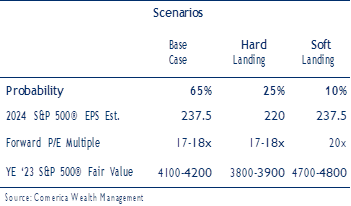
Source: Comerica Wealth Management
Of course, the Fed could successfully engineer a soft
-landing scenario, whereby profits could remain essentially flat, but market interest rates decline, and P/E multiples expand. In this case, it’s possible that the S&P 500® could test its 2022 highs in the second half of the year. As encouraging as this scenario sounds, we believe it remains the least likely to materialize.
Portfolio Positioning
Given our base case, the mild-recession scenario, as well as the possibility for a hard landing scenario, it is important for investors to remain cautious and not get too aggressive during bear market rallies. We anticipate heightened market volatility in the months and quarters ahead until the market gets comfortable with the potential for peaks in market interest rates, the dollar, and monetary policy along with troughs in GDP, P/Es, and EPS.
In positioning equities within diversified portfolios, we continue to favor value over growth, and domestic over international. Within small caps, we prefer benchmark allocations, but with an emphasis on quality and profitability. The value space offers short duration equities, which are less impacted by market interest rates and can be found in the Industrials, Materials and Financial Services sectors. In addition, we continue to embrace a barbell risk sector strategy emphasizing Energy and Health Care.
Global
Around the world this past year, economies and financial markets have been hamstrung by slowing growth, rising inflation, and the strong U.S. dollar. The war in Ukraine, lockdowns in China, and political uncertainty/instability have further weighed on economic output and the financial markets.
Indeed, as the risks to growth have accelerated, forecasts for the global economy have declined. The International Monetary Fund recently reduced its projections for global GDP, indicating that growth would transition from 6.0% in 2021 to 3.2% in 2022 and 2.7% in 2023. See chart: Global Economic Forecasts.
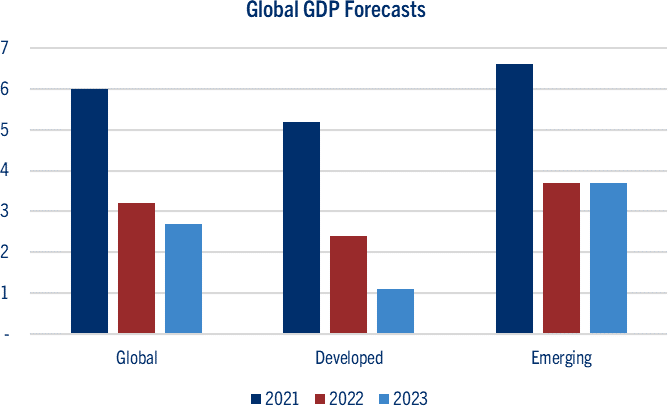
Source: International Monetary Fund
Global inflation is projected to rise from 4.7% in 2021 to 8.8% this year, before decelerating to a still alarming print of 6.5% in 2023. We believe risks to the outlook increase as policy paths diverge in advanced economies, and dollar strength continues to pressure emerging markets.
Developed markets are struggling to address inflation. The European Central Bank (ECB) recently increased its target for the Deposit Facility Rate (Fed Funds equivalent) by 0.75% to 1.5%, yet it remains woefully below the raging 9.9% inflation rate recorded for the 19 member ECB bloc at the end of the third quarter. The Bank of Japan, on the other hand, continues to target accommodation through yield curve control, despite rising inflation and the global market’s assault on the weakening yen.
Weakness in China has been evident in a variety of indicators, including exports, retail sales, industrial production, and property values. Beijing has made a few attempts to support demand, but more lockdowns, rising Covid 19 cases, and the recent protests threaten the outlook for emerging economies. See chart: Global Equity Market.
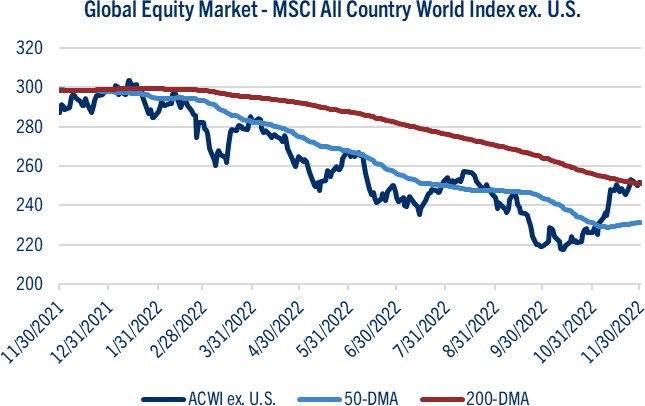
Source: Bloomberg L.P.
As a result, global financial markets have struggled this year, with the MSCI All Country World Index (ex. U.S.) down ~15.0% YTD. We continue to underweight international relative to domestic equities in our portfolios and look for this dynamic to persist until inflation growth, and dollar strength, subside.
Currencies and Commodities
The U.S. dollar was very strong this year, with the trade-weighted basket index (DXY) enjoying gains of approximately 15% through the third quarter. Yet, the October CPI Report showed a slight deceleration in pricing pressures, leading to a sell-off in the greenback and igniting a bear market rally in global equities and other risk assets. As of this writing, the DXY has given up about half its YTD gains achieved through the third quarter. See chart: DXY.
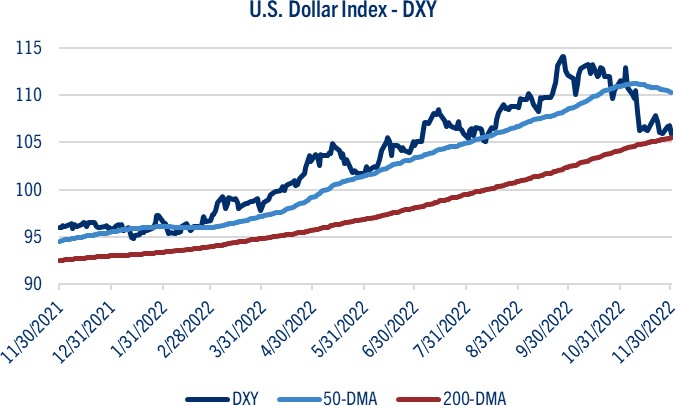
Source: Bloomberg L.P.
We’re not convinced that peak inflation equates to a peak in monetary tightening, though, as global investors bid up the likelihood of a Fed pivot over the past six weeks. As a result, we expect sustained, yet below peak pricing pressures, will keep the Fed on its projected path, restoring a global bid for the dollar next year.
Indeed, after a troubling year for commodities, the recent dollar weakness boosted prices for industrial and precious metals, including copper and gold. Yet, the broader CRB Commodities Index has failed to gain much traction thus far in the fourth quarter. See chart: CRB.
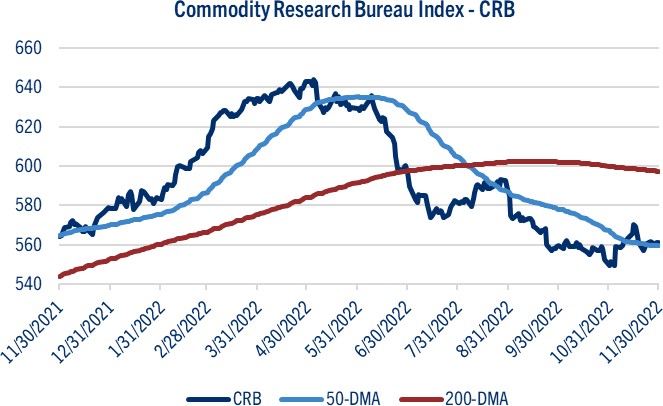
Source: Bloomberg L.P.
Oil prices followed a completely different trajectory than other commodities in 2022, as gains of approximately 60.0% in WTI early this summer dwindled to upper single digits YTD at the end of November. The war in Ukraine and continued supply chain disruptions moved oil higher, only to moderate as economic growth in China weakened and OPEC announced less than expected production cuts.
In 2023, we look for a resumption of U.S. dollar strength and a renewed bid for oil as geopolitical tensions remain elevated. Commodities including copper and gold are unlikely to gain traction until the Fed’s tightening campaign abates.
We wish you a joyful holiday season and a happy and healthy 2023!