by David Stonehouse, Senior Vice-President, Head of North American and Specialty Investments, AGF Investments Inc.
Inflation has been one of the key issues affecting global markets this year, and in recent months the focus has increasingly turned to whether it has peaked. In our view, the signs are certainly there. Commodity prices have declined significantly from the heights of last spring. ISM Manufacturing and Services indexes, which measure economic activity based on surveys of purchasing managers, are turning sharply down, and they tend to lead consumer price index (CPI) data. The supply of money, a harbinger of future inflation, has dropped precipitously due to tight central bank policies. Rents and mortgages are still rising, but the pace of increase in the U.S. has slowed. Unit labour costs in the States are still increasing, too, but it’s hard to imagine a world in which a slowing economy doesn’t lead to weaker employment and wages. So, on balance, our view is that inflation has probably peaked, although it might take a little longer for the data to definitively reflect the turn.
Good news, right? Sure it is. But there’s some not-so-good news, too. Inflation, which hit 8.3% annualized in the U.S. in August, still has a long way to fall before it even approaches the 2% target of the Federal Reserve (Fed), which sets the tone for central banks around the world. That means there is likely still some way to go in the current monetary tightening cycle. For investors, this reality keeps several questions in play: How long will it take the Fed to tame inflation? How high will it take rates? What level of inflation will it view as tolerable? How bad will this cycle be for bonds, which have been thoroughly trounced this year already? Will there be a recession? If so, when?
These are vital questions. They are also largely unanswerable – which won’t stop market prognosticators from making their best efforts, of course. But rather than guessing at answers amid so much uncertainty, we think investors would be on firmer ground if they made good decisions about where to look for answers. And in our view, there is a key indicator they absolutely must pay attention to: the two-year U.S. Treasury yield.
Before we get to why, let’s look at how far inflation still needs to fall and where rates might end up before it gets there. Historically, the Fed has never stopped raising rates until the federal funds (target) rate is higher than CPI inflation; after its 75-basis-point hike in September, the rate (3.25%) was still 500 bps below August CPI. If we take Fed officials at their word about future hikes, the federal funds rate will be at 450 bps by year end. Where will inflation be by then? Well, if we assume a constant CPI increase of 0.2% monthly, which would be roughly in line with the Fed’s annual target (and a reasonable estimate given the last two months have been 0.0% and 0.1%), then it would still be in the 6%-plus range annualized at the end of the year. It would not fall to the 3% range, where we could reasonably expect the Fed to pause, until the second quarter of 2023. Federal funds futures markets are currently expecting rates to be at 4.5% in April 2023, but one has to wonder if that is high enough. By that time, a federal funds rate of 5% no longer seems out of the question.
Of course, that scenario makes a lot of assumptions, which may or may not prove right. But for direction – and to see if we are headed in the right one – we can turn to the two-year Treasury yield, which has proven itself to be a highly reliable indicator of the federal funds rate. The reason is that it reflects the market’s expectations for the time-weighted average benchmark interest rate over the next two years. As a result, the yield tends to move before the federal funds rate, manifesting where the market thinks the Fed is going and what the economic outlook is. In turn, that tends to impact the rest of the bond market.
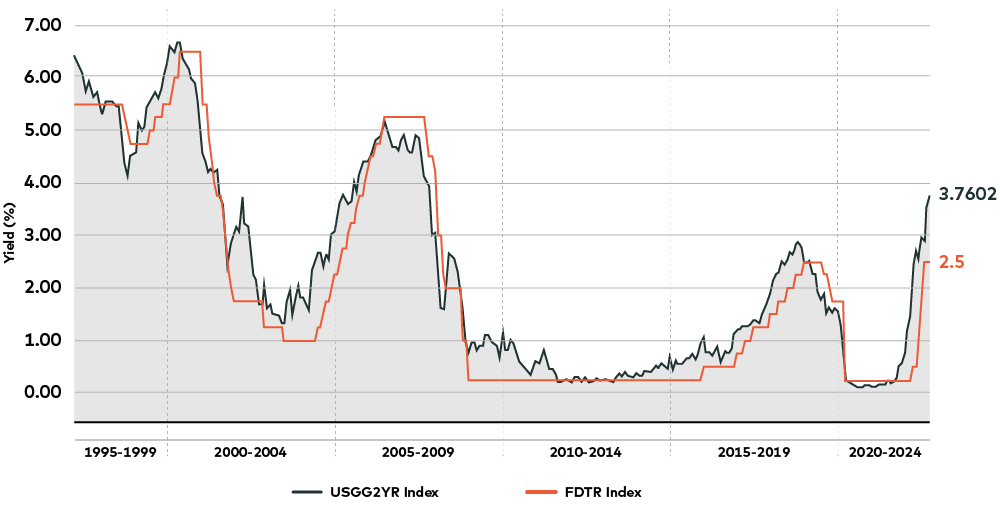
The chart below (fig. 1) plots the two-year Treasury yield and the federal funds rate since the 1990s. Typically, when the two-year yield and the fed rate cross, it signals an upcoming policy inflection point. For instance, the lines crossed in early 2000, in 2006 and in late 2018; in every instance, a reversal in the federal funds rate followed. The phenomenon also tends to be directional: when the two-year yield crosses below the rate line, rates fall; when it crosses above, rates climb (as in late 2021). This last point is critical and bears repeating: the two-year yield crossing below the federal funds rate is a reliable signal of a coming change from tight to easy monetary policy.
Two-year Treasury yield and federal funds rate (fig.1)

Source: Bloomberg LP, as of September 30, 2022
So where is the two-year yield now, compared to the fed rate? As the right side of the chart shows, there is still a wide gap, suggesting that the Fed is still firmly in catch-up mode (and confirming the underlying assumptions of our scenario above).
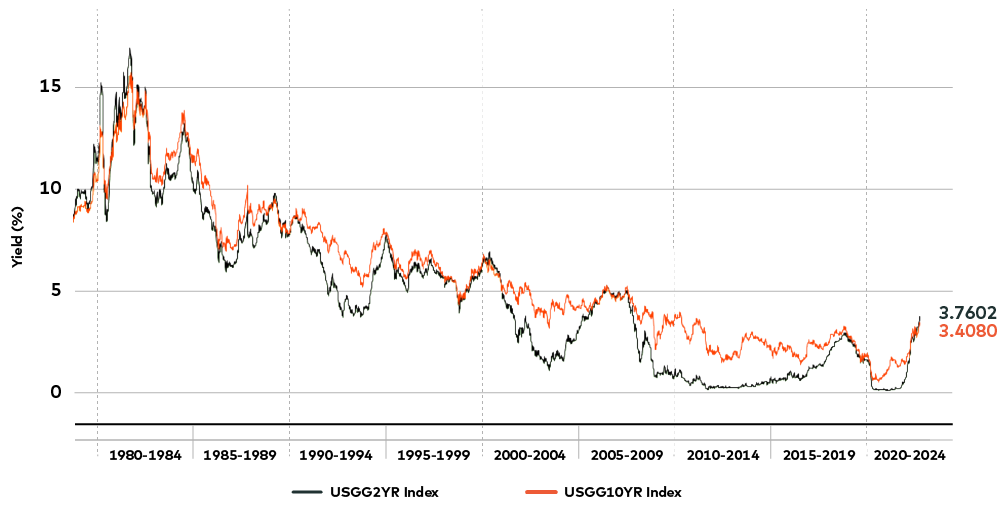
We can also use the two-year yield to get a signal for where the rest of the bond market is headed. This chart (fig. 2) shows the two-year yield and the yield on 10-year Treasuries. Again, we’re looking for changes in direction, and what’s readily apparent is that two-year and 10-year yields tend to converge around inflection points in the market.
Two-year and 10-year Treasury yields (fig. 2)

Source: Bloomberg LP, as of September 30, 2022
Those intersections can reflect yield curve inversions (a bad signal for the economy) or steepenings out of inversions (good). It’s also important to note here that the 10-year typically peaks along with the two-year. If, as we suspect, two-year yields still have room to climb (because the federal funds rate has so far to go), then the chart suggests that it might be too soon to be bullish on bonds. But given that the two-year/10-year curve has been inverted since March, the fact that the yields are converging is an encouraging sign that the end of this bond bear market, now two years old, may be approaching.
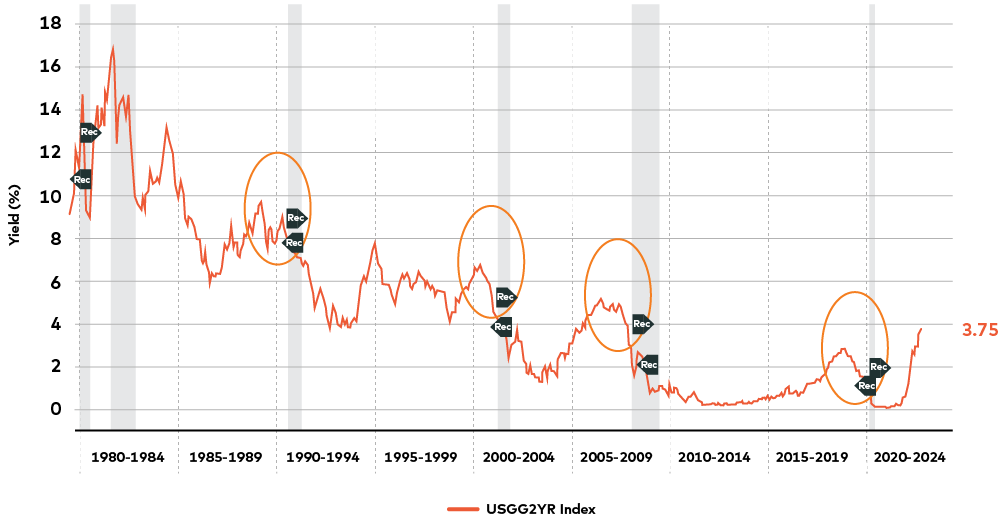
Finally, we can employ the two-year Treasury yield to project the likelihood and timing of a recession. As the next chart (fig. 3) shows, peaks in the two-year yield usually pre-date a recession (the red vertical bars) by 12 to 18 months. When the Fed is done hiking (as pre-dated by two-year yield peaks), it usually means a hard landing for the economy. (Central banks rarely engineer a soft one.)
2y Treasury yields and recessions (fig. 3)

Source: Bloomberg LP, as of September 30, 2022
This analysis suggests that a recession, should there be one, is still some distance away – and nobody, not even the Fed, can accurately predict what’s going to happen in a year.
These scenarios may or may not play out, of course. There is a lot going on in the economy, in policymaking and in markets these days (in case you hadn’t noticed), and the environment is evolving rapidly and unpredictably. But the important message is this: As events unfold, watch the two-year Treasury yield. It isn’t a perfect indicator of the shape of things to come, but it just might be the best one we’ve got.
David Stonehouse is Senior Vice-President and Head of North American and Specialty Investments, AGF Investments Inc. He is a regular contributor to AGF Perspectives.
To learn more about our fixed income capabilities, please click here.
The views expressed in this blog are those of the author and do not necessarily represent the opinions of AGF, its subsidiaries or any of its affiliated companies, funds, or investment strategies.
The commentaries contained herein are provided as a general source of information based on information available as of October 7, 2022 and are not intended to be comprehensive investment advice applicable to the circumstances of the individual. Every effort has been made to ensure accuracy in these commentaries at the time of publication, however, accuracy cannot be guaranteed. Market conditions may change and AGF Investments accepts no responsibility for individual investment decisions arising from the use or reliance on the information contained here.
“Bloomberg®” is a service mark of Bloomberg Finance L.P. and its affiliates, including Bloomberg Index Services Limited (“BISL”) (collectively, “Bloomberg”) and has been licensed for use for certain purposes by AGF Management Limited and its subsidiaries. Bloomberg is not affiliated with AGF Management Limited or its subsidiaries, and Bloomberg does not approve, endorse, review or recommend any products of AGF Management Limited or its subsidiaries. Bloomberg does not guarantee the timeliness, accurateness, or completeness, of any data or information relating to any products of AGF Management Limited or its subsidiaries.
This blog may contain links to third-party websites. The parties who own, maintain or control third-party websites are solely responsible for their content, and AGF assumes no responsibility for such content. Links to third-party websites are provided for convenience only and are not to be construed as an endorsement or recommendation of the products, services, advice or information that may be available on them
AGF Investments is a group of wholly owned subsidiaries of AGF Management Limited, a Canadian reporting issuer. The subsidiaries included in AGF Investments are AGF Investments Inc. (AGFI), AGF Investments America Inc. (AGFA), AGF Investments LLC (AGFUS) and AGF International Advisors Company Limited (AGFIA). AGFA and AGFUS are registered advisors in the U.S. AGFI is registered as a portfolio manager across Canadian securities commissions. AGFIA is regulated by the Central Bank of Ireland and registered with the Australian Securities & Investments Commission. The subsidiaries that form AGF Investments manage a variety of mandates comprised of equity, fixed income and balanced assets.
® The “AGF” logo is a registered trademark of AGF Management Limited and used under licence.
RO:20221013-2464097
Copyright © AGF Investments Inc.


