
The Bottom Line
Additional technical evidence of an intermediate low by U.S. and Canadian equity markets surfaced last week despite weakness on Friday. Ironically, weakness on Friday was triggered by a better than expected U.S. September Employment Report. The report surprisingly included a drop in the Unemployment Rate from 3.7% in August to 3.5%. Wall Street predicted that the better than expected news on employment will add upside pressure on wages which in turn will add to higher consumer prices. U.S. equity indices responded accordingly: The Federal Reserve now is expected to wait longer before “pivoting” from its current monetary tightening policy.
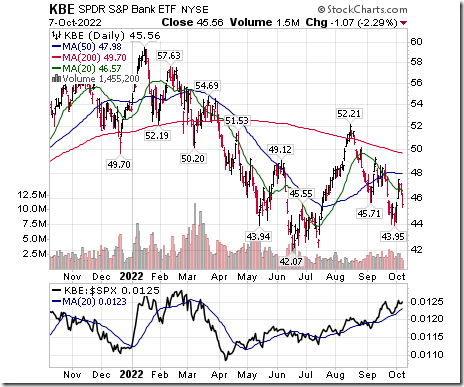
Focuses this week are on the September CPI report on Thursday and third quarter earnings reports by major U.S. banks on Friday. Both have the potential to move U.S. equity markets significantly. The CPI report is expected to show another drop in the annual rate. The ETF for U.S. large cap financials recently has outperformed the S&P 500 Index, a technical sign that a positive surprise is possible. Seasonal influences also are positive for the industry between now and the second week in January.
Consensus for Earnings and Revenues for S&P 500 Companies
Analysts lowered earnings estimates significantly again last week. According to www.factset.com third quarter earnings on a year-over-year basis are expected to increase 2.4% (versus previous estimate at 2.9%) and revenues are expected to increase 8.5%.(versus previous estimate at 8.7%) Fourth quarter earnings are expected to increase 3.6% (versus previous estimate at 4.0%) and revenues are expected to increase 6.0% (versus previous estimate at 6.2%). For 2022 earnings are expected to increase 7.3% (versus previous estimate at 7.4%) and revenues are expected to increase 10.6% (versus previous estimate at 10.7%.
Preliminary estimates for 2023 also moved lower. According to www.factset.com first quarter 2023 earnings are expected to increase 6.2% (versus previous estimate at 6.5%) and revenues are expected to increase 5.8% (versus previous estimate at 5.9%). Second quarter 2023 earnings are expected to increase 5.1% (versus previous estimate at 5.5%) and revenues are expected to increase 3.2% (versus previous estimate at 3.3%). For all of 2023, earnings are expected to increase 7.9% and revenues are expected to increase 4.3% (versus previous estimate at 4.4%).
Economic News This Week
September Producer Price Index released at 8:30 AM EDT on Wednesday is expected to increase 0.2% versus a drop of 0.1% in August. On a year-over-year basis, the Index is expected to increase 8.4% versus 8.7% in August. Excluding food and energy September PPI is expected to increase 0.3% versus a gain of 0.4% in August. On a year-over-year basis, core September PPI is expected to increase 7.3% versus a gain of 7.3% in August.
September Consumer Price Index released at 8:30 AM EDT on Thursday is expected to increase 0.2% versus a gain of 0.1% in August. On a year-over-year basis, September Consumer Price Index is expected to increase 8.1% versus a gain of 8.3% in August. Excluding food and energy, September Consumer Price Index is expected to increase 0.5% versus a gain of 0.5% in August. On a year-over-year basis, September core is expected to increase 6.5% versus a gain of 6.3% in August.
September Retail Sales released at 8:30 AM EDT on Friday is expected to increase 0.2% versus a gain of 0.3% in August. Excluding auto sales, September Retail Sales is expected to increase 0.1% versus a drop of 0.3% in August.
August Business Inventories released at 10:00 AM EDT on Friday are expected to increase 0.6% versus a gain of 0.6% in July.
October Michigan Sentiment released at 10:00 AM EDT on Friday is expected to increase to 58.9 from 58.6 in August.
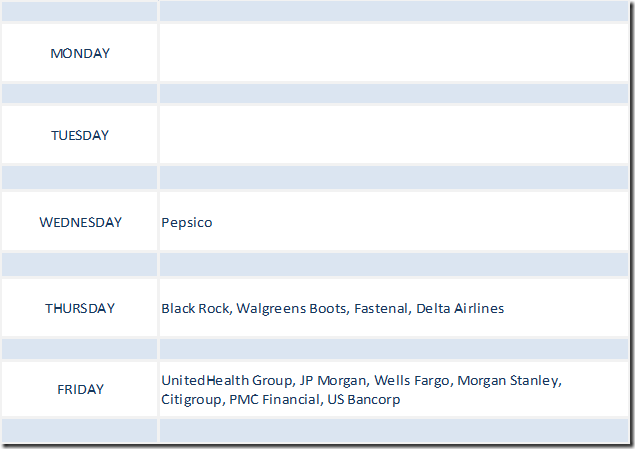
Earnings News This Week
Trader’s Corner
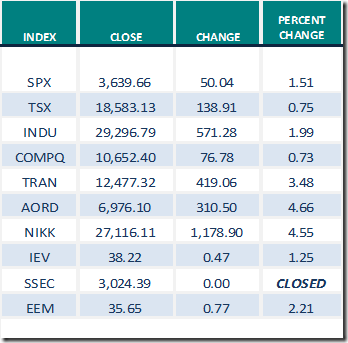
Equity Indices and Related ETFs
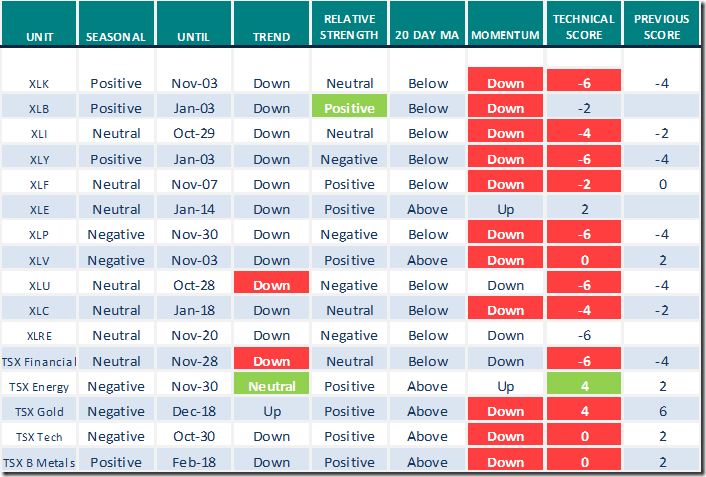
Daily Seasonal/Technical Equity Trends for October 7th 2022
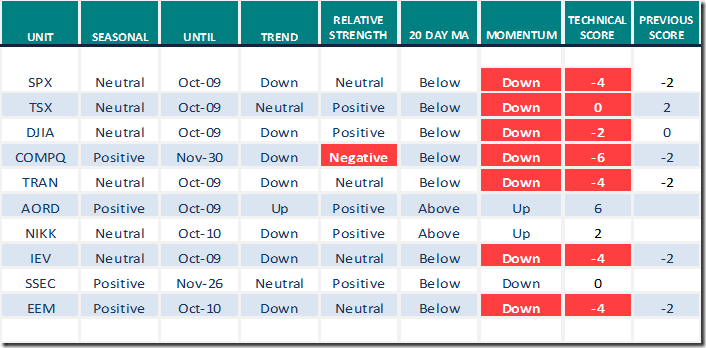
Green: Increase from previous day
Red: Decrease from previous day
Commodities
Daily Seasonal/Technical Commodities Trends for October 7th 2022
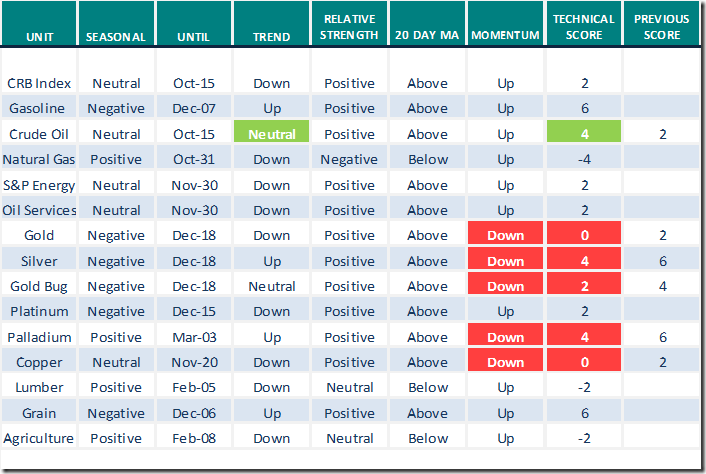
Green: Increase from previous day
Red: Decrease from previous day
Sectors
Daily Seasonal/Technical Sector Trends for October 7th 2021
Green: Increase from previous day
Red: Decrease from previous day
Links offered by valued providers
Mark Leibovit comments on October 7th
Could Stock Markets Test March 2020 Lows? – HoweStreet
Greg Schnell discusses “Why this rollover is so important”.
Why This Rollover Is So Important | The Canadian Technician | StockCharts.com
Mish Schneider discusses “The battle of Supply and Demand: Oil, Gold and the market”.
The Battle of Supply and Demand, Oil, Gold and the Market | Mish’s Market Minute | StockCharts.com
Links offered by Mark Bunting and www.uncommonsenseinvestor.com
Fed Pivot is a "BS Narrative" – Uncommon Sense Investor
Investing vs. Speculating – Uncommon Sense Investor
Michael Campbell’s Money Talks for October 8th
Michael Campbell’s MoneyTalks – Complete Show (mikesmoneytalks.ca)
Victor Adair’s Trading Desk Notes for October 8th
https://victoradair.ca/trading-desk-notes-for-october-8-2022/
Technical Scoop from David Chapman and www.EnrichedInvesting.com
Technical Scores
Calculated as follows:
Intermediate Uptrend based on at least 20 trading days: Score 2
(Higher highs and higher lows)
Intermediate Neutral trend: Score 0
(Not up or down)
Intermediate Downtrend: Score -2
(Lower highs and lower lows)
Outperformance relative to the S&P 500 Index: Score: 2
Neutral Performance relative to the S&P 500 Index: 0
Underperformance relative to the S&P 500 Index: Score –2
Above 20 day moving average: Score 1
At 20 day moving average: Score: 0
Below 20 day moving average: –1
Up trending momentum indicators (Daily Stochastics, RSI and MACD): 1
Mixed momentum indicators: 0
Down trending momentum indicators: –1
Technical scores range from -6 to +6. Technical buy signals based on the above guidelines start when a security advances to at least 0.0, but preferably 2.0 or higher. Technical sell/short signals start when a security descends to 0, but preferably -2.0 or lower.
Long positions require maintaining a technical score of -2.0 or higher. Conversely, a short position requires maintaining a technical score of +2.0 or lower
Changes Last Week
Technical Notes from Friday
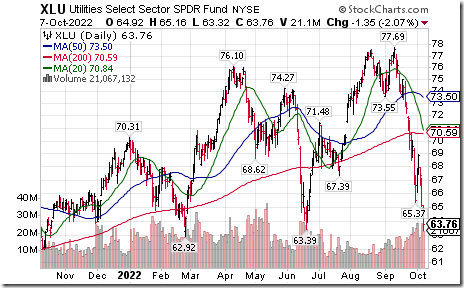
Utilities SPDRs $XLU moved below $63.39 extending an intermediate downtrend.
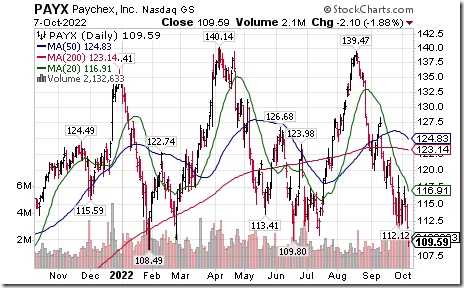
Paychex $PAYX a NASDAQ 100 stock moved below $109.80 extending an intermediate downtrend.
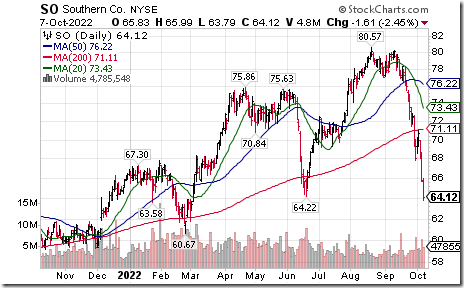
Southern Companies $SO an S&P 100 stock moved below $64.22 extending an intermediate downtrend.
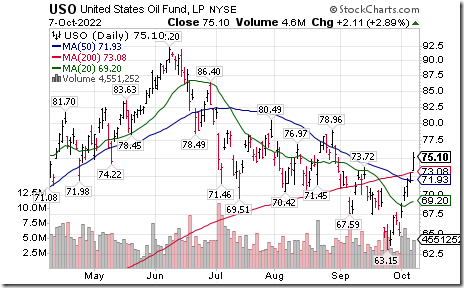
Energy stocks on both sides of the border responded to higher crude oil prices. Crude oil ETN $USO moved above $25.86 extending an intermediate uptrend.
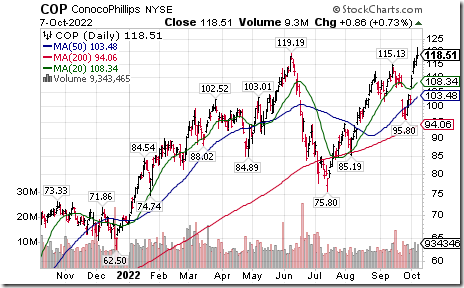
Conoco Phillips $COP an S&P 100 stock moved above $119.19 to an all-time high extending an intermediate uptrend.
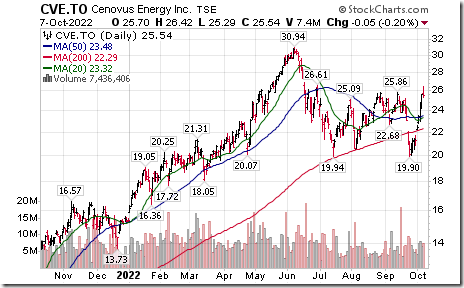
Cenovus $CVE.TO a TSX 60 stock moved above $25.86 extending an intermediate uptrend.
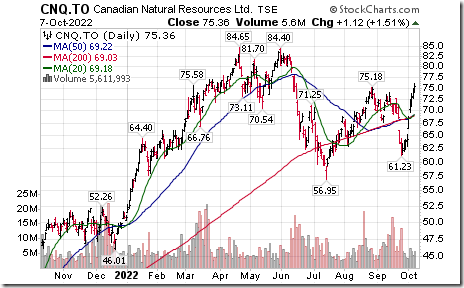
Canadian Natural Resources $CNQ.TO a TSX 60 stock moved above $75.18 extending an intermediate uptrend.
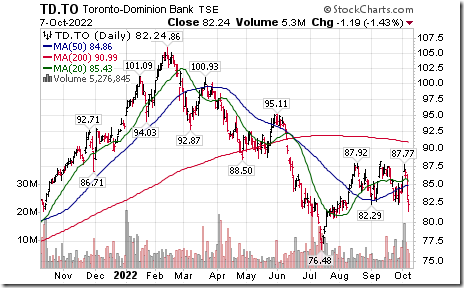
Toronto Dominion Bank $TD.TO a TSX 60 stock moved below intermediate support at $82.29
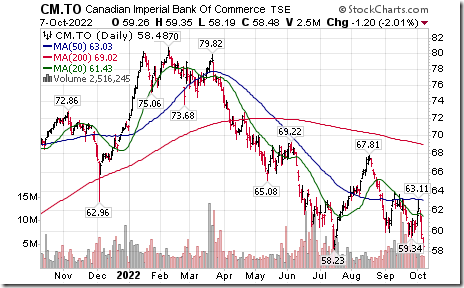
Commerce Bank $CM.TO a TSX 60 stock moved below $58.23 extending an intermediate downtrend.
S&P 500 Momentum Barometers
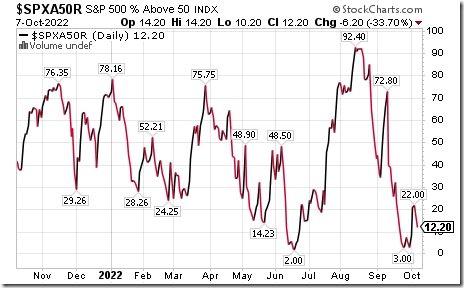
The intermediate term Barometer dropped 6.20 on Friday, but gained 9.00 last week to 12.20. It remains Oversold and has bottomed.
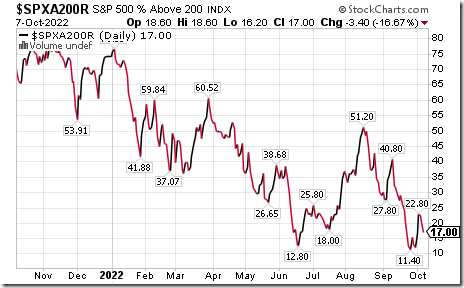
The long term Barometer dropped 3.40 on Friday, but gained 4.80 last week to 17.00. It remains Oversold and has bottomed.
TSX Momentum Barometers
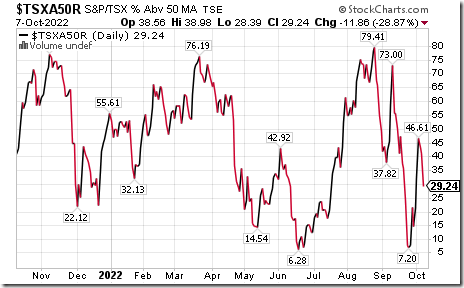
The intermediate term Barometer dropped 11.86 on Friday, but gained 8.05 last week to 29.24. It briefly moved to Neutral (over 40.00), but closed on Friday at Oversold. It bottomed at 7.20
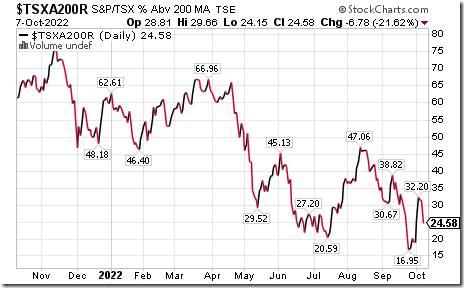
The long term Barometer dropped 6.78 on Friday, but gained 5.51 last week. It remains Oversold. It bottomed at 16.95
Disclaimer: Seasonality ratings and technical ratings offered in this report and at
www.equityclock.com are for information only. They should not be considered as advice to purchase or to sell mentioned securities. Data offered in this report is believed to be accurate, but is not guaranteed