
The Bottom Line
Focus this week is on the August PCE Price Index released at 8:30 AM EDT on Friday, the data point that is most closely followed by most members of the FOMC to determine the trend for inflation. Consensus calls for actual and core data points that are unchanged/slightly higher from July. U.S. equity indices will respond strongly higher if the actual data points are lower than consensus.
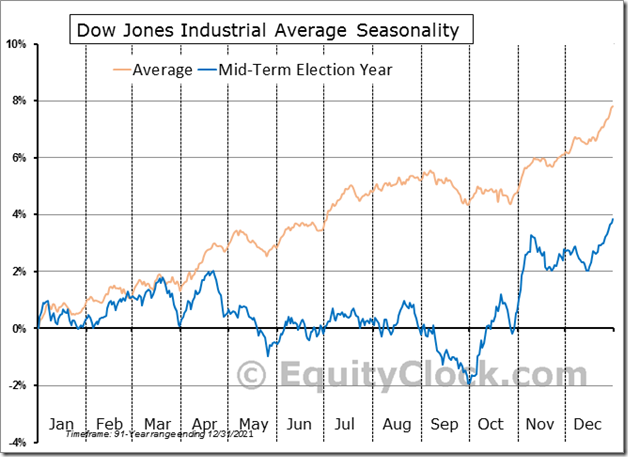
Seasonal influences suggest that U.S. equity indices normally reach an important intermediate low at the end of September during a mid-term election year in the U.S. Presidential Election Cycle. Will history repeat?
Meanwhile, North American equity markets are extremely oversold by several measures: The CNN Fear & Greed Index dropped to 24 on Friday into the Extreme Fear level. See: https://www.cnn.com/markets/fear-and-greed Intermediate and long term Barometers for S&P 500 and TSX Composite stocks available at the end of this report also are extremely oversold. However, technical signs of a bottom have not arrived yet. Traders are waiting for a reason to become bullish. Patience will be rewarded.
Consensus for Earnings and Revenues for S&P 500 Companies
Analysts lowered earnings estimates slightly again last week. According to www.factset.com third quarter earnings on a year-over-year basis are expected to increase 3.2% (versus previous estimate at 3.5%) and revenues are expected to increase 8.7%. Fourth quarter earnings are expected to increase 4.5% (versus previous estimate at 4.8%) and revenues are expected to increase 6.4%. For 2022 earnings are expected to increase 7.7% and revenues are expected to increase 10.7%.
Preliminary estimates for 2023 also moved slightly lower. According to www.factset.com first quarter 2023 earnings are expected to increase 7.2% (versus previous estimate at 7.3%) and revenues are expected to increase 6.1% (versus previous estimate at 6.2%). Second quarter 2023 earnings are expected to increase 6.0% (versus previous estimate at 6.2%) and revenues are expected to increase 3.4% (versus previous estimate at 3.6%). For all of 2023, earnings are expected to increase 8.1% (versus previous estimate at 8.2%) and revenues are expected to increase 4.5%.
Economic News This Week
August Durable Goods Orders released at 8:30 AM EDT on Tuesday are expected to drop 0.5% versus a decline of 0.1% in July. Excluding transportation orders, August Durable Goods Orders are expected to increase 0.2% versus a gain of 0.2% in July.
August New Home Sales released at 10:00 AM EDT on Tuesday are expected to slip to 500,000 from 511,000 in July.
July Canadian GDP released at 8:30 AM EDT on Thursday is expected to drop 0.1% versus a gain of 0.1% in June.
Next estimate of U.S. annualized second quarter real GDP released at 8:30 AM EDT on Thursday is expected to remain unchanged at -0.6%.
Year-over-year August PCE Price Index released at 8:30 AM EDT on Friday is expected to remain unchanged at 6.3% in July. Excluding food and energy, Index is expected to increase 4.7% versus 4.6% in July.
August Personal Income released at 8:30 AM EDT on Friday is expected to increase 0.3% versus a gain of 0.2% in July. August Personal Spending is expected to increase 0.2% versus a gain of 0.1% in July.
September Chicago PMI released at 9:45 AM EDT on Friday is expected to slip to 52.0 from 52.2 in August
September Michigan Consumer Sentiment released at 10:00 AM EDT is expected to remain unchanged from August at 59.5.
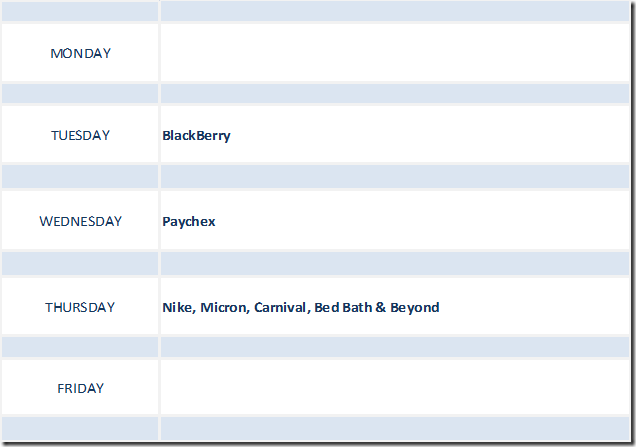
Earnings News This Week
Trader’s Corner
Equity Indices and Related ETFs
Daily Seasonal/Technical Equity Trends for September 23rd 2022
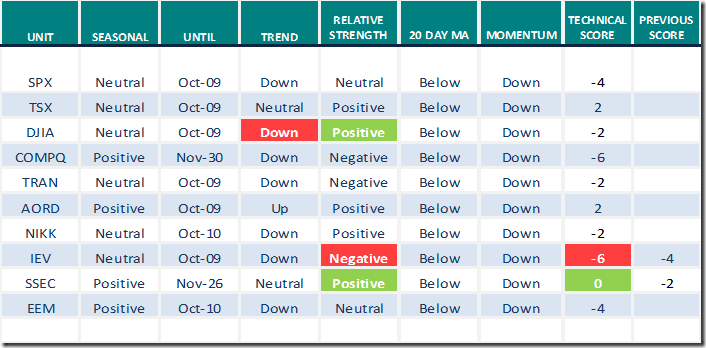
Green: Increase from previous day
Red: Decrease from previous day
Commodities
Daily Seasonal/Technical Commodities Trends for September 23rd 2022
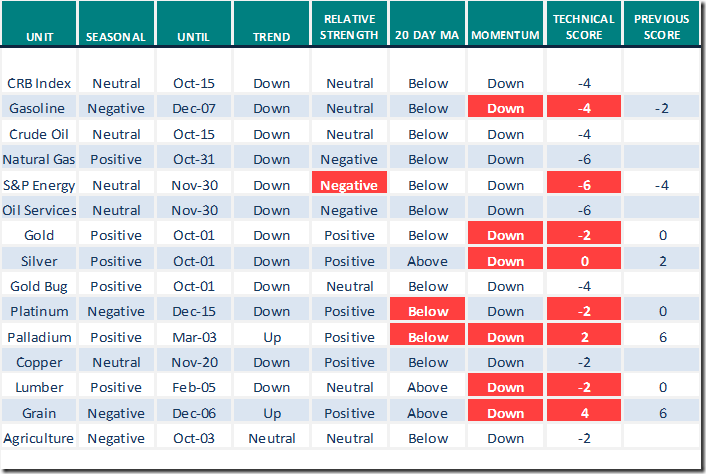
Green: Increase from previous day
Red: Decrease from previous day
Sectors
Daily Seasonal/Technical Sector Trends for September 23rd 2021
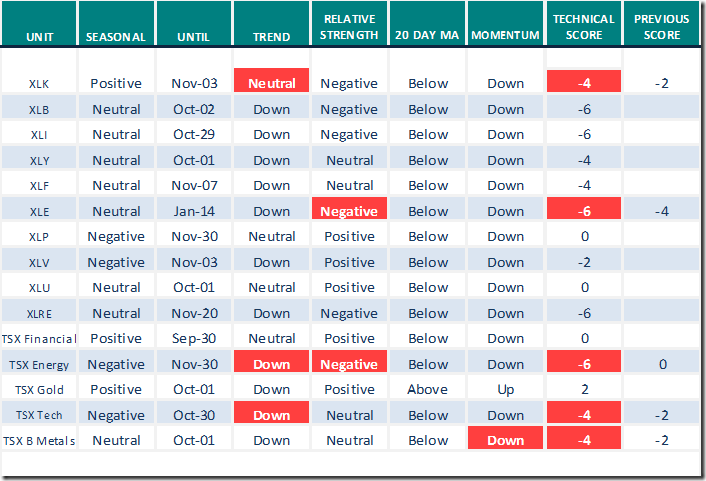
Green: Increase from previous day
Red: Decrease from previous day
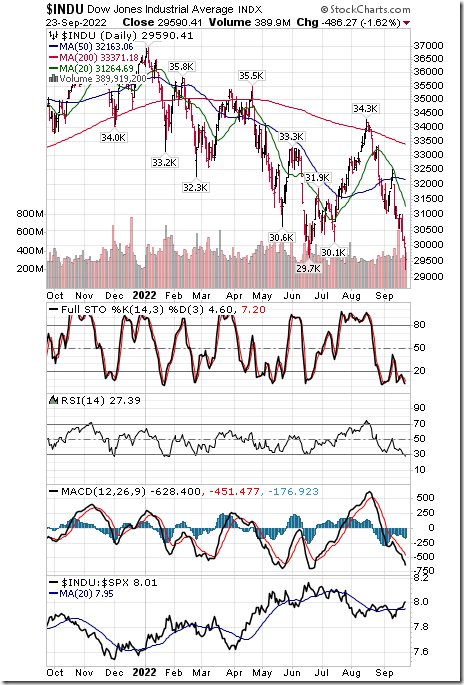
Chart of the day
On Friday, the Dow Jones Industrial Average moved below intermediate support levels at 29,740.25 and 30,143.93 changing intermediate trend from up to down (Score: from +2 to -2). Almost simultaneously, strength relative to the S&P 500 Index changed from Negative to Positive (Score: from -2 to +2). Short term momentum indicators continued to trend down (Score: -1) and price remained below its 20 day moving average (Score:-1). Accordingly, technical score remained unchanged at (-2 +2-1-1=) -2
Technical Notes for Friday
Indices breaking intermediate support on Friday
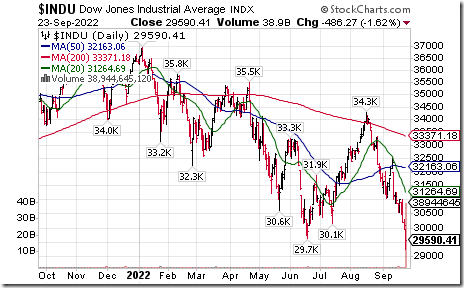
Dow Jones Industrial Average moved below 29,888.78 extending an intermediate downtrend.
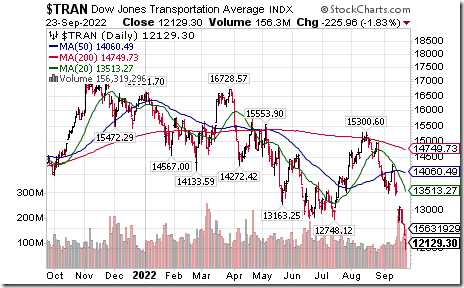
Dow Jones Transportation Average moved below $12,748.12 extending an intermediate downtrend.
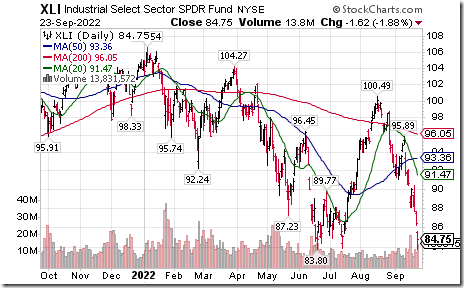
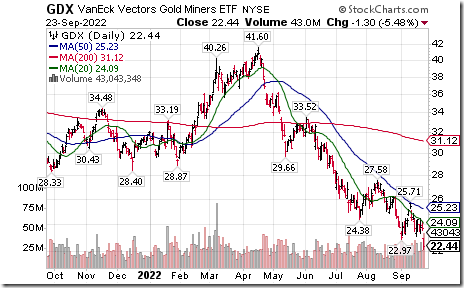
ETFs breaking intermediate support on Friday: DIA, IYT, IYR, KBE, KRE, XLI, GDX, GDXJ, COPX, USO, PICK, SMH, EWA, JETS
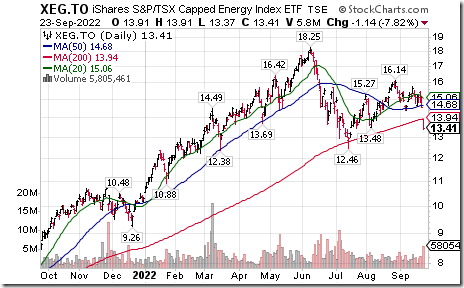
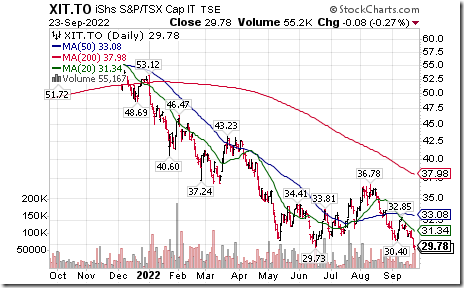
Canadian ETFs breaking intermediate support on Friday: XEG, ZEM, ZEO, XIT, XFN, XBM
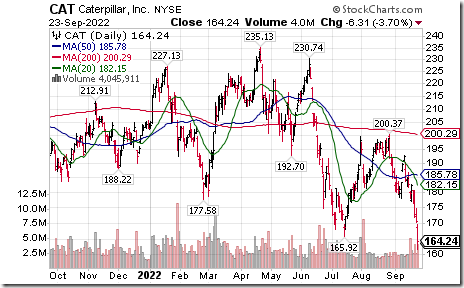
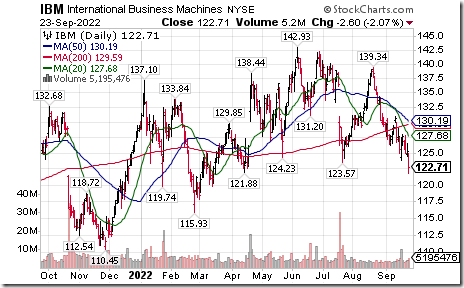
S&P 100 stock breaking intermediate support on Friday: SLB, BKNG, AIG, BK, MET, MS, SPG, CAT, UPS, GD, IBM
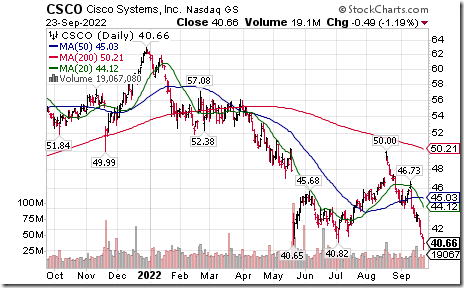
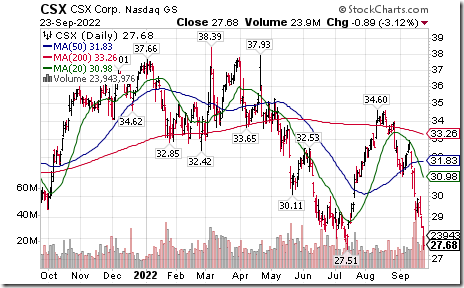
NASDAQ 100 stocks breaking intermediate support on Friday: ROST, DXCM, CSCO, CSX, MELI
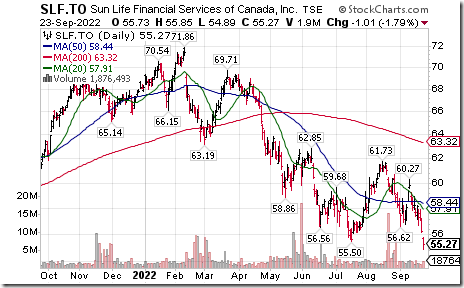
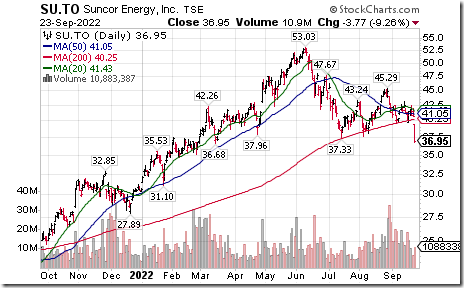
TSX 60 stocks breaking intermediate support on Friday: SLF, POW, CNQ, TRP, SU, ENB, GIB.A, PPL BAM.A, CTC.A, GIL, WMI, YRI, SU, MG
Links offered by valued providers
Mark Leibovit link for Sept. 22nd
Gold, Crude Oil, USD, Stock Markets – HoweStreet
Greg Schnell asks “Which way is up”?
https://stockcharts.com/articles/canada/2022/09/which-way-is-up-716.html
Michael Campbell’s MoneyTalks
https://mikesmoneytalks.ca/category/mikes-content/?mc_cid=6ba3ab6f83&mc_eid=592546b4b5
Dave Keller notes the “Exceptionally Bearish Breadth”
Exceptionally Bearish Breadth | The Mindful Investor | StockCharts.com
Mary Ellen McGonagle asks “Will the markets stage a countertrend bounce next week”?
Will The Markets Stage a Countertrend Bounce Next Week? | The MEM Edge | StockCharts.com
John Hopkins says “Let your risk tolerance determine if you buy the dip”.
Let Your Risk Tolerance Determine If You Buy the Dip | Top Advisors Corner | StockCharts.com
Victor Adair’s Trading Notes for September 24rth
Trading Desk Notes for September 24, 2022 – HoweStreet
Links from Mark Bunting and www.uncommonsenseinvestor.com
Seven Canadian "Debt Monsters" Have Bond Markets Worried – Uncommon Sense Investor
Technical Scoop from David Chapman and www.EnrichedInvesting.com
Technical Scores
Calculated as follows:
Intermediate Uptrend based on at least 20 trading days: Score 2
(Higher highs and higher lows)
Intermediate Neutral trend: Score 0
(Not up or down)
Intermediate Downtrend: Score -2
(Lower highs and lower lows)
Outperformance relative to the S&P 500 Index: Score: 2
Neutral Performance relative to the S&P 500 Index: 0
Underperformance relative to the S&P 500 Index: Score –2
Above 20 day moving average: Score 1
At 20 day moving average: Score: 0
Below 20 day moving average: –1
Up trending momentum indicators (Daily Stochastics, RSI and MACD): 1
Mixed momentum indicators: 0
Down trending momentum indicators: –1
Technical scores range from -6 to +6. Technical buy signals based on the above guidelines start when a security advances to at least 0.0, but preferably 2.0 or higher. Technical sell/short signals start when a security descends to 0, but preferably -2.0 or lower.
Long positions require maintaining a technical score of -2.0 or higher. Conversely, a short position requires maintaining a technical score of +2.0 or lower
Changes Last Week
S&P 500 Momentum Barometers
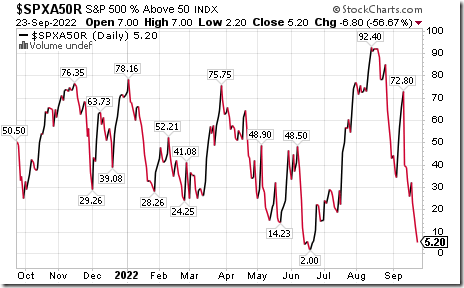
The intermediate term Barometer plunged another 6.80 on Friday and another 20.80 last week to 5.20. It is extremely oversold, but has yet to show signs of bottoming.
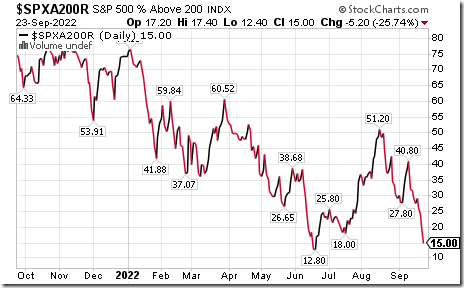
The long term Barometer plunged another 5.20 on Friday and 12.60 last week to 15.00. It is extremely oversold, but has yet to show signs of bottoming.
TSX Momentum Barometers
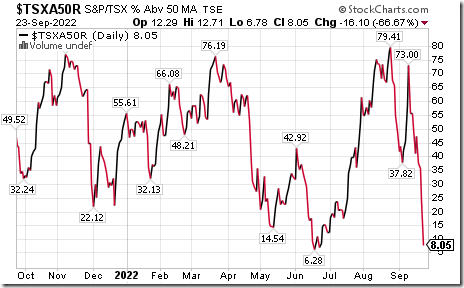
The intermediate term Barometer plunged 16.10 on Friday and 33.30 last week to 8.05. It is extremely oversold, but has yet to show signs of bottoming.
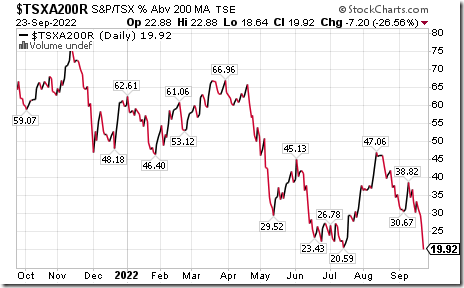
The long term Barometer dropped 7.20 on Friday and 10.46 last week to 19.92. It is extremely Oversold, but has yet to show signs of bottoming.
Disclaimer: Seasonality ratings and technical ratings offered in this report and at
www.equityclock.com are for information only. They should not be considered as advice to purchase or to sell mentioned securities. Data offered in this report is believed to be accurate, but is not guaranteed