by Franklin Mutual Series Desk, Franklin Templeton Fund
Companies outside the United States provide many of the products we use or consume every day—even some of our most iconic brands. When was the last time you drove somewhere without seeing a Toyota car? How many of your friends have Samsung televisions? Have you recently used a BP filling station, or drank an imported beer? These products are so popular in American markets, investors may not consider that if they focus exclusively on the US market, they are missing out on opportunities in many successful foreign-owned companies. Maintaining an investment portfolio that includes a mix of US- and non-US domiciled companies can help investors capture best-in-class opportunities across the world’s markets and offer strong participation across the entire market cycle.
Mind the gap
There are many potential benefits to investing globally. First, a global allocation widens the opportunity set from which to source investments. As of March 31, 2022, 37% of the global market capitalization, as represented by the MSCI ACWI IMI index, was located outside of the United States.1 When you widen your investment horizon, you’ll find a number of best-in-class companies, like chipmakers in Asia or luxury goods or pharmaceutical companies in Europe. In addition, in countries with less-efficient markets, there can be greater investment opportunities. That’s because many non-US markets have fewer analysts covering locally domiciled companies, and a relative lack of high-quality research can inhibit efficient pricing. Investors are thus able to identify potential opportunities that others have missed.
A common refrain we’ve all heard is “buy low, sell high.” A stock that is trading at a deeper discount versus its perceived value than its industry peers can offer more upside potential. These valuation gaps can be prominent across regions, too. A US-based industrials company may be trading at a premium versus its non-US peers due to differences in demand, taxes, regulation or other regional discrepancies. A global portfolio may open the door to uncover and invest in these deeply discounted companies.
Tech, tech, tech, boom!
Information technology companies are a main driver of US market performance. The sector makes up over one quarter of the S&P 500 and MSCI USA indexes. This year’s decline in technology stocks reflects a combination of factors, with rising interest rates being an important and somewhat misunderstood culprit.
Most investors know bond prices and interest rates are inversely linked, but they may not consider the effect interest rates have on equity prices, particularly long-duration growth stocks like technology companies. Higher long-term rates can hurt growth stocks. When the discount rate increases, the current value of the future stream of cash flows falls, potentially taking the stock price with it. This can help fuel a rotation into value-oriented stocks, which are generally less affected by rising rates and may start to look more appealing to investors by comparison.
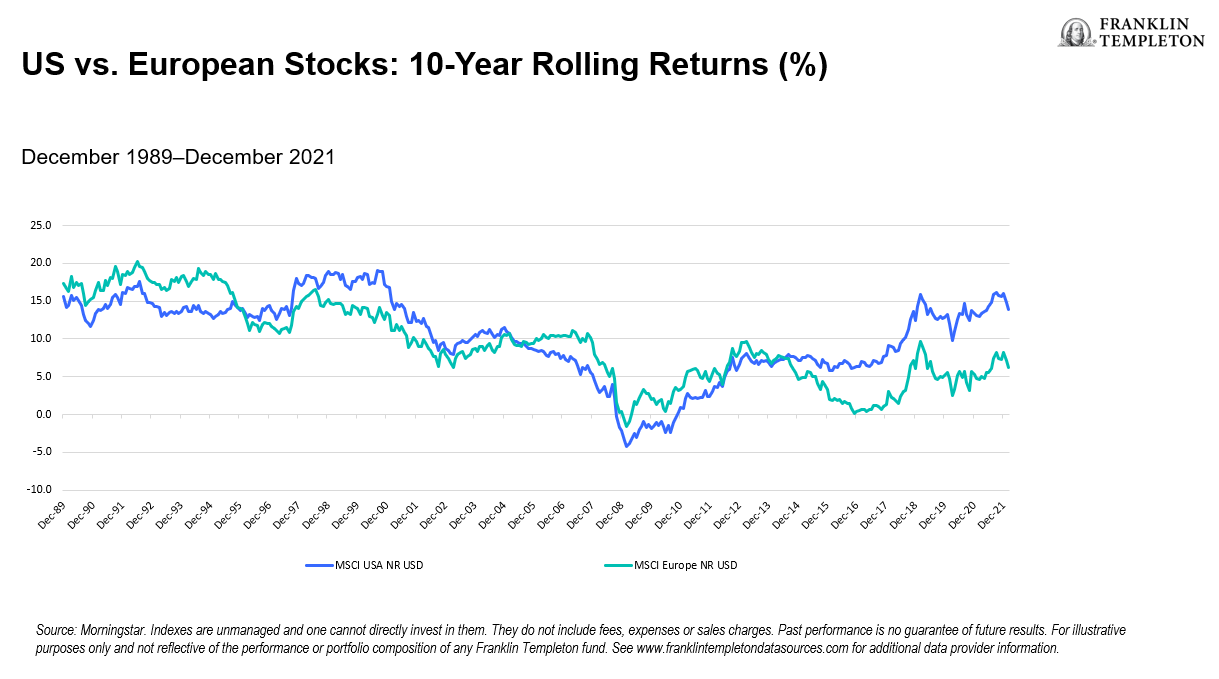
Not all regional markets are as technology-heavy, and therefore as growth-heavy, as the United States. The United States has historically underperformed value-oriented regions, such as Europe, when technology stocks are out of favor. The chart below shows the MSCI USA Index performance versus the MSCI Europe Index. On a rolling 10-year basis, European equities outpaced US equities, except for during the tech bubble during the late 1990s and the technology stock rally coming out of the global financial crisis of 2008-2009.

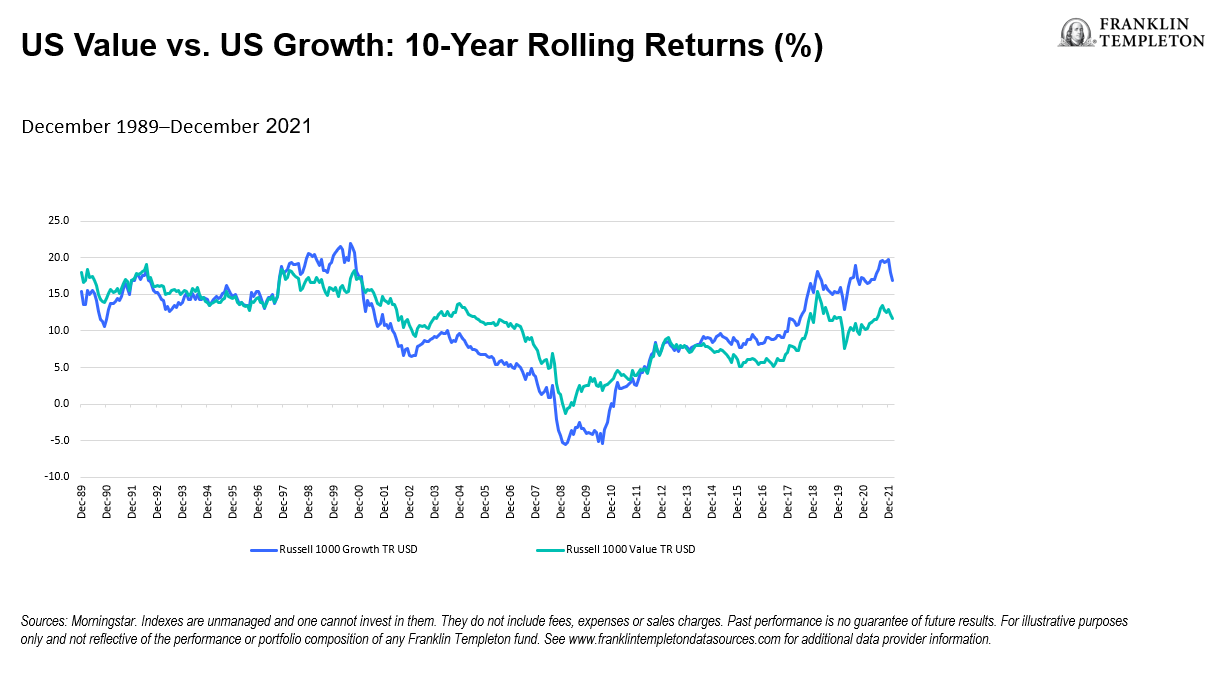
The performance pattern of US versus European stocks is similar to the return pattern of US growth versus US value stocks. Generally, when the United States underperforms other regions, it is during a time when growth is out of favor versus value.

Let’s get cyclical
It’s no secret that different types of assets do well in different types of economic environments. History has shown moderate inflation can be good for value stocks. While inflation is currently well above what is considered moderate and has been stickier than expected due in part to supply chain issues, we expect these pressures to eventually abate. What may be left is modest inflation fueled by consumer demand, which is healthy and normal, and usually coincides with moderate economic growth. A moderately growing economy has been beneficial for many value companies, as it provides the fuel these cyclically oriented companies need to grow, improve their organizations and thrive. As we continue throughout the current economic cycle, we may see value stocks strengthen once again, leading to a shift in which regions dominate equity performance.
Despite the recent outperformance of US-based companies and US investors’ home-country bias, we believe investors will still benefit from proper diversification for a well-balanced portfolio. This means US and non-US exposure, and investment in value and growth stocks. Casting a wider net and investing opportunistically across multiple regions, including those which have been out of favor, is a good way, in our view, to be well-positioned regardless of the current economic climate.
*****
WHAT ARE THE RISKS?
All investments involve risks, including the possible loss of principal. The value of investments can go down as well as up, and investors may not get back the full amount invested. Stock prices fluctuate, sometimes rapidly and dramatically, due to factors affecting individual companies, particular industries or sectors, or general market conditions. Investments in foreign securities involve special risks including currency fluctuations, economic instability and political developments. To the extent a strategy focuses on particular countries, regions, industries, sectors or types of investment from time to time, it may be subject to greater risks of adverse developments in such areas of focus than a strategy that invests in a wider variety of countries, regions, industries, sectors or investments. Any companies and/or case studies referenced herein are used solely for illustrative purposes; any investment may or may not be currently held by any portfolio advised by Franklin Templeton. The information provided is not a recommendation or individual investment advice for any particular security, strategy, or investment product and is not an indication of the trading intent of any Franklin Templeton managed portfolio. Value securities may not increase in price as anticipated or may decline further in value.
IMPORTANT LEGAL INFORMATION
This material is intended to be of general interest only and should not be construed as individual investment advice or a recommendation or solicitation to buy, sell or hold any security or to adopt any investment strategy. It does not constitute legal or tax advice. This material may not be reproduced, distributed or published without prior written permission from Franklin Templeton.
The views expressed are those of the investment manager and the comments, opinions and analyses are rendered as at publication date and may change without notice. The underlying assumptions and these views are subject to change based on market and other conditions and may differ from other portfolio managers or of the firm as a whole. The information provided in this material is not intended as a complete analysis of every material fact regarding any country, region or market. There is no assurance that any prediction, projection or forecast on the economy, stock market, bond market or the economic trends of the markets will be realised. The value of investments and the income from them can go down as well as up and you may not get back the full amount that you invested. Past performance is not necessarily indicative nor a guarantee of future performance. All investments involve risks, including possible loss of principal.
Any research and analysis contained in this material has been procured by Franklin Templeton for its own purposes and may be acted upon in that connection and, as such, is provided to you incidentally. Data from third party sources may have been used in the preparation of this material and Franklin Templeton (“FT”) has not independently verified, validated or audited such data. Although information has been obtained from sources that Franklin Templeton believes to be reliable, no guarantee can be given as to its accuracy and such information may be incomplete or condensed and may be subject to change at any time without notice. The mention of any individual securities should neither constitute nor be construed as a recommendation to purchase, hold or sell any securities, and the information provided regarding such individual securities (if any) is not a sufficient basis upon which to make an investment decision. FT accepts no liability whatsoever for any loss arising from use of this information and reliance upon the comments, opinions and analyses in the material is at the sole discretion of the user.
Products, services and information may not be available in all jurisdictions and are offered outside the U.S. by other FT affiliates and/or their distributors as local laws and regulation permits. Please consult your own financial professional or Franklin Templeton institutional contact for further information on availability of products and services in your jurisdiction.
Issued in the U.S. by Franklin Distributors, LLC, One Franklin Parkway, San Mateo, California 94403-1906, (800) DIAL BEN/342-5236, franklintempleton.com – Franklin Distributors, LLC, member FINRA/SIPC, is the principal distributor of Franklin Templeton U.S. registered products, which are not FDIC insured; may lose value; and are not bank guaranteed and are available only in jurisdictions where an offer or solicitation of such products is permitted under applicable laws and regulation.
_____________________
1. Source: MSCI. The MSCI ACWI Investable Market Index (IMI) captures large, mid- and small-cap representation across 23 developed markets. Indexes are unmanaged and one cannot directly invest in them. They do not include fees, expenses or sales charges. MSCI makes no warranties and shall have no liability with respect to any MSCI data reproduced herein. No further redistribution or use is permitted. This report is not prepared or endorsed by MSCI.


