by Jim McDonald, Chief Investment Strategist, Northern Trust
We’ve summited the inflation mountain – and are heading back down.
OUTLOOK
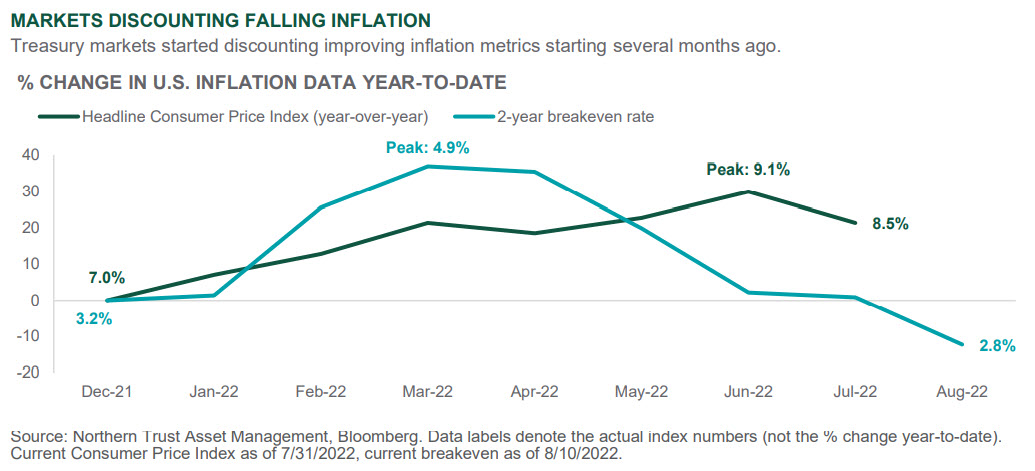
Equity markets have rebounded smartly since mid-June during a period of weak growth and poor sentiment, but solid earnings and what we think is a likely peak in inflation. Better-than-expected earnings reports, coming at a time of extremely poor investor sentiment (a positive contrarian signal) is most likely the catalyst for the better equity market tone. Certainly, the markets have been discounting peak inflation and it appears we may have now seen it. Not only has the U.S. Consumer Price Index (CPI) apparently peaked, but the bond market discounted it months ago (as shown below). Some confirmation also came last week as the Producer Price Index (PPI) actually fell 0.5% in July vs. an expected gain of 0.2%.
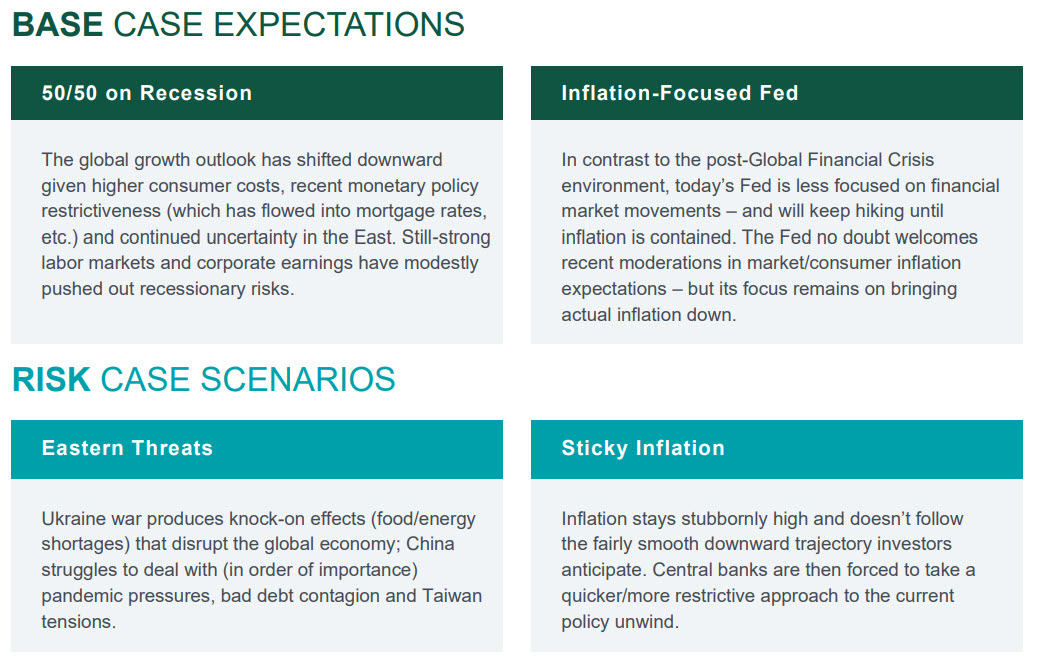
Commodities are leading the price declines. U.S. national gasoline prices have fallen from a peak of $5 a gallon in early June to just under $4 a gallon presently. Global food prices have fallen 12% from their peak, led by a 40% drop in wheat prices as wheat exports from Ukraine have recently resumed. There should also be a depressing effect on prices from slower economic growth and the rapid drop in money supply growth. However, our Sticky Inflation risk case remains a concern due to still-strong labor markets and elevated housing costs. The U.S. labor report for July showed a shockingly high 528,000 jobs added, with average hourly earnings increasing 5.2% and an unemployment rate of just 3.5%. While there was some slowing in housing costs in the July inflation report, they were still up 5.7% over the prior year.
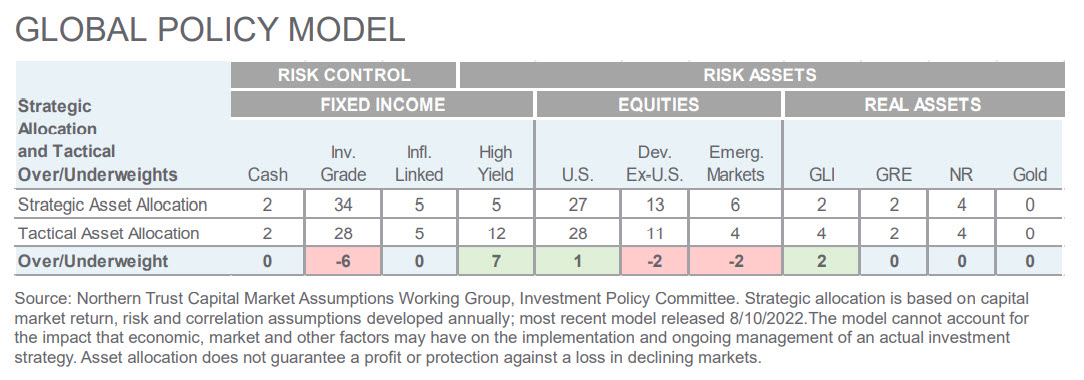
Over the last month, the S&P 500 has increased 11% while the Russell 2000 index of smaller stocks has jumped nearly 16%. Looking forward, we expect a more muted return environment as our base case of 50/50 recession odds works its way into earnings and investor expectations. We also expect the Inflation-Focused Fed to be focused on tighter monetary policy until meaningful progress is made in reducing reported inflation numbers. Core inflation in the U.S. was 5.9% in July, nearly triple the Fed’s target of 2%. Inflationary pressures remain global, with recent inflation reports in both the U.K. and Euro Area near 9%. We made minor adjustments in our Global Policy Model this month, due to the annual changes in our Strategic Asset Allocation. This resulted in a 2% increase to inflation-linked bonds, funded by 1% reductions in investment grade bonds and developed ex-U.S. equities. We expect market volatility to remain high as investors assess the path of inflation and the resulting reaction from global central bankers.
INTEREST RATES
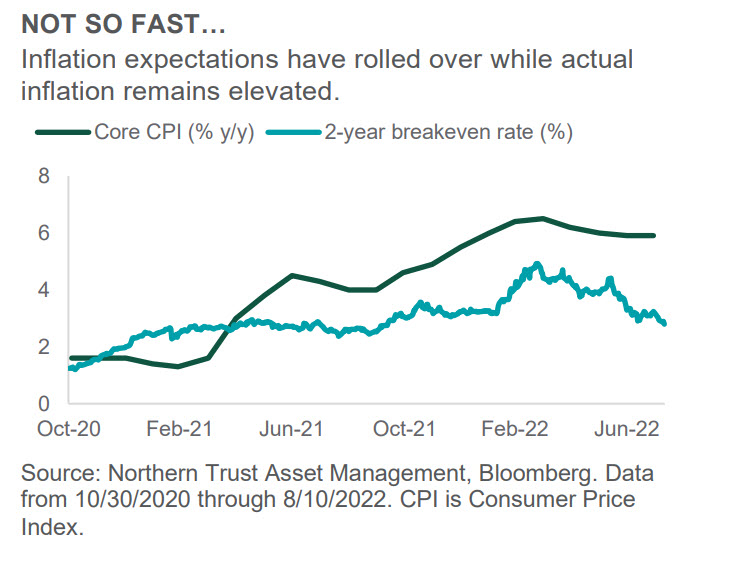
- Interest rates – both real and nominal – have rolled over the past month.
- Inflation expectations have fallen – we think a bit too much.
- We have increased our inflation-linked bond exposure given the better entry point.
After the introduction of Covid-19 vaccines, inflation breakeven rates (market-implied inflation expectations) moved higher as economic re-opening, fiscal stimulus and supply chain woes led to a sizable increase in inflation expectations. Actual inflation proceeded to move up and this year reached a 40-year high as the Russian invasion of Ukraine added fuel to the fire. In response, the Fed has quickly pivoted to fight inflation, raising rates over 200 basis points (with more rate hikes likely to come).
Over the last six months, inflation has remained stubbornly high but breakevens have moved lower. This suggests that the market expects the Fed to be successful in bringing inflation down. Lower commodity prices and a fall in pandemic-related sectors contributed to the declines in the most recent inflation print for July (with headline and core inflation surprising to the downside). Still, consumers are still feeling high prices across the economy, and trimmed mean inflation measures are showing stickiness. The Fed has stated it will be data-dependent, which means several weak inflation prints are needed for the central bank to pump the brakes on tightening. Inflation may have peaked, but there is risk that its decline takes longer than expected, bolstering the case for inflation-protected securities.
CREDIT MARKETS
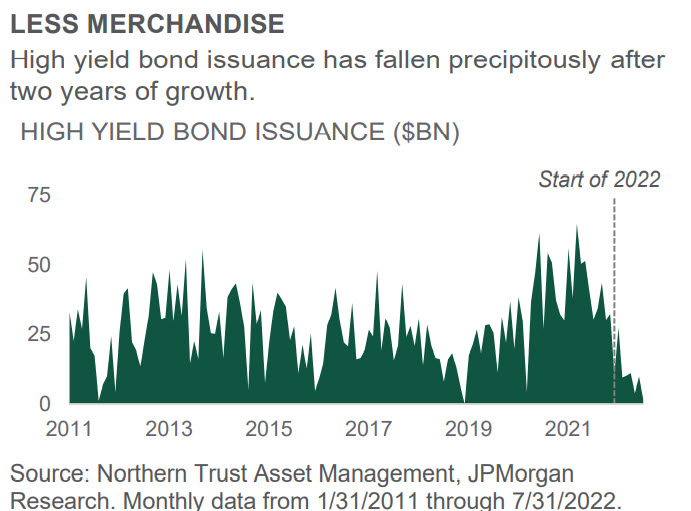
- Lower high yield bond issuance has created a favorable technical environment.
- Solid fundamentals should be able to weather any recessionary storms fairly well.
- High yield remains our largest overweight position.
Besides fundamentals, technicals can be important drivers of performance. High yield new issuance has been low this year (see chart). The $1.8 billion of July issuance was the lightest activity of the past decade aside from December of 2018. Year-to-date total issuance is now down 78% versus over the same period a year ago. The lack of issuance has been driven by not only heightened uncertainty and higher funding costs, but also by a lack of need from issuers to come to market – given the benign amount of high yield debt maturing over the next several years due to the robust amount of refinancing over the prior couple of years.
As a result of limited new supply and the higher income generation component of the asset class, cash balances for high yield funds have increased to around 4%, the highest level since the first quarter of 2020 and 60 basis points above the long-term average. Another factor contributing to the overall supply dynamic is the surge in rising star activity having led to a more than $115bn contraction in bonds outstanding in 2022. We expect an additional $200bn by the end of 2023, of which 50% might occur in the second half of this year. This supply/demand dynamic of higher cash balances and lack of supply should continue to be supportive of the high yield asset class.
EQUITIES
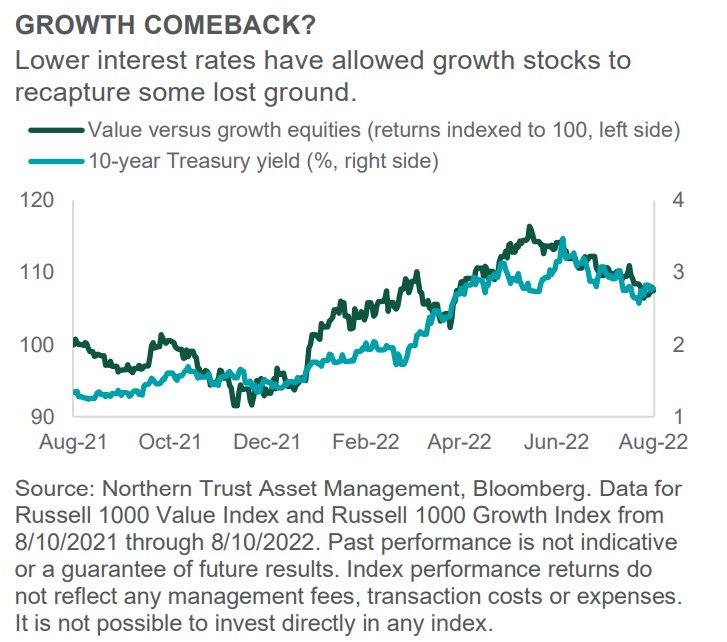
- Global equities have had a nice run of late, thanks to better-than-feared earnings and lower interest rates.
- A reversal in recent value outperformance would favor U.S. equities over European equities.
- We remain modestly underweight global equities despite a small U.S. overweight.
Investor sentiment turned around over the past month as a strong earnings season and fall in inflation expectations trumped worries over tight monetary policy and risk of recession. Global equity markets were up meaningfully with developed markets strongly outperforming emerging markets (EM). Within developed markets, U.S. equities modestly outperformed while weakness in China was the main factor behind EM’s relative weakness. As long-term interest rates continued to drift lower alongside the price of oil, growth once again outperformed value (see chart), although growth is still lagging quite a bit year-to-date.
Second quarter earnings season has largely wrapped up, with earnings in developed markets better than forecasts and corporate outlooks not as bad as feared. Consensus expectations have drifted lower to account for the expected economic slowdown, including in internet advertising, semiconductors and consumer goods margins. We are more conservative than consensus for next year, more directly incorporating the increasing odds of a shallow recession. As such, given the recent rally in equities, we see more limited upside in the base case, and have further reduced our non-U.S. allocation leaving us modestly underweight equities despite a small U.S. overweight.
REAL ASSETS
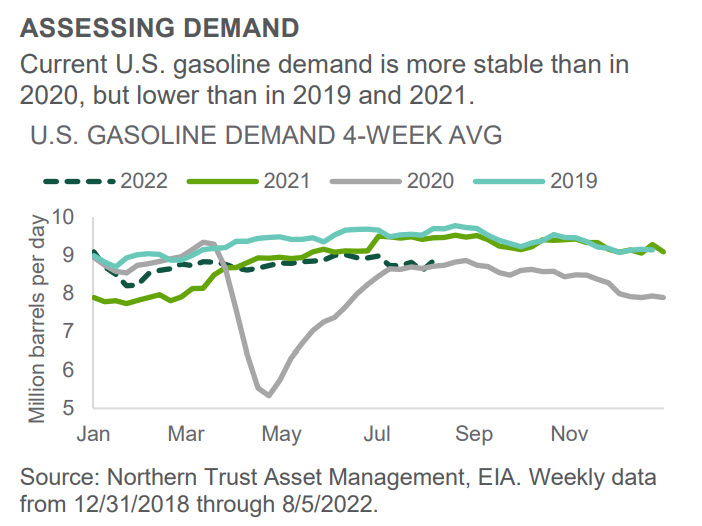
- Commodity supply shocks have given way to questions over demand amid recession concerns.
- Gasoline demand seems to be at the same levels it was immediately after the 2020 pandemic drawdown.
- Potential near-term softness but with a constructive long-term outlook warrants a neutral tactical position in natural resources.
With the supply shock in oil markets better understood and worries of future economic softness (possibly recession) coming to the forefront, oil demand – driven in large part by gasoline demand – is coming under greater scrutiny. The nearby chart shows the amount of U.S. gasoline demand this year compared to prior years, including the last year before Covid-19 hit U.S. shores (2019) and the year most impacted by the pandemic (2020). It does seem the 2022 “run rate” more closely resembles that of 2020 after the worst of the pandemic was over. That is to say, gasoline demand has stabilized but at a lower level than both pre-pandemic and that of stimulus-fueled 2021.
No doubt a big part of the lower demand profile is the fact that gas prices now sit around $4, versus ~$2.50 in 2019 and ~$3 in 2021. Indeed, the current $4 is well off the $5 mark hit just two months ago in mid-June. Should the global economy continue to slow as we expect, we could see further price reductions. However, given how tight the global supply/demand equation is at present, we are just a geopolitical disruption away from another oil price spike. All said, when we consider our slower growth outlook in the context of currently tight commodity markets, we believe a neutral tactical position in natural resources makes sense.
- Jim McDonald, Chief Investment Strategist
IN EMEA AND APAC, THIS PUBLICATION IS NOT INTENDED FOR RETAIL CLIENTS
© 2022 Northern Trust Corporation.
The information contained herein is intended for use with current or prospective clients of Northern Trust Investments, Inc. The information is not intended for distribution or use by any person in any jurisdiction where such distribution would be contrary to local law or regulation. This information is obtained from sources believed to be reliable, and its accuracy and completeness are not guaranteed. Information does not constitute a recommendation of any investment strategy, is not intended as investment advice and does not take into account all the circumstances of each investor. Forward-looking statements and assumptions are Northern Trust's current estimates or expectations of future events or future results based upon proprietary research and should not be construed as an estimate or promise of results that a portfolio may achieve. Actual results could differ materially from the results indicated by this information. Investments can go down as well as up.
Northern Trust Asset Management is composed of Northern Trust Investments, Inc., Northern Trust Global Investments Limited, Northern Trust Fund Managers (Ireland) Limited, Northern Trust Global Investments Japan, K.K., NT Global Advisors, Inc., 50 South Capital Advisors, LLC, Belvedere Advisors LLC and investment personnel of The Northern Trust Company of Hong Kong Limited and The Northern Trust Company.
Issued in the United Kingdom by Northern Trust Global Investments Limited.