
The Bottom Line
Equity markets around the world continue to move higher on “a wall of worry” related to expectations for higher interest rates to be set by monetary authorities. U.S. equity indices continue to lead the trend.
History shows that U.S. equity markets during the second year of the U.S. Presidential cycle after a Democrat wins the White House from a Republican reach a brief peak this week, followed by a brief correction to the end of September followed by resumption of an upward trend to the end of the year.
Economic News This Week
July Canadian Housing Starts released at 8:15 AM EDT on Tuesday are expected to slip to 265,000 units from 273,800 units in June.
July U.S. Housing Starts released at 8:30 AM EDT on Tuesday are expected to slip to 1.540 million units from 1.559 million units in June.
Canadian July Consumer Price Index on a year-over basis released at 8:30 AM EDT on Tuesday is expected to increase 8.4% versus an increase of 8.1% in June.
July U.S. Capacity Utilization released at 9:15 AM EDT on Tuesday is expected to increase to 80.2% from 80.0% in June. July Industrial Production is expected to increase 0.3% versus a decline of 0.2% in June.
July U.S. Retail Sales released at 8:30 AM EDT on Wednesday are expected to increase 0.1% versus a gain of 1.0% in June. Excluding auto sales, July Retail Sales are expected to slip 0.1% versus a gain of 1.0% in June.
June U.S. Business Inventories released at 10:00 AM EDT on Wednesday are expected to increase 1.4% versus a gain of 1.4% in May.
FOMC meeting minutes are released at 2:00 PM EDT on Wednesday.
August Philly Fed released at 8:30 AM EDT on Thursday is expected to drop 5.0 versus a drop of 12.3 in July.
July U.S. Existing Home Sales released at 10:00 AM EDT on Thursday are expected to slip to 4.90 million units from 5.12 million units in June.
July U.S. Leading Economic Indicators released at 10:00 AM on Thursday are expected to drop 0.4% versus a drop of 0.8% in June.
Earnings News the week
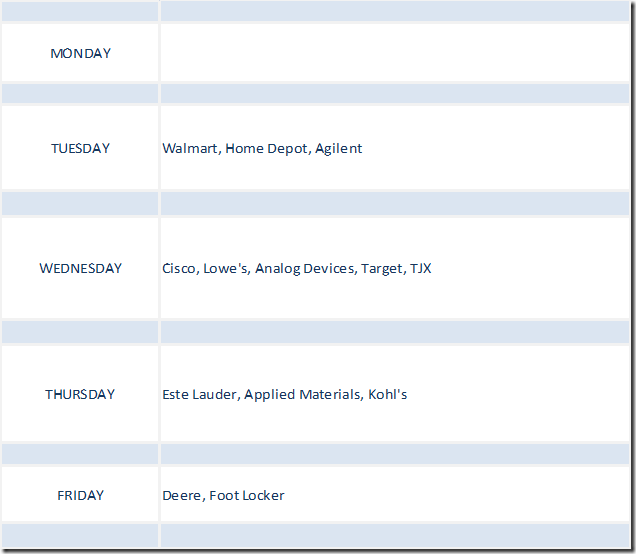
Revenue and earnings outlooks for S&P 500 companies
Next consensus estimates are released by www.Factset.com on September 2nd
Trader’s Corner
Equity Indices and Related ETFs
Daily Seasonal/Technical Equity Trends for August 12th 2022
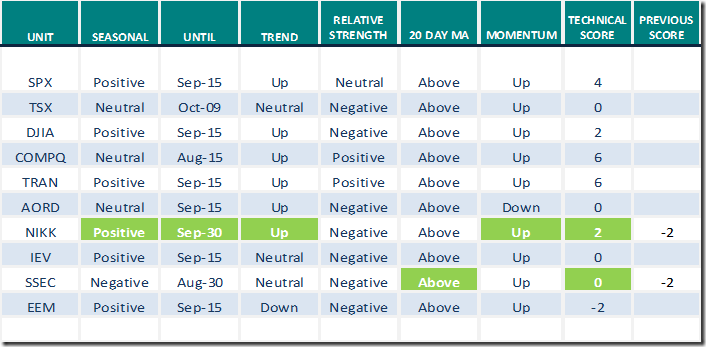
Green: Increase from previous day
Red: Decrease from previous day
Commodities
Daily Seasonal/Technical Commodities Trends for August 12th 2022
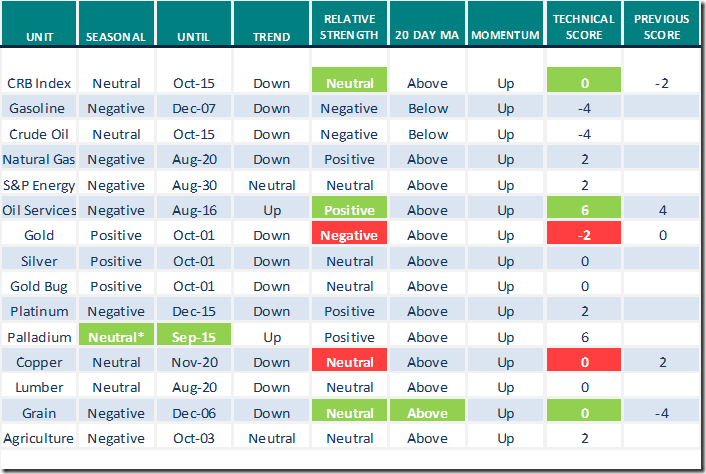
Green: Increase from previous day
Red: Decrease from previous day
Sectors
Daily Seasonal/Technical Sector Trends for August 12th 2021
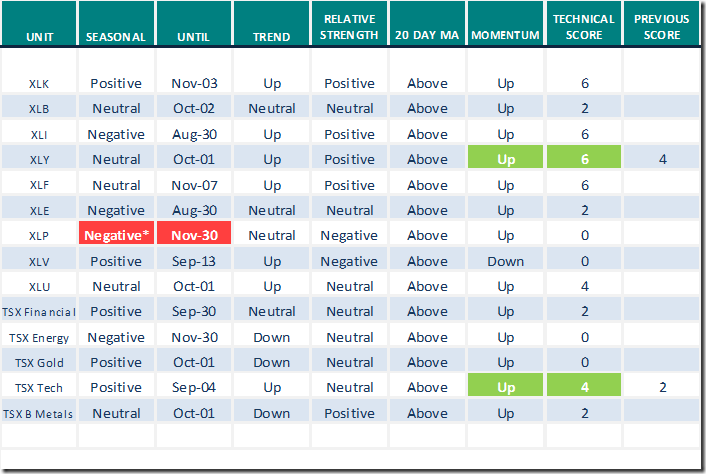
Green: Increase from previous day
Red: Decrease from previous day
*Relative to the S&P 500 Index
Links offered by valued providers
Headline reads “Greatest Crash Ever: Avoid Equities and
Housing Until 2024, Harry Dent Doubles Down”
https://www.youtube.com/watch?v=Rgbcwf6-6Cg
Jeffery Huge says “Time to move to cash”.
Time To Move To Cash | Jeffrey Huge, CMT | Your Daily Five (08.11.22) – YouTube
David Keller says “Russell 2000 tests 200 day moving average”.
Russell 2000 Tests 200-Day Moving Average | David Keller, CMT | The Final Bar (08.11.22) – YouTube
Mark Leibovit says “Energy remains a good long term bet”.
Energy Remains a Good Long Term Bet – HoweStreet
Greg Schnell says “Compelling charts ignore narratives”.
Compelling Charts Ignore Narratives | The Canadian Technician | StockCharts.com
David Keller asks “Can the final bear turn out the lights”?
Can The Final Bear Turn Out the Lights? | The Mindful Investor | StockCharts.com
Tom Bowley asks “Can the stock market overcome this major issue”?
Can the Stock Market Overcome This MAJOR Issue? | Trading Places with Tom Bowley | StockCharts.com
Michael Campbell’s Money Talks for August 13th
August 13th Episode (mikesmoneytalks.ca)
Links from Mark Bunting and www.uncommonsenseinvestor.com
Five reasons why the market hasn’t hit bottom
Five Reasons the Market Hasn’t Hit Bottom – Uncommon Sense Investor
11 Consumer Stocks for Inflationary Times | Kiplinger
10 Stocks for a Recession | Morningstar
Stocks Will Fall Further As Fed Hikes Interest Rates, Mark Mobius Says (businessinsider.com)
Jeremy Grantham Predicts Stocks Will Slump, Trashes Bitcoin, Slams Fed (businessinsider.com)
‘Big Short’ Michael Burry Warns Spending Spree, Stock Rally Won’t Last (businessinsider.com)
Victor Adair’s Trading Desk Notes for August 13th 2022
Trading Desk Notes for August 13, 2022 – The Trading Desk Notes by Victor Adair
Technical Scoop for August 15th
Thank you to David Chapman and www.EnrichedInvesting.com for the link
Technical Scores
Calculated as follows:
Intermediate Uptrend based on at least 20 trading days: Score 2
(Higher highs and higher lows)
Intermediate Neutral trend: Score 0
(Not up or down)
Intermediate Downtrend: Score -2
(Lower highs and lower lows)
Outperformance relative to the S&P 500 Index: Score: 2
Neutral Performance relative to the S&P 500 Index: 0
Underperformance relative to the S&P 500 Index: Score –2
Above 20 day moving average: Score 1
At 20 day moving average: Score: 0
Below 20 day moving average: –1
Up trending momentum indicators (Daily Stochastics, RSI and MACD): 1
Mixed momentum indicators: 0
Down trending momentum indicators: –1
Technical scores range from -6 to +6. Technical buy signals based on the above guidelines start when a security advances to at least 0.0, but preferably 2.0 or higher. Technical sell/short signals start when a security descends to 0, but preferably -2.0 or lower.
Long positions require maintaining a technical score of -2.0 or higher. Conversely, a short position requires maintaining a technical score of +2.0 or lower
Changes Last Week
Technical Notes released for Friday
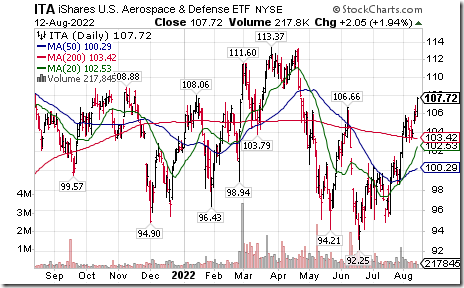
Aerospace & Defense iShares $ITA moved above $106.66 extending an intermediate uptrend.
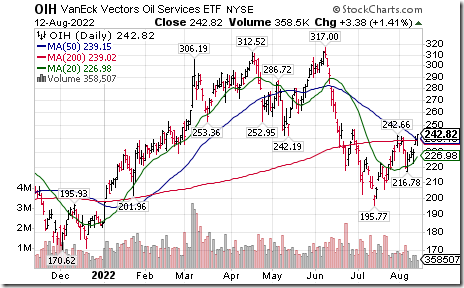
Oil services ETF $OIH moved above 242.66 setting an intermediate uptrend.
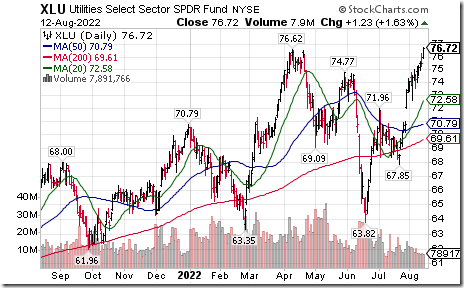
Utilities SPDRs $XLU moved above $76.62 to an all-time high extending an intermediate uptrend.
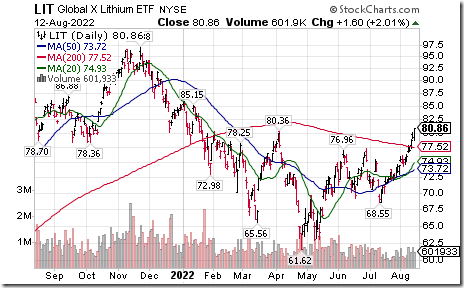
Lithium ETN $LIT moved above $80.36 extending an intermediate uptrend.
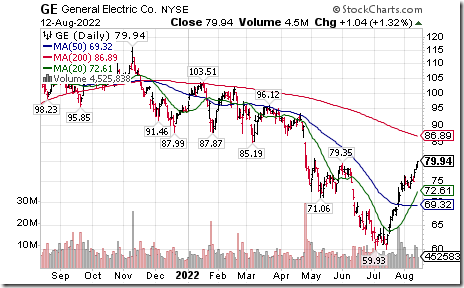
General Electric $GE an S&P 100 stock moved above $79.35 extending an intermediate uptrend
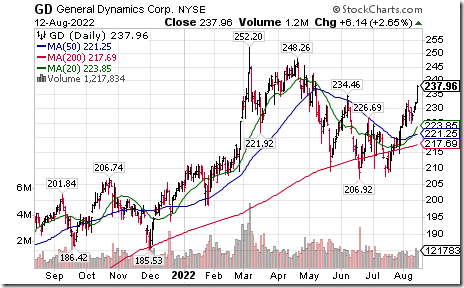
General Dynamics $GD an S&P 100 stock moved above $234.46 extending an intermediate uptrend
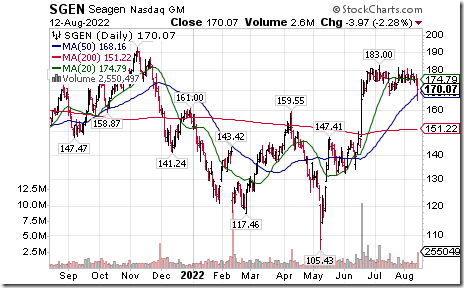
Seattle Genetics $SGEN a NASDAQ 100 stock moved below $167.51 completing a double top pattern.
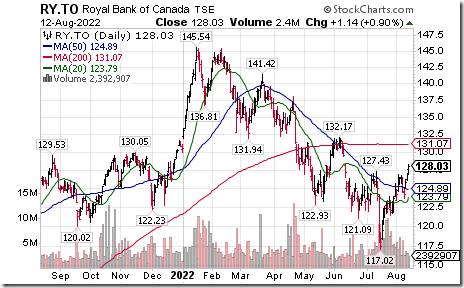
Royal Bank $RY a TSX 60 stock moved above $127.43 extending an intermediate uptrend.
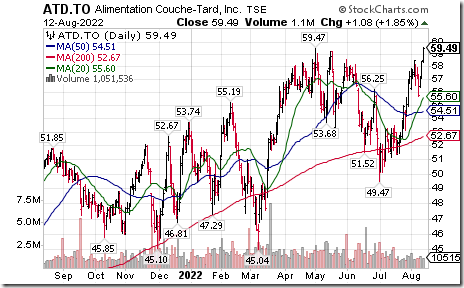
Couche Tard $ATD.TO a TSX 60 stock moved above $59.47 to an all-time high extending an intermediate uptrend.
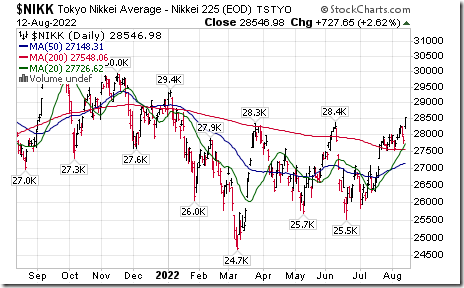
The Nikkei Average moved above 28,389.75 setting an intermediate uptrend.
Special report: Technical outlook for the S&P 500 Index and TSX Index for at least the next six months
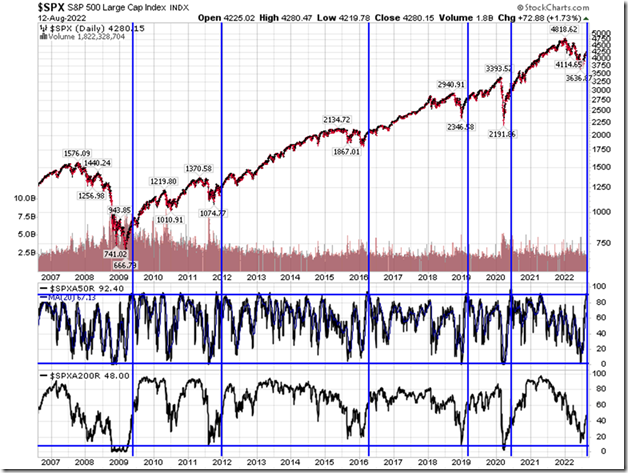
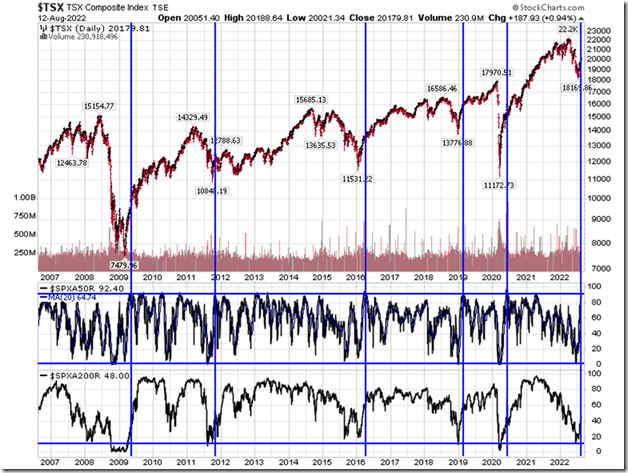
Technical prospects for North American stock market remain favourable despite recent gains by broadly based North American equity indices. The S&P 500 Index has gained 13.7% from its deeply oversold levels on June 17th. Percent of S&P 500 stock trading above their 50 day moving average recovered from an extremely oversold level at 0.80% to an extremely overbought level at 92.4%. During the same time frame Percent of S&P 500 stocks trading above their 200 day moving average increased from an extremely oversold level at 12.00% to a neutral level at 48.00%. These conditions are rare: They have occurred only on five occasions since 2009. On each occasion, the S&P 500 Index continued moving significantly higher for at least the next six months and frequently longer.
Ditto for the TSX Composite Index charts based on their 50 and 200 day moving averages since 2009 (except the TSX 50 day chart has only appreciated from 5% to only75% from its June 17th low). The TSX Composite Index has gained 6.6% from its June 17th low.
Conclusion: Despite technical extreme overbought levels indicated by the S&P 500 Index and TSX Index 50 day moving averages, intermediate upside potential remains attractive.
S&P 500 Momentum Barometers
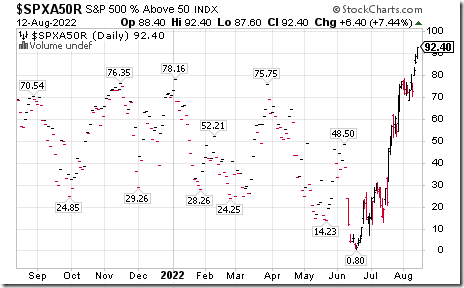
The intermediate term Barometer added 5.40 on Friday and 19.40 last week to 92.40. It remains Overbought. Trend remains up.
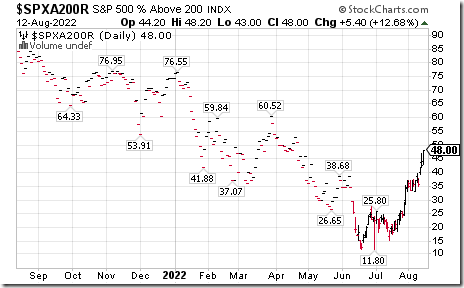
The long term Barometer added 5.40 on Friday and 11.00 last week to 48.00. It changed from Oversold to Neutral on a move above 40.00. Trend remains up.
TSX Momentum Barometers
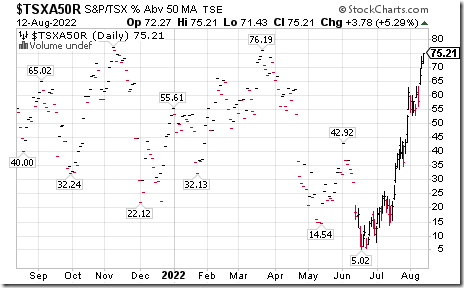
The intermediate term Barometer added 3.78 on Friday and 19.75 last week to 75.21. It changed from Neutral to Overbought on a move above 60.00. Trend remains up.
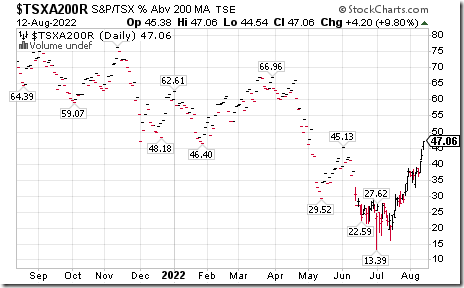
The long term trend increased 4.20 on Friday and 10.08 last week to 47.06. It changed from Oversold to Neutral on a move above 40.00. Trend remains up.
Disclaimer: Seasonality ratings and technical ratings offered in this report and at
www.equityclock.com are for information only. They should not be considered as advice to purchase or to sell mentioned securities. Data offered in this report is believed to be accurate, but is not guaranteed