


by Rick Rieder, Global CIO, Fixed Income, et al, Blackrock
Most consumers wait for things to go on sale before buying them, look for promo codes prior to purchasing something online, and suggest that discounts are the greatest influence on their purchase decisions around the holidays (see, for example, Invesp, as of May 10, 2022, and The Street, as of December 17, 2021). Such behavior isn’t entirely surprising to students of economic theory; perhaps the most fundamental concept in economics is that lower prices attract more buyers. However, when it comes to financial assets, such intuitive logic sometimes gets turned on its head – discounts can beget more sellers.
Almost every month this year, the “discounts” on financial assets from their year-end 2021 prices have gotten larger, leaving the S&P 500 with its worst first half-of-the-year return since 1962 (narrowly avoiding its worst first half since the Great Depression). The U.S. Treasury index has never had such a poor first half-of-the-year return since its inception in 1973, and by some measures the 10-Year U.S. Treasury note has, astoundingly, experienced its worst first half since 1788, at least according to Deutsche Bank research as of July 1. Household names like Visa bonds and the ARK fund are “35% off” and “75% off” their 2021 prices, respectively, yet market participants do not seem to be attracted to these assets the way consumers are drawn to discounted t-shirts or televisions (see Figure 1).

Economists, however, do have an answer to this apparent paradox of crowd behavior between discounts in retail and financial assets: loss aversion theory. It suggests that the reason for a transaction is the need to either gain pleasure or avoid pain. Buying goods on sale gives pleasure (even if they depreciate), while selling financial assets at a loss avoids the pain of further losses (even if there is appreciation potential). In both cases, it feels better when there is a crowd accompanying you. In May 2021 we wrote about how crowd-following could run counter to basic investment philosophy (see Figure 2), albeit at a very different time for markets:
“Investors generally want to “buy low, sell high:” to buy more bonds at higher yields (lower prices) and fewer bonds at historically low yield levels. However, what investors often need to do is to meet income requirements in order to match liabilities. Hence, they are often forced to buy more bonds at lower yields (to raise sufficient dollars of future annual income), such that they end up being overweight when yields are at their lowest. Over the last decade, the Bloomberg U.S. High Yield Index has traded in a yield range of about 4% to 12%, and both those extremes have come during the pandemic period. At a 4% yield, an investor may want to own no high yield at all, but they may need to own a lot of it.”
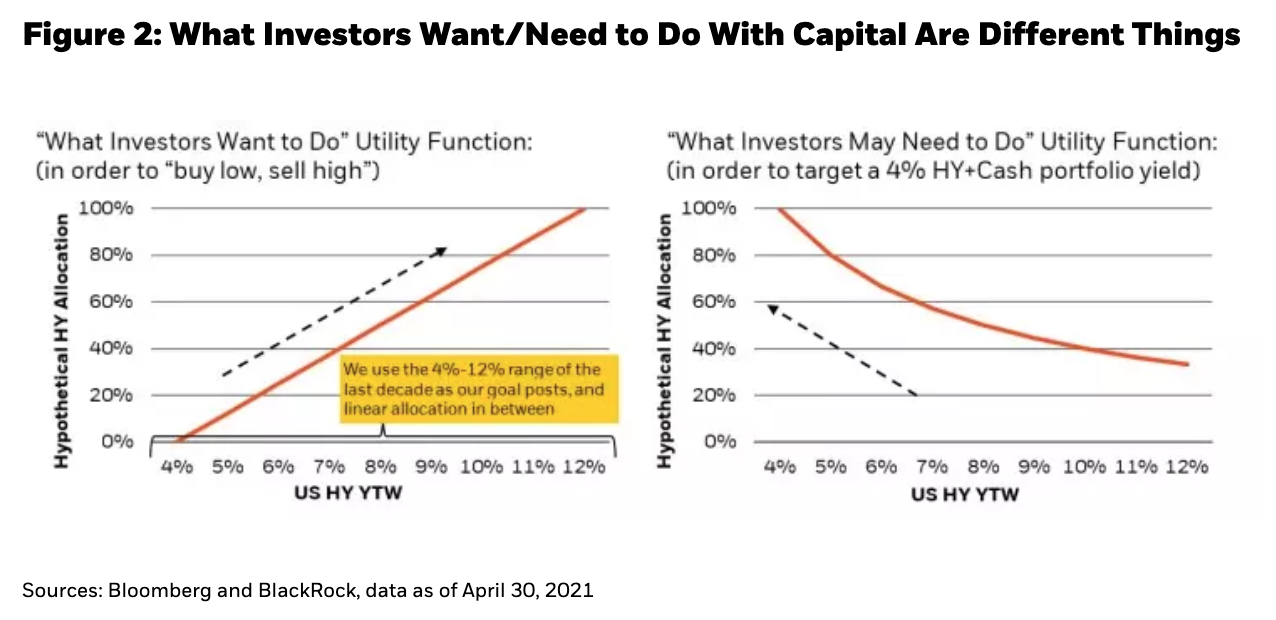
We were amazed by the degree to which investors’ needs dominated the market last year, against our fears of high yield prices that were too high amid surging policy liquidity. Today, the reverse is true – loss-averse or liability-driven investors may either need to stem losses in high yield or upgrade income streams, even at 8% to 9% yields that are more than double what they were a year ago.
However, for assets that pull to par, the probability of making money over a year is often highest when the uncertainty of losing money tomorrow is also the highest (i.e., you’re supposed to be buying when there’s “blood in the streets”). While it seems like a simple concept, it also means a lot of losses have already been sustained. Buyers of U.S. credit, as well as a variety of other fixed income assets, are breathing rarefied air today – at current prices, the probability of loss over the coming year is in the single digits for U.S. high yield, meaning the probability of gain is greater than 90%, according to our analysis (see Figure 3).

Of course, the prices of financial assets haven’t cheapened without reason. The growth, inflation, and policy environment in 2022 is starkly different from the rosy outlook of 2021. The goods side of the economy is operating well below average this year, stymied by supply chain bottlenecks and a goods-consumption hangover after the pandemic binge. Services consumption, which suffered during the pandemic, is conversely doing relatively well in conjunction with pent-up reopening demand, but is also showing some signs of slowing in response to high prices.
Corporate investment is slowing, and the housing market is cooling, engineered by higher prices, tighter policy and economic uncertainty. Still, none of this is enough to justify a major shift toward easier policy - yet. The labor market continues to show surprising strength, with just the slightest early signs of slowing in job openings and reduced hiring in growth-sensitive sectors, such that accelerating inflation continues to pose a bigger threat to the economy than does slowing growth, relative to a policy posture that is still on the wrong side of neutral. So, despite slowing growth at the margin, with unemployment at a historically low 3.46% and inflation at a historically high 9.1%, policy can’t yet pivot.
Navigating the Growth/Inflation Tradeoff
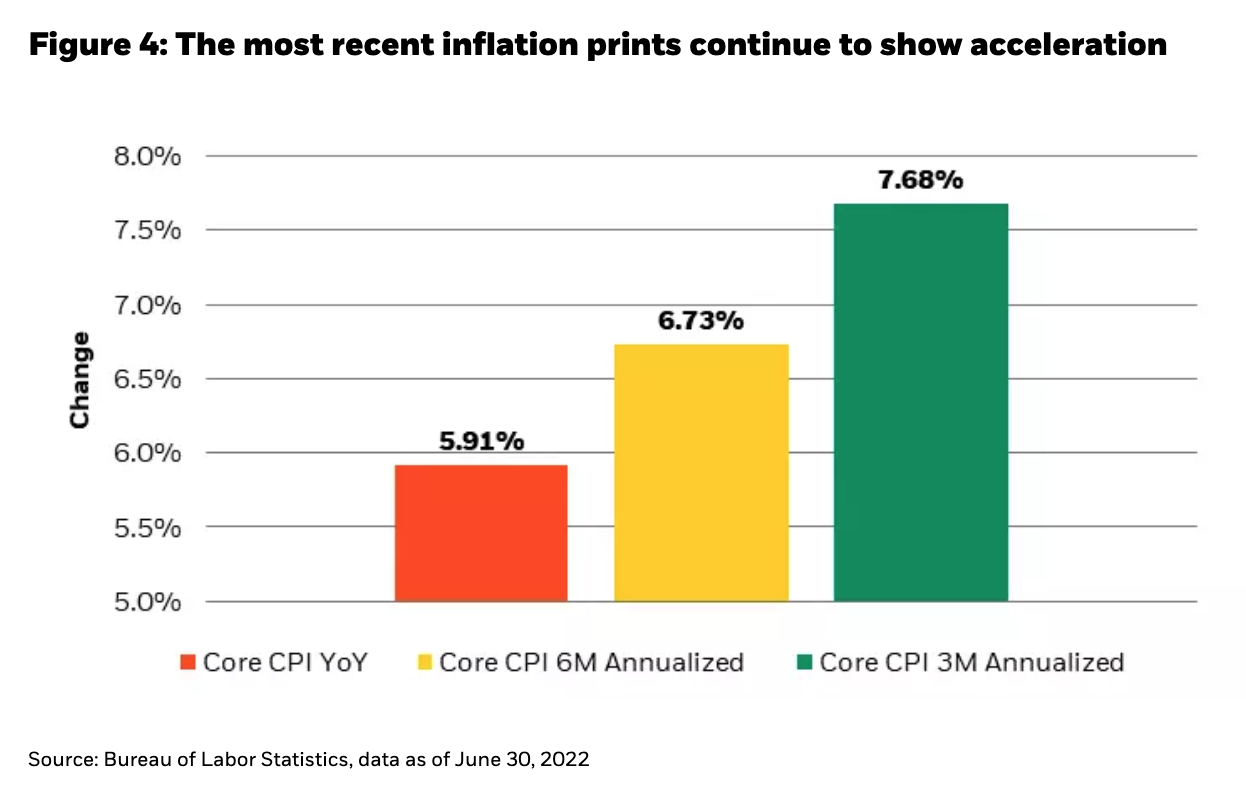
We are confident that high prices are curing high prices by moderating demand and consequently growth. This tug-of-war between contracting growth and high inflation (that is likely to fall, but at a slower pace than growth) could have unique implications for fixed income markets. Sticky high inflation could drive front-end rates higher (in sympathy with policy, see Figure 4), while slowing growth could drive back-end rates lower (as demand for safe assets picks up), resulting in a flat-to-inverted curve, consistent with an over-heated output gap.
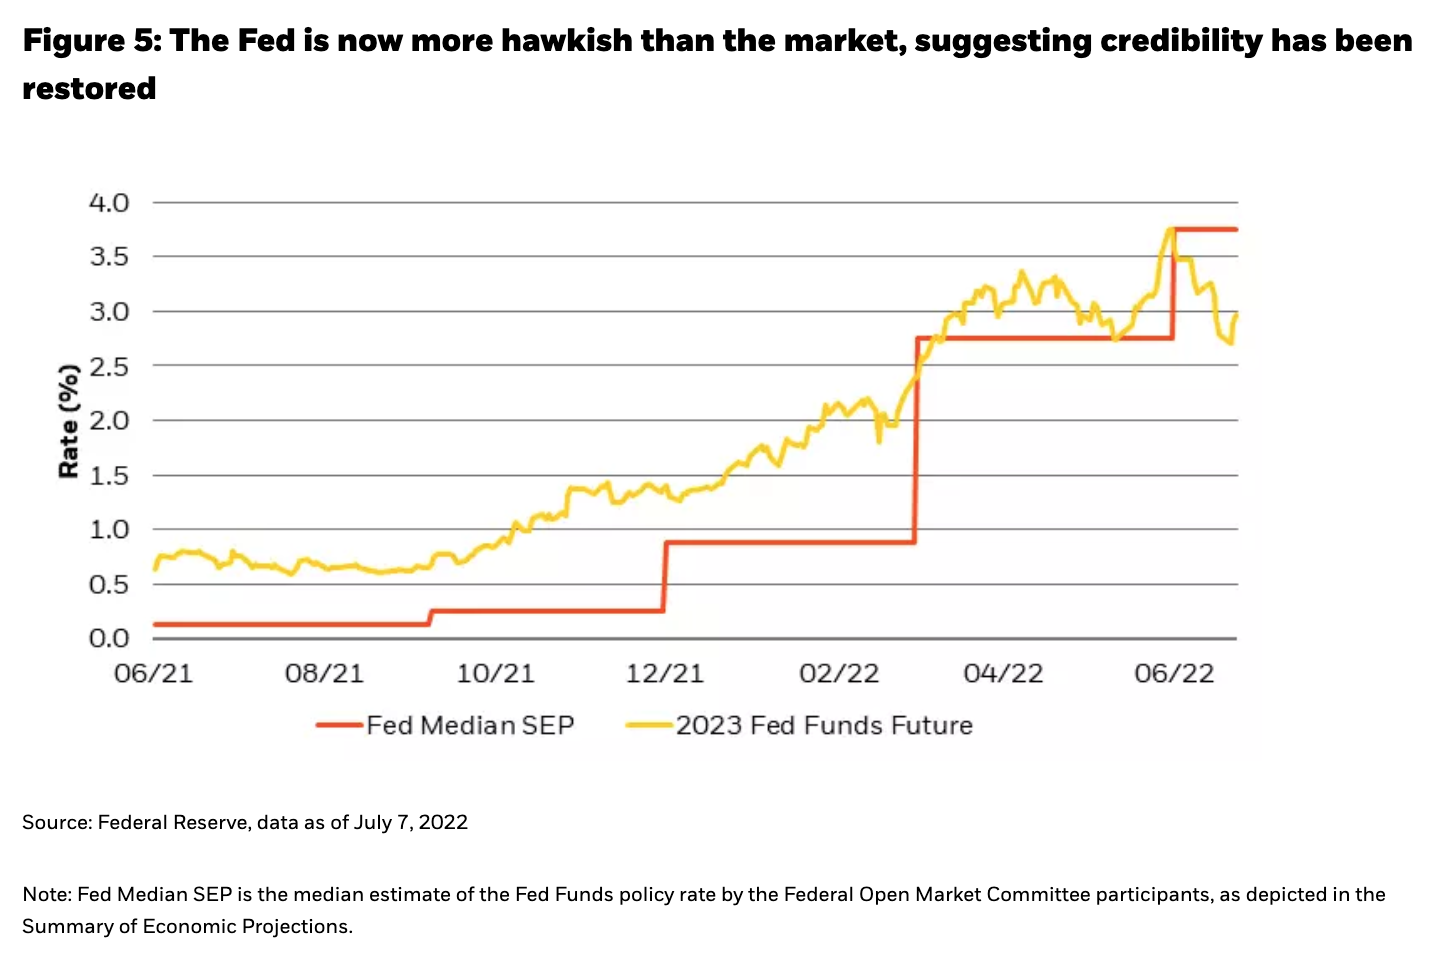
As we argued many times in the past, the Fed waited too long to stop easing and to start tightening, but is proactively tightening financial conditions today. Thus far, markets have been fearful that a tepid Fed that needed to catch up in a hurry would lead to a hard landing for the economy. Yet the Fed has raised its projections to meet market pricing, and now exceeds them for the first time in this hiking cycle. Markets now think the Fed won’t be able to meet its hawkish 2023 median dot, and are actually pricing in 2023 rate cuts, a sign that the Fed’s inflation-fighting credibility has been restored (see Figure 5).
While it’s too early for the Fed to pivot now, it does not have to keep tightening (including withdrawing liquidity) until the fortunes of the private sector plumb the same depths as sentiment. People seem to be in a rotten mood these days, but perceptions of poor systemic health are a far cry from reality. Even after four months of savings drawdown, households still have $2.4 trillion in excess savings, meaning that while consumers are in a terrible mood about “the economy,” it’s not preventing them from having a night out on the town. Indeed, spending at restaurants and bars is 26% above its pre-pandemic peak and well-above its trend of the last two decades.
What might cause the Fed to slow down the pace of tightening?
There are a number of complex, uncertain, and illiquid conditions that suggest that financial markets are in a more fragile state than is the U.S. consumer, and therefore might be the first part of the economy to “break” if this tightening cycle becomes overextended. First, most major currencies other than the U.S. dollar have weakened, and in some cases rather dramatically – and we continue to believe in the anti-fragile nature of U.S. dollars as a portfolio allocation (some of it in cash). Much of the world is still dependent on the USD for trade and commerce: while the U.S. economy is just 15% of world GDP, the dollar makes up two-thirds of emerging market external debt, foreign exchange reserves and global securities issuance, while 70% of world GDP is pegged to the dollar as an anchor currency. That means that when dollars are being withdrawn from the financial system (as financial conditions tighten and liquidity is withdrawn), the “price” of dollars rises in relative terms, as the world is forced to contend with a shrinking supply.
Follow Rick Rieder on Twitter
Other areas of fragility include commodities (including energy) that are showing signs of weakness after a very strong run earlier this year, small business optimism that is closer to levels last seen in 2008 than in 2018, and access to capital markets that is coming at an extremely hefty price for new issuers. This latter point is even more interesting considering that sectors like high yield have already cheapened dramatically, yet there is so little demand for new bonds that they have to be priced at a further 10-point discount in order to enter the market, as per Credit Suisse’s July 2022 research.
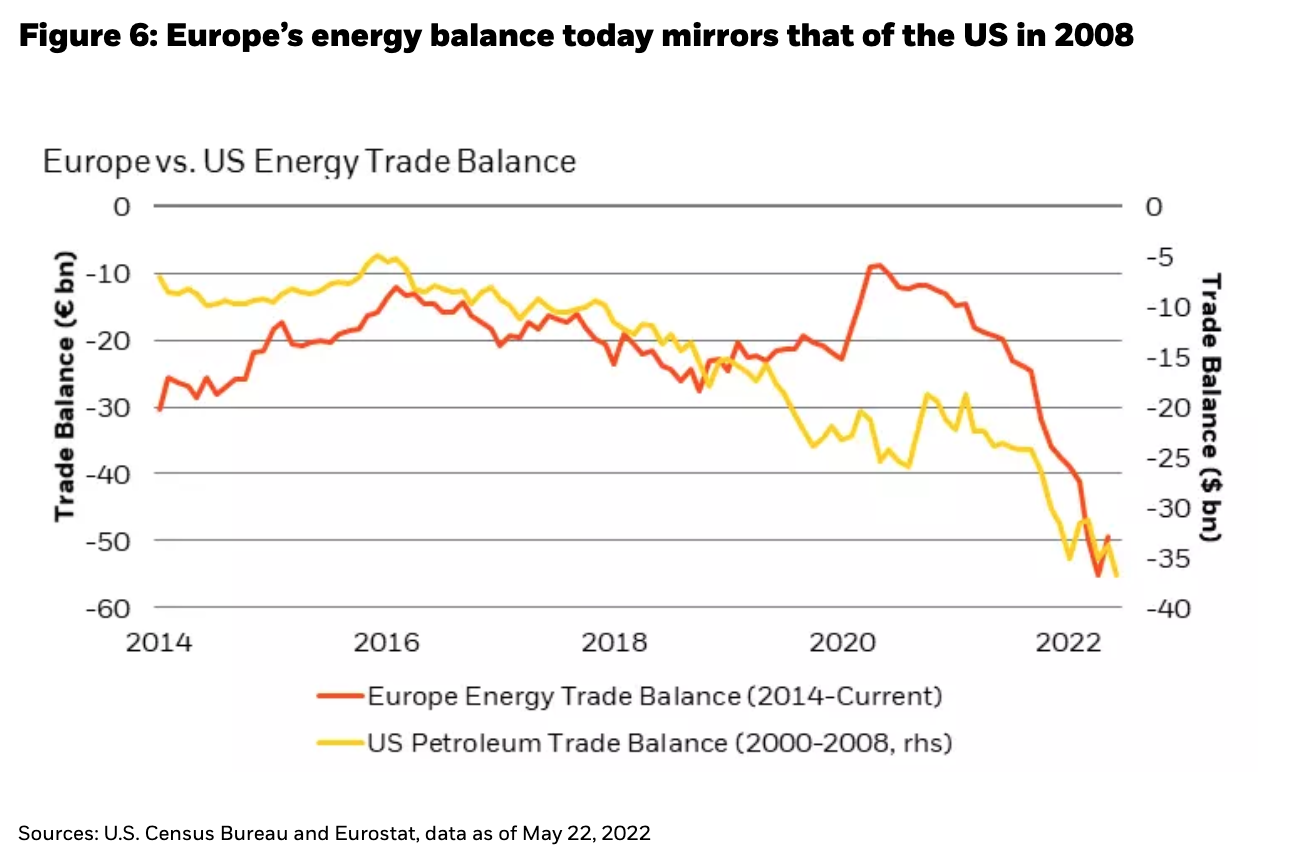
Outside the U.S., the challenges are arguably even more acute. In Europe, uncertainty around the supply of natural gas has driven prices (and hence nominal imports) to record levels. Indeed, high energy prices in Europe can be as crushing to European consumers today as high gasoline prices were to the U.S. consumer in 2008 (see Figure 6). In this context, it is perhaps less surprising that political pressures are building, particularly in more indebted countries, like Italy.
In China, tension between the zero-Covid policy and the country’s official growth target is having some spillover effects in the banking and property sectors. While the high-growth, post-WWII years in the U.S. were driven by consumption, China’s rapid growth in the 2000s was driven by gross capital formation. Zero Covid policies have put an immense strain on both consumption and capital formation, effectively shutting both engines of growth down. Lockdowns have constrained income (and spending) while property price depreciation has strained wealth (especially in second- and third-tier cities). Bad loans and defaults are creeping higher at the same time that the currency becomes less competitive against rival exporters, like Europe and Japan. While the most draconian lockdowns are over (resulting in some bounce-back), investors still need to keep a very close eye on this risk.
How do these risks shape the path of the U.S. economy and monetary policy?
There are three broad potential paths worth evaluating (see Figure 7), at least based on the trajectory of the output gap: 1) policy responds to slowing growth in line with market pricing while the real economy stays resilient, leaving a very shallow negative output gap given today’s elevated starting point (an outcome akin to the 1991 recession); 2) policy that is more aggressive than market pricing and/or growth that ends up less resilient; or 3) policy that is focused on bringing down inflation at all costs, where the cost ends up being a deep recession (an outcome akin to the 1982 Volcker-induced recession).
 While we are not in the business of being “right” about outcomes, if markets are pricing in too high a probability of an extremely dire outcome, it is worth taking the other side. Given the economy’s exceptionally strong starting point, and a series of weaker data in the coming months that should give the Fed reason to slow the pace of tightening, there is a high chance that the economy follows a more benign trajectory (something like the green line in Figure 7). Yet, markets seem to have braced themselves for a much more severe outcome (something closer to the pink or purple line in Figure 7), especially based on the prices of risky assets in fixed income.
So, what are markets pricing in today?
Inflation expectations are down 70 basis points from their peak, right on cue as global real rates have risen to levels in line with long term averages. This “normalization” of the world’s risk-free rate complex is perhaps the first sign that interest rate volatility can start to calm down from historic highs, especially at the front-end. Importantly, markets have yet to retest the 4% policy rate mark that was last seen in June, an important indicator of Fed credibility and hence a calmer rate market.
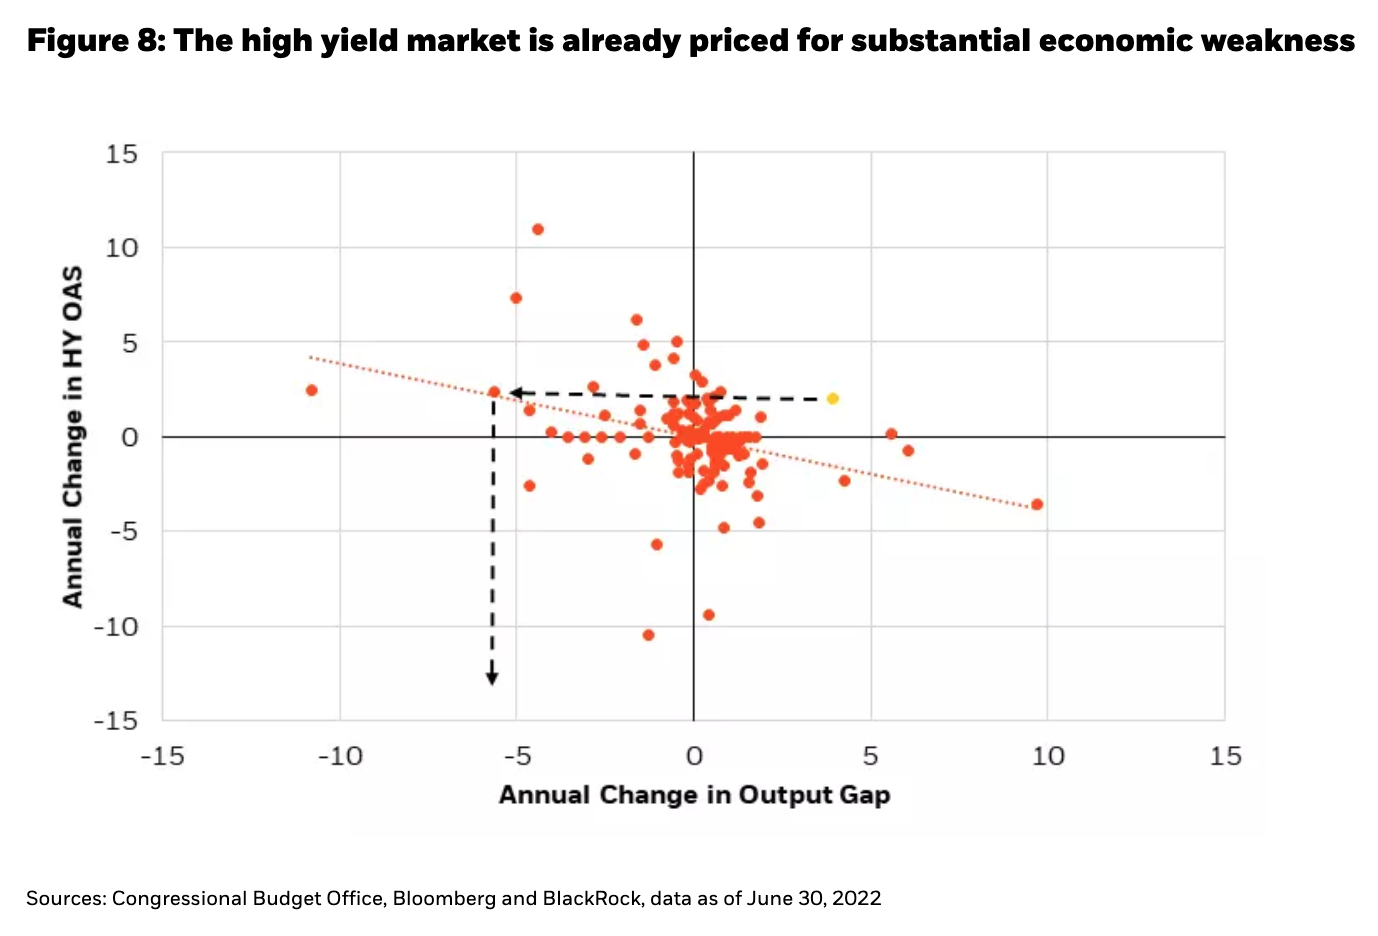
If risk-free rate volatility can be contained, then evaluating risky assets is much easier. It suggests that investors can start participating in some of the “sales” in financial assets, especially in assets with the highest yields in economies with the strongest fundamentals, such as U.S. credit. Indeed, we have just witnessed the fastest ever pricing, by the high yield market, of a significant drawdown in output gap (-6%) relative to the current state of the economy (see Figure 8).
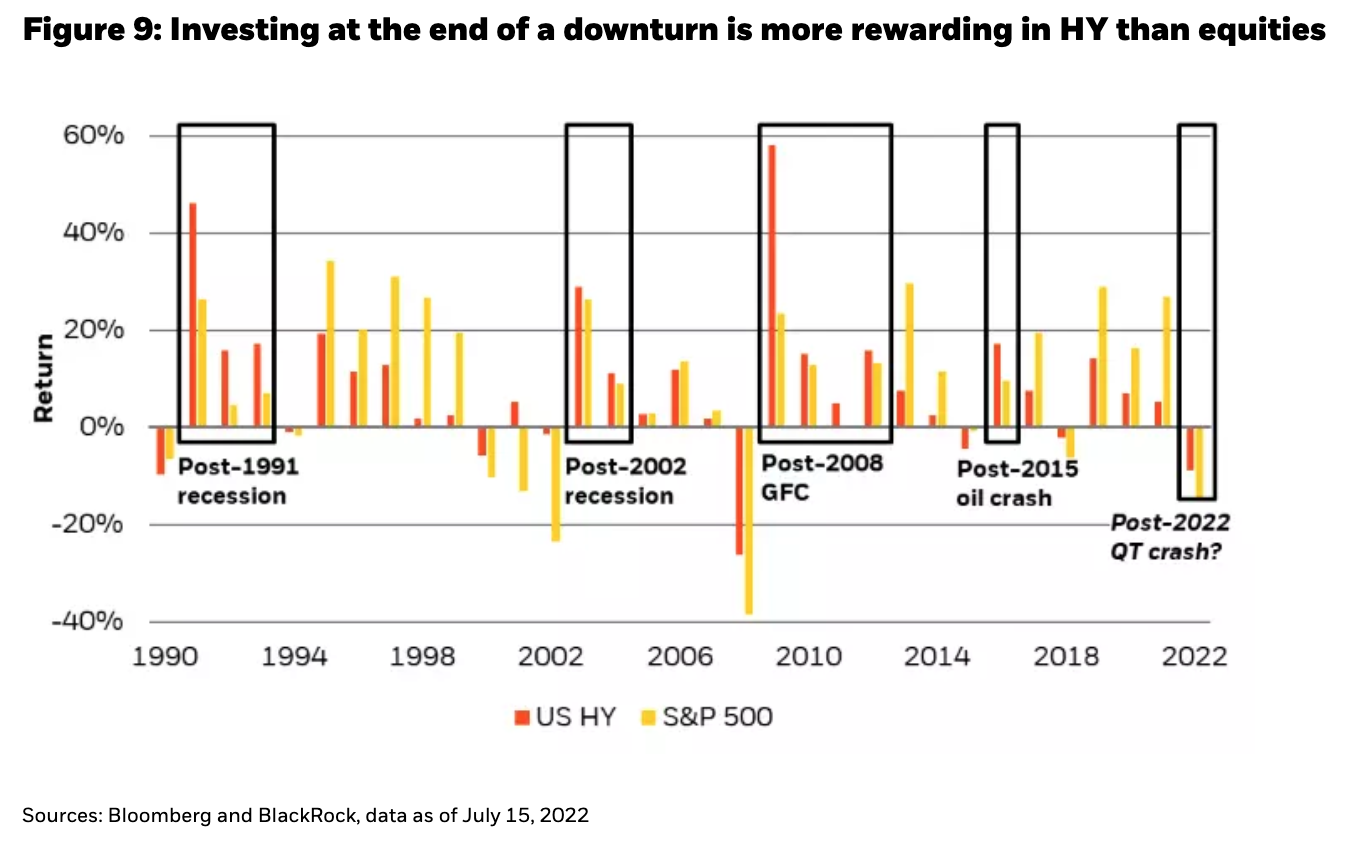
It’s difficult to time the credit cycle perfectly, but when yields are high enough, time, coupon and pull-to-par dynamics are on the investor’s side. We cannot yet eliminate the possibility of a worst-case outcome, and so we cannot yet go all-in on credit markets, but the yields on offer today and the losses sustained this year suggest that we are nearing the end, or at least nearing the beginning of the end of pricing in a severe downturn, and hence a higher probability of elevated forward returns awaits investors who have the wherewithal and endurance to take some risk today. In fact, today’s yield in U.S. high yield is almost as high as the average annual equity return over the last 30 years. History suggests that the skew (best versus worst returns) is better in high yield than in equities, especially from the starting point of a drawdown year (see Figure 9).
However, not all credit markets are created equal in terms of their convexity to economic outcomes. When you go into a store and buy a shirt on sale, you know you get to walk away with the shirt you bought, but in financial markets, you rarely walk away with what you paid for. In Europe and in Emerging Markets, growth, inflation and policy woes are more acute, so with similarly high yields, we think there is not as much need for investors to own risk premiums on top of the already-generous premiums available in U.S. credit markets.
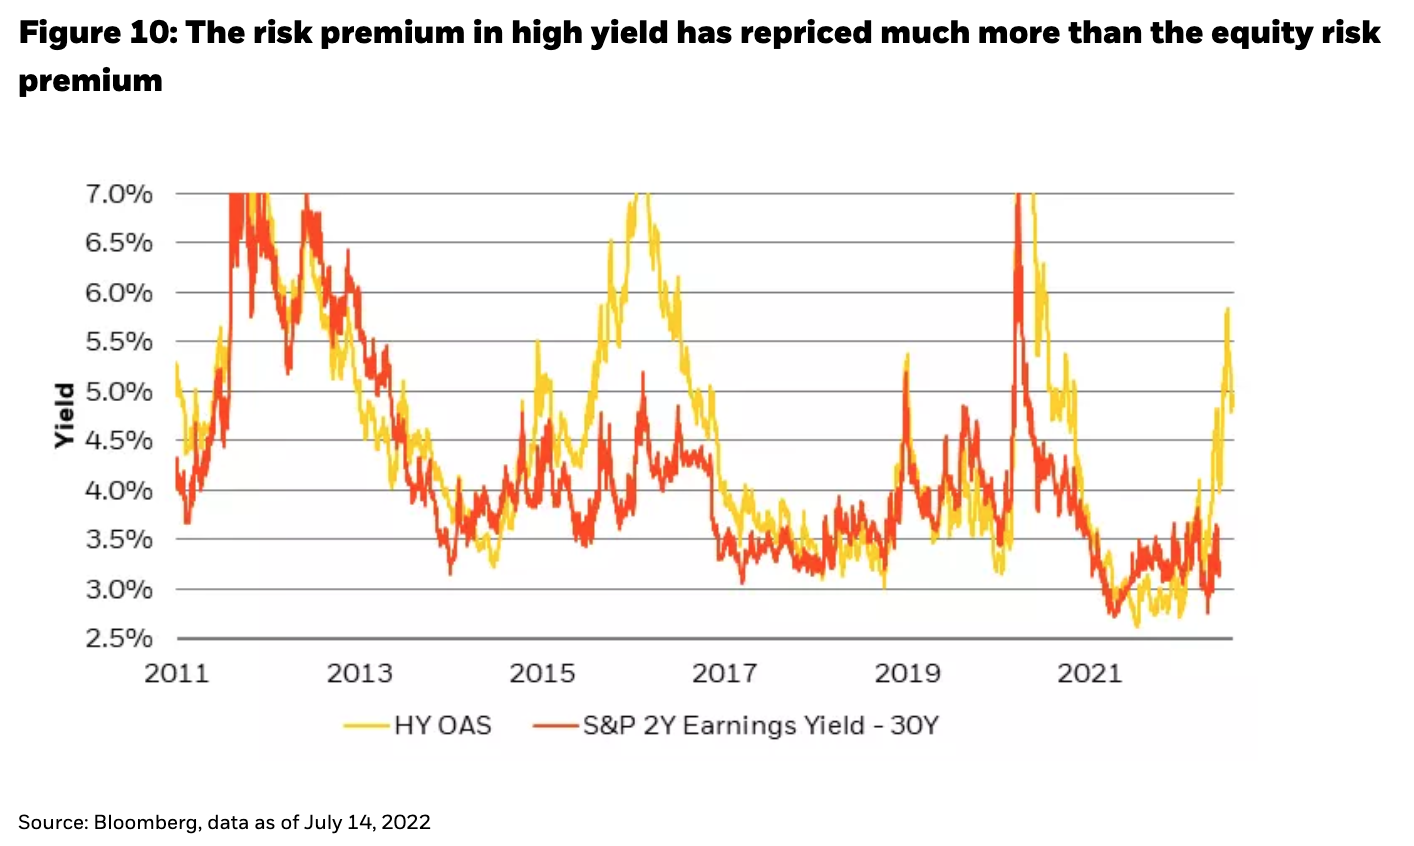
Moving down the capital stack, the equity risk premium has widened considerably less than high yield spreads, despite equity prices falling 20% this year. With limited room for equity valuations to rise, we think investors are better served adding marginal dollars in credit (see Figure 10). Nevertheless, equity sectors have shown incredible dispersion this year (as evidenced by the 52% return differential between the +28% energy sector and the -24% Nasdaq), such that there is enormous opportunity for investors to participate in relative-value trades within equities, in our view.
This disparity in pricing within the risky asset spectrum, amidst a risk-free rate that has also repriced higher (and may be on the verge of stabilizing), leads to a fascinating debate as it pertains to balanced portfolios of stocks and bonds. For many years, both pillars of the 60/40 stock/bond portfolio benefitted from falling risk-free rates (the average return of this portfolio from 2010-2019 was 10%). In fact, in the decade after the Global Financial Crisis, as fixed income yields approached historically low levels, there was talk among investors that the 60/40 portfolio should instead be rebranded 60/20/20 (where 20% of the fixed income allocation should be reallocated to higher yielding Alternatives sectors).
However today, since equity earnings yields have not repriced to the same degree as fixed income yields (and neither have Alts), it might make more sense for the balanced portfolio to be oriented around fixed income, and for the 60/40 allocation to be flipped to a 40/60 allocation (40% equity, 60% fixed income). That would maximize an investor’s exposure to risk-free rates and risky spreads, while preserving most of the diversification benefits and upside convexity inherent in equities. Including alternatives, that allocation may look more like 35/55/10. More tactical portfolios could include a cash allocation taken pro rata out of that, with the exact level of cash determined by the investor’s risk appetite. Besides being one of the best performing major assets this year, with a return slightly above 0%, a cash allocation could be deployed when incoming data provides more certainty, or as still-volatile markets provide opportune entry points to other investment options.
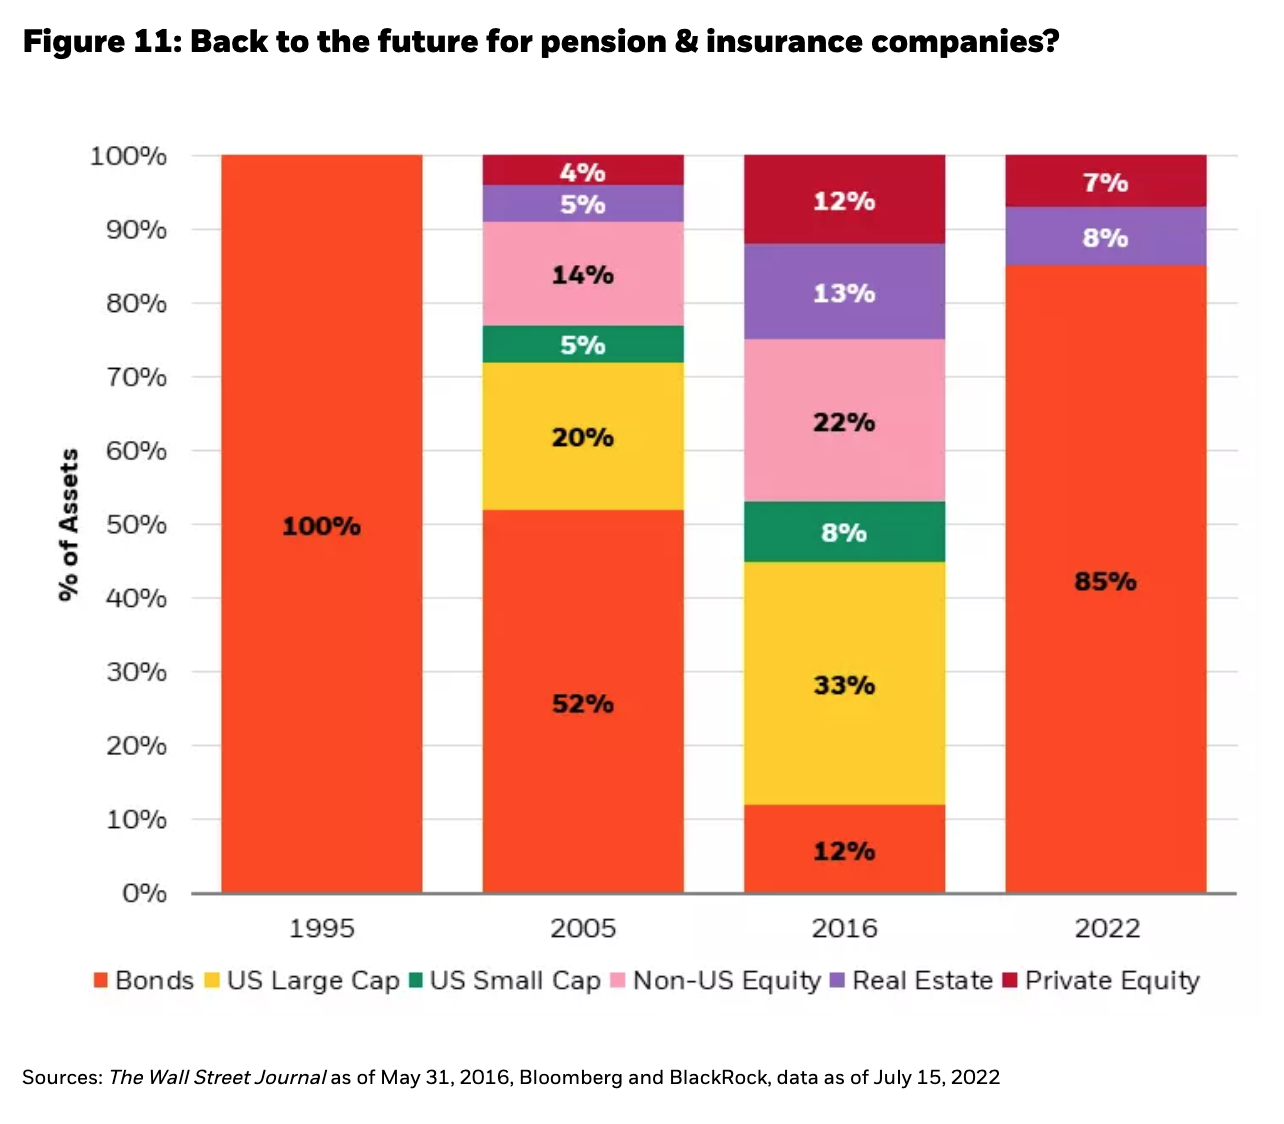
For insurance companies targeting a 7.5% yield, which might have been fully satisfied in fixed income markets in 1995, a fixed income orientation may again work today (see Figure 11), after more than a decade of having to “reach for yield” in a variety of asset classes further down the capital stack. Today, a 50/50 blend of investment grade (IG) and high yield (HY) bonds currently offers a 6.6% yield as represented by the Bloomberg U.S. Corporate Bond Index and U.S. Corporate High Yield Index, and hypothetically if Alts were able to provide around a 11.5% annual return (as they have historically), then that means an 85% FI/15% Alts portfolio would hit the 7.5% target. There is technically no need for an equity allocation – a phenomenon that hasn’t been witnessed in decades. We are not suggesting that investors omit equities from portfolios however, as there are liquidity, diversification and upside benefits to an equity allocation.
The frenzied buying during sales in retailing is driven by transparency around the duration of the sale (often it lasts for a day or two), and the knowledge that prices will revert once the sale is over (such as on Black Friday and Amazon Prime Day). In financial markets, however, the investor must assess the conditions present and orient portfolios around assets that are closest to the “end of the sale” without knowing when exactly that moment will be. Today, we believe it is time to be overweight assets that are closest to the end of the sale – and thus we have a large overweight in fixed income.
*****
 Rick Rieder
Managing Director, is BlackRock’s Chief Investment Officer of Global Fixed Income and is Head of the Global Allocation Investment Team
 Russell Brownback
Managing Director, is Head of Global Macro positioning for Fixed Income
 Trevor Slaven
Managing Director, is a portfolio manager on BlackRock’s Global Fixed Income team and is also the Head of Macro Research for Fundamental Fixed Income
 Navin Saigal
Director, is a portfolio manager and research analyst in the Office of the CIO of Global Fixed Income, and he serves as Chief Macro Content Officer