
by Abhishek Ashok, M.A., MFE, CFA®, Analyst, AGF Investments Inc.
Investors probably don’t need to be told that markets are extra volatile right now. That should be obvious to almost anyone experiencing the extreme ups and downs that have characterized the investment landscape so far this year. But not everyone may know that today’s volatility rivals some of the most turbulent periods in recent market history or that it may not reflect the current economic reality.
In fact, based on our factor analysis, intraday moves in equities over the past few months rank with those that happened during the first few months of the COVID-19 pandemic in 2020 and the Global Financial Crisis in 2008 and 2009. More specifically, the daily return spread between high and low beta stocks has been greater than one standard deviation (plus or minus) for more than two-thirds of trading days this year, and for more than 70% of trading days since the beginning of March. Furthermore, based on this gauge of volatility, both March and May 2022 represent two of the 10 most turbulent months since the end of 2000. (See illustration)
What’s strange about this level of factor volatility is the fact that previous bouts of the same magnitude typically occurred around major market meltdowns that coincided with severe recessions. Yet, that’s not quite the backdrop today. While most major indexes are down considerably on fears of recession, economic growth remains positive to date and Purchasing Manager Indexes (PMIs) around the world continue to suggest only a slowdown in the business cycle, not a full-scale contraction.
Interestingly, our subsequent analysis of factor performance also indicates that markets are pricing in a more severe economic slowdown than is currently the case. In fact, the year-to-date outperformance of the lowest volatility stocks relative to the highest volatility stocks is close to 20%, while, similarly, the lowest beta stocks have outperformed the highest beta stocks by almost 30%.
Top 10 Most Volatile Months
Beta Factor Performance: % of trading days with moves of one standard deviation (+,-) or more
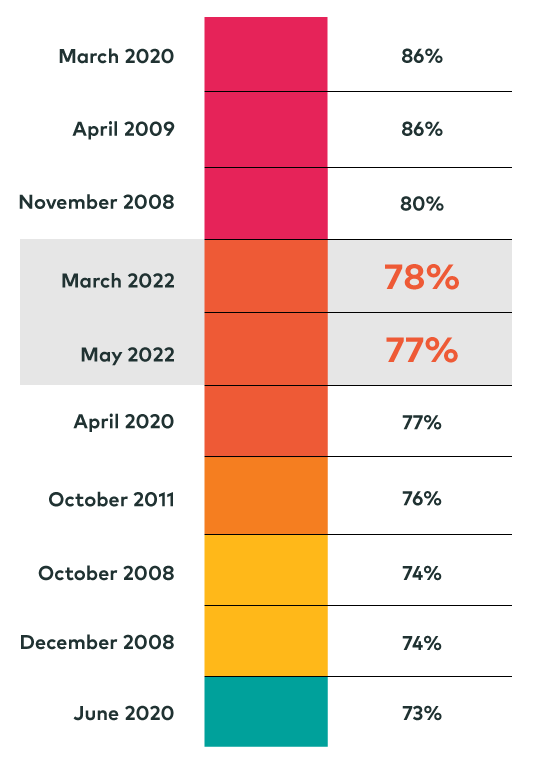
Source: AGFiQ using data from FactSet as of May 31, 2022. Factor performance represents the return spread between the highest and lowest beta stocks among the largest 1100 securities in the United States based on market capitalization. (For full data set, see chart below)
Clearly, then, markets are today more volatile than usual, but whether they remain so continues to be a question. As we’ve noted in previous blogs in this series, extreme conditions often signal inflection points that end up limiting future gains of current outperformers and boosting those areas of the market that have underperformed. Yet given the ongoing uncertainty about the economy in a climate of historically high inflation rates and rising interest rates, a pivot like that – if it were to happen – could be short-lived.
As such, a barbell approach that focuses on the higher-quality segments of the factor spectrum may be an appropriate way to manage what is expected to be another tumultuous few months for investors.
Beta Factor Performance: % of trading days with moves of one standard deviation (+,-) or more – Full chart
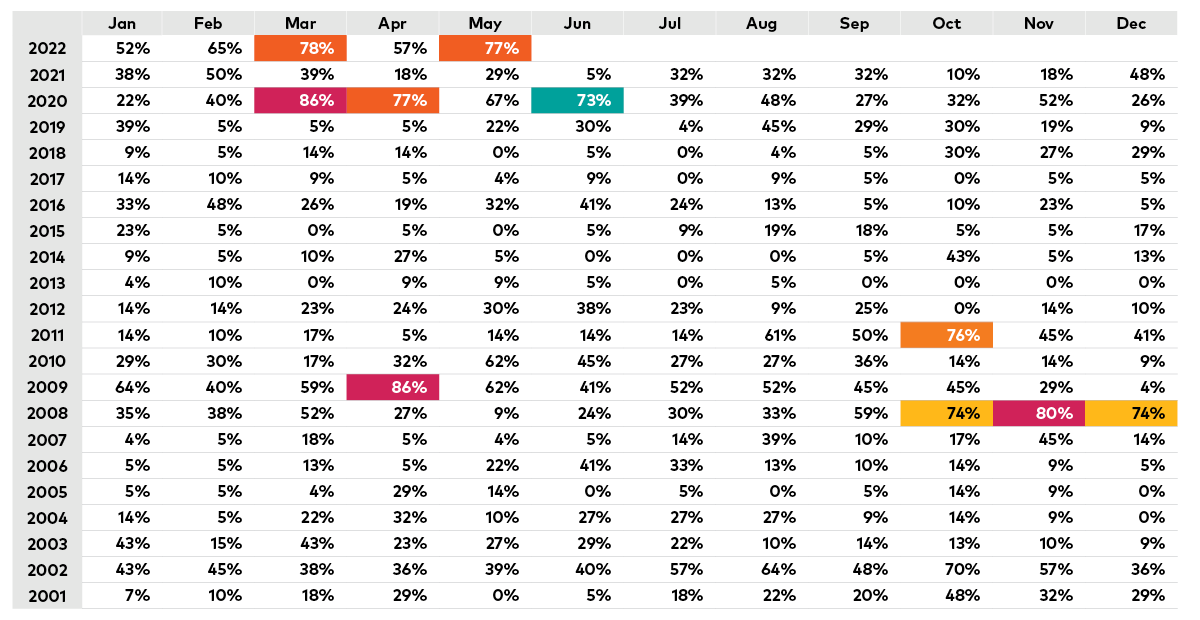
Source: AGFiQ using data from FactSet as of May 31, 2022. Factor performance represents the return spread between the highest and lowest beta stocks among the largest 1100 securities in the United States based on market capitalization.
Click to learn more about our Quantitative capabilities.
The views expressed in this blog are those of the authors and do not necessarily represent the opinions of AGF, its subsidiaries or any of its affiliated companies, funds, or investment strategies.
The commentaries contained herein are provided as a general source of information based on information available as of June 16, 2022 and are not intended to be comprehensive investment advice applicable to the circumstances of the individual. Every effort has been made to ensure accuracy in these commentaries at the time of publication, however, accuracy cannot be guaranteed. Market conditions may change and AGF Investments accepts no responsibility for individual investment decisions arising from the use or reliance on the information contained here.
References to specific securities are presented to illustrate the application of our investment philosophy only and do not represent all of the securities purchased, sold or recommended for the portfolio. It should not be assumed that investments in the securities identified were or will be profitable and should not be considered recommendations by AGF Investments.
AGFiQ is a quantitative investment platform powered by an intellectually diverse, multi-disciplined team that combines the complementary strengths of investment professionals from AGF Investments Inc. (AGFI), a Canadian registered portfolio manager, and AGF Investments LLC (AGFUS), a U.S. registered adviser.
AGF Investments is a group of wholly owned subsidiaries of AGF Management Limited, a Canadian reporting issuer. The subsidiaries included in AGF Investments are AGF Investments Inc. (AGFI), AGF Investments America Inc. (AGFA), AGF Investments LLC (AGFUS) and AGF International Advisors Company Limited (AGFIA). AGFA and AGFUS are registered advisors in the U.S. AGFI is registered as a portfolio manager across Canadian securities commissions. AGFIA is regulated by the Central Bank of Ireland and registered with the Australian Securities & Investments Commission. The subsidiaries that form AGF Investments manage a variety of mandates comprised of equity, fixed income and balanced assets.
® The “AGF” and ™ “AGFiQ” logos are registered trademarks of AGF Management Limited and used under licence.
Copyright © AGF Investments Inc.