FOMC Decision Day
Today at 2:00 PM EDT, the FOMC announcing its latest strategy on U.S. interest rates and plans for removing surplus liquidity. Consensus (with some unofficial nuances from members of the Committee) is that the Fed Fund Rate will increase 0.75% and that removal of liquidity at a $90 billion per month rate started in June will continue.
Equity and bond markets have been spooked by the rapid increase in U.S. Government Bond yields across the interest rate time spectrum (2-30 years) following release of a “hot” May CPI report released on Friday and a “hot” May PPI report released yesterday. However, members of the FOMC do not focus on these reports when reaching a monetary policy decision based on inflation expectations. Their focus is on the PCE Price Index.
Trend for the PCE Price Index is significantly less “hot” than CPI and PPI. It is released near the end of each month. It rose from 5.8% in December to 6.0% in January to 6.3% in February to 6.6% in March, but slipped to 6.3% in April. Excluding food and energy, the PCE Price Index rose from 4.9% in December to 5.1% in January to 5.3% in February, but slipped to 5.2% in March and to 4.9% in April. The report for May is scheduled to be released on June 30th and is expected to record a slight increase over the April report.
The Fed has done a reasonable job at broadcasting unofficially its intention to raise the Fed Fund Rate today by 0.75%. Focus this afternoon is revelation of its plans to provide an updated strategy for increasing the Fed Fund Rate and reducing excess liquidity on a regular basis at future FOMC meetings. If revelation proves to be fact, U.S. equity markets will respond significantly to the upside, setting the stage for a June low that traditionally happens during the second year of the U.S. Presidential cycle year when a new President is elected.
Technical Notes for yesterday
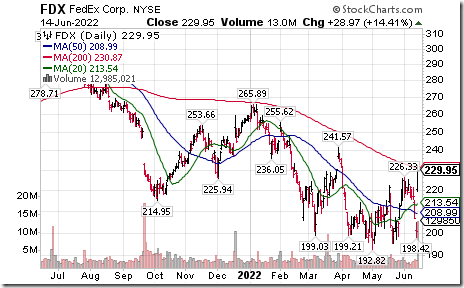
FedEx $FDX an S&P 100 stock moved above $226.33 setting an intermediate uptrend.
Consumer Staples SPDRs $XLP moved below $69.57 extending an intermediate downtrend.
Key stocks in the sector to move below intermediate support were as follow:
Coca Cola $KO a Dow Jones Industrial stock moved below $59.66 extending a downtrend.
Pepsico $PEP a NASDAQ 100 stock moved below $158.52 extending a downtrend.
Mondelez $MDLZ an S&P 100 stock moved below $58.69 extending a downtrend.
Russell 2000 iShares $IWM moved below $168.46 extending an intermediate downtrend.
Healthcare and related ETFs and equities were prominent on the list of stocks breaking support.
NASDAQ Biotech iShares $IBB moved below $105.36 extending an intermediate downtrend.
UnitedHealth Group $UNH a Dow Jones Industrial stock moved below $461.98 extending an intermediate downtrend.
Abbot Labs $ABT an S&P 100 stock moved below $104.63 extending a downtrend.
Incyte $INCY, a NASDAQ 100 stock moved below $65.60 extending a downtrend.
Idexx $IDXX a NASDAQ 100 stock moved below $330.66 extending a downtrend.
More Information Technology stocks broke below intermediate support!
Adobe $ADBE a NASDAQ 100 stock moved below $370.27 extending a downtrend.
Nvidia $NVDA a NASDAQ 100 stock moved below $155.64 extending a downtrend.
PayPal $PYPL a NASDAQ 100 stock moved below $71.83 extending a downtrend.
Base Metals ETN $DBB moved below $21.51 extending a downtrend.
Metals and Mining SPDRs $XME moved below $47.65 extending a downtrend.
Other S&P 100 and Dow Jones Industrial stock breakdowns:
Lowes $LOW an S&P 100 stock moved below $179.22 extending a downtrend.
Lockheed Martin $LMT an S&P 100 stock moved below $414.70 extending a downtrend.
JP Morgan $JPM a Dow Jones Industrial stock moved below $115.02 extending a downtrend.
Travelers $TRV a Dow Jones Industrial stock moved below $165.43 extending a downtrend.
Eurozone iShares $EZU moved below $36.66 extending an intermediate downtrend.
Couche Tard $ATD.TO a TSX 60 stock moved below $53.42 extending an intermediate downtrend
Canadian Financials iShares $XFN.TO moved below $45.35 extending an intermediate downtrend.
Sun Life Financial $SLF.TO a TSX 60 stock moved below $59.54 extending a downtrend.
Canadian Technology iShares $XIT.TO moved below $30.40 extending an intermediate downtrend
Gold miners ETF $GDX moved below $29.66 and TSX Gold iShares XGD.TO moved below Cdn$18.02 extending a downtrend.
Barrick Gold $ABX.TO a TSX 60 stock moved below Cdn$25.21 extending an intermediate downtrend.
TSX Composite Index $TSX moved below 19,480.00 extending an intermediate downtrend.
Trader’s Corner
Equity Indices and Related ETFs
Daily Seasonal/Technical Equity Trends for June 14th 2022
Green: Increase from previous day
Red: Decrease from previous day
Commodities
Daily Seasonal/Technical Commodities Trends for June 14th 2022
 Green: Green: Increase from previous day
Red: Decrease from previous day
Sectors
Daily Seasonal/Technical Sector Trends for June 14th 2021
Green: Increase from previous day
Red: Decrease from previous day
All seasonality ratings are based on performance relative to the S&P 500 Index (except TSX)
Seasonality Chart of the Day
Gold and gold equities on both sides of the border have a history of moving higher from June 15th to September 3rd .
S&P 500 Momentum Barometers
The intermediate term Barometer added 0.21 to 4.81 yesterday. It remains extremely Oversold.
The long term Barometer dropped another 2.40 to 17.00 yesterday. It remains Oversold. Trend remains down.
TSX Momentum Barometers
The intermediate term Barometer slipped another 1.67 to 16.74 yesterday. It remains Oversold. Trend is down.
The long term Barometer dropped another 3.27 to 27.27 yesterday. It remains Oversold. Trend remains down.
Disclaimer: Seasonality and technical ratings offered in this report and at
www.equityclock.com are for information only. They should not be considered as advice to purchase or to sell mentioned securities. Data offered in this report is believed to be accurate, but is not guaranteed.


