


by Ben Inker, GMO LLC
Executive Summary
The last several months have been tough ones for growth stocks. MSCI U.S. Growth has underperformed its Value counterpart by 16% in the first 4 months of 2022 and had a tough end to 2021 as well. But while the median growth stock has indeed had a lousy time of it, the pain has been far from indiscriminate. The group that has been far and away the most painful for investors has been “growth traps” – growth stocks that disappoint relative to analysts’ forecasts. Even against the backdrop of lousy overall returns for growth since last summer, growth traps have managed to underperform the broad growth universe by their largest margin for any comparable period in history. Given the conditions that prevailed a year ago – some of the highest valuation premia for growth stocks ever and the highest median growth forecast for growth stocks on record – this shouldn’t have been a particular shock. As we look at current conditions in the growth universe, we expect growth traps to remain more painful than normal for some time to come.
What do Netflix, Peloton Interactive, Coinbase, and Palantir Technologies have in common? I admit it isn’t a particularly challenging question. As anyone who has been following the U.S. stock market in the last 10 months knows all too well, they are all U.S. large cap growth stocks that have lost more than 50% of their value from their 2021 highs, actually well more than 50%. 1 But I’d like to point out that they have something else in common that should be more broadly concerning for investors. They are all growth traps. Growth traps are a subset of the growth universe and get much less attention than their cousins, value traps, despite my attempt to call attention to them in the 2Q 2021 GMO Quarterly Letter, “Dispelling Myths in the Value vs. Growth Debate.” That is a shame, because investors would be well advised to recognize the damage growth traps can do to their portfolios. In honor of the fact that the 10 months since I wrote that Quarterly Letter have seen the largest-ever underperformance of growth traps relative to the overall growth universe, I’d like to offer a quick refresher on growth traps, why they are so painful, and why I believe they are probably going to continue to snap shut painfully on investors’ portfolios for some time yet to come.
My Quarterly Letter last summer defined a trap as a company in either the value or growth universe that both disappointed on revenues in the last 12 months and saw its future revenue forecast decline as well. 2 When it occurs to a stock in the value universe, it is a value trap. Judging from the interactions I have had with clients and prospective clients over the last couple of decades, investors seem to believe value traps teem in the portfolios of value managers and that those value traps cause massive damage to those portfolios when they appear. While I would love to tell you that the investors are dead wrong on those presumptions, sadly, they are pretty close to spot on. In a typical year, about 30% of stocks in the MSCI U.S. Value index turn out to be value traps, and they underperform that index by 9% on average. 3 But what seems to be somewhat less well known is that growth traps are both more common and more painful than their value brethren, with a prevalence of about 37% of the MSCI U.S. Growth index and an underperformance of 13% on average. 4 The underperformance of growth and value traps versus their respective indices is shown in Exhibit 1.
Exhibit 1: Performance of Value and Growth Traps vs. their Style Indices
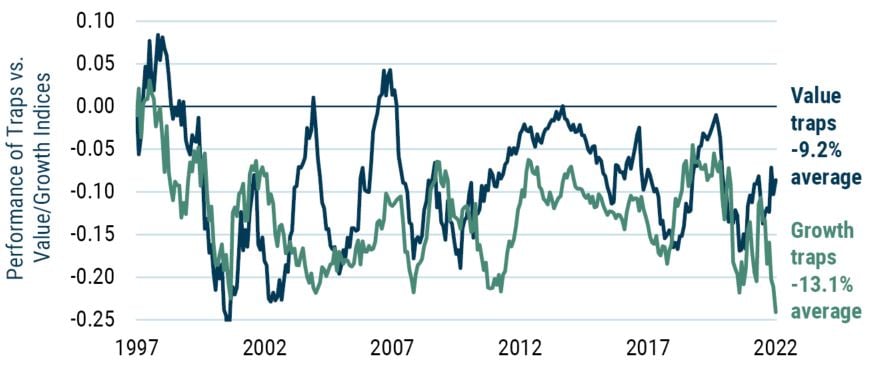
Data as of December 1997 through April 2022 | Source: GMO, IBES, Compustat, MSCI
Returns are for the preceding 12 months.
The fact that growth traps are more painful than value traps is, in one sense, not really a surprise. Value stocks are already companies that investors don’t have particularly high hopes for. They trade at lower-than-average multiples by definition. The fact that a company trades at lower-than-average multiples certainly doesn’t mean it can’t fall when its fundamentals disappoint, but it does generally mean that the pain isn’t compounded too severely by falling valuations as well. For a growth stock, however, a disappointment in the performance of the company is extremely likely to result in a falling valuation multiple. After all, these are exactly the companies that the market has awarded higher-than-average multiples because of outsized expectations of their growth prospects. When those prospects deteriorate, valuations almost invariably fall significantly, often precipitously. 5
That was certainly the fate of the stocks I mentioned at the start of the piece. And they were by no means alone. While the prevalence of growth traps over the past year has not been particularly noteworthy – 26.1% of the growth universe was a trap over the 12 months ending in April, about 10% below their long-run average – their average underperformance was record-breaking. Over the last 10 months, growth traps underperformed the growth universe by 23%, a worse showing than any 10-month period they experienced, even during the bursting of the internet bubble, and worse than in any 10-month period in the 26 years we have the revenue forecast data necessary to define growth traps to begin with. 6 Somewhat entertainingly for those of us managing a value versus growth long/short strategy – in GMO’s case, our Equity Dislocation Strategy 7 – we’ve actually found ourselves in recent months buying a handful of our former shorts as they “trapped” all the way across the large gulf from overpriced growth stocks to underpriced value opportunities. 8
Though we feel comforted to have by and large avoided growth traps over the past year in the portfolios we run for our clients, the important point for anyone building portfolios today is the fact that there are good reasons to expect that growth traps are going to continue being more painful than normal for a while yet. Why do we believe this? It has to do with the basic drivers of the pain caused by growth traps. At the risk of stating the blindingly obvious, the two key parameters that determine the pain of growth traps are the likelihood of growth stocks becoming growth traps and the pain they deliver when they do so. Exhibit 2 shows the prevalence of growth and value traps through time.
Exhibit 2: Weight of Value Traps and Growth Traps
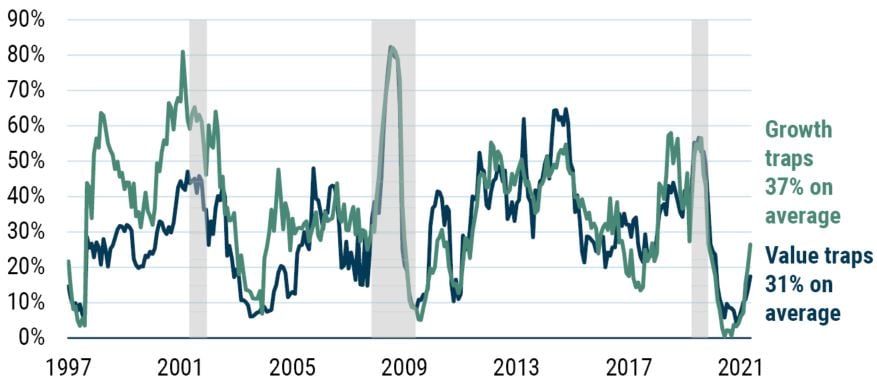
Data as of December 1996 through April 2022 | Source: GMO, IBES, Compustat, MSCI
Recession dates are moved forward 10 months to account for the lag in receiving revenue data and declaring “traps.”
While the average prevalence is over 30% for both the value and growth universes, it’s pretty obvious that there is a strong cyclical component. Trap weights are high in recessions and low when growth is surprisingly strong, particularly in the early stages of the recovery from recessions. The year ending last June was particularly striking in that it saw the lowest level of traps in history, which makes some sense in that the year saw the strongest GDP growth the U.S. has experienced in 70 years. 9
Since last spring, trap percentages have risen for both the value and growth universes and, judging from history, I wouldn’t want to make the bet they are coming back down any time soon. If we wanted to try to get a little smarter than simply saying “when recent trap weights are lower than average, they are more likely to rise than fall,” another parameter we could use to try to predict traps would be the level of growth forecasts themselves. Given that a trap requires disappointing results relative to both near-term and longer-term estimates, the growth estimates that seem most relevant are the longer-term ones. On that front, there is good and bad news. The good news is that the long-term growth forecast for the median growth stock is down sharply from the levels we saw a year ago. 10 The bad news is that despite the fall, those forecasts are as high as they were at the peak of the internet bubble in 2000, as you can see in Exhibit 3. 11
Exhibit 3: Median IBES Long-Term Growth Forecasts for MSCI U.S. Growth Index (%)
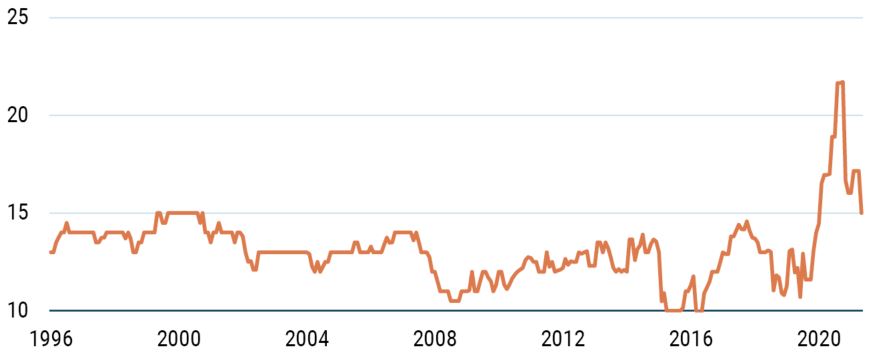
Data as of December 1996 through April 2022 | Source: GMO, IBES, MSCI
Interestingly, those outsized growth expectations a year ago didn’t actually lead to a particularly outsized population of growth traps, but the longer-term correlation between forecast growth and disappointments is quite strong at +0.42. Given that we are still about 1.1 standard deviations above normal for growth forecasts, that level implies higher than normal growth trap probabilities over the next year.
The other parameter besides the growth trap weights that drives the pain of growth traps is the underperformance of those companies that wind up being traps. Growth looks pretty vulnerable in that piece of the puzzle as well, as we can see in Exhibit 4.
Exhibit 4: Growth Stock Valuation Premium vs. Long-Term Average
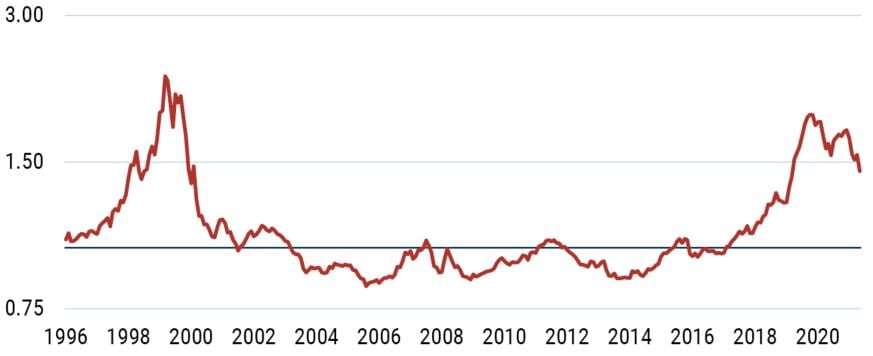
Data as of December 1996 through April 2022 | Source: GMO, Compustat, Worldscope, MSCI
This chart shows the premium at which growth stocks are trading relative to value, renormalized so the long-run average is 1.0. The chart is just the inverse of the cheapness of value chart I’ve been showing for a couple years, but in this case my focus is the fact that the higher the premium at which growth stocks are trading, the more they risk falling when they lose that growth status. Life isn’t quite that simple because not every disappointing growth stock actually falls all the way out of the growth universe and the size of the disappointment surely counts for something, but the correlation between the valuations and the scale of growth trap underperformance is a pretty meaningful -0.23. When growth stocks trade at a higher-than-normal premium to value stocks, the underperformance of growth traps is more extreme. Today, growth is trading about 2.3 standard deviations more expensive than normal relative to value. Absent a near-term collapse in growth stocks relative to the market, we will probably remain vulnerable on this measure for some time to come.
Conclusion
It’s been a bad year for growth stocks. Some of the pain was inflicted by a generic de-rating that hit the growth universe pretty indiscriminately. But a lot of it was driven by growth stocks that fundamentally underperformed investor expectations – growth traps. These growth traps actually had their worst showing on record relative to the growth universe. This fact should be of interest to market historians and, I will admit, it is also a source of some satisfaction for those investors who positioned their portfolios to be short growth stocks a year ago. But what should be of note to all investors whatever their positioning is that conditions today suggest that it is likely there will be more growth traps in the next year than there were in the last one and there is good reason to believe their underperformance will remain worse than usual until a full unwinding of the growth bubble occurs.
Download article here.
Performance data quoted represents past performance and is not predictive of future performance. Net returns are presented after the deduction of a model advisory fee and incentive fee if applicable. These returns include transaction costs, commissions and withholding taxes on foreign income and capital gains and include the reinvestment of dividends and other income, as applicable. A Global Investment Performance Standards (GIPS®) Composite Report is available on GMO.com by clicking the GIPS® Composite Report link in the documents section of the strategy page. GIPS® is a registered trademark owned by CFA Institute. CFA Institute does not endorse or promote this organization, nor does it warrant the accuracy or quality of the content contained herein. Actual fees are disclosed in Part 2 of GMO's Form ADV and are also available in each strategy's Composite Report.
Disclaimer: The views expressed are the views of Ben Inker through the period ending May 2022, and are subject to change at any time based on market and other conditions. This is not an offer or solicitation for the purchase or sale of any security and should not be construed as such. References to specific securities and issuers are for illustrative purposes only and are not intended to be, and should not be interpreted as, recommendations to purchase or sell such securities.
Copyright © 2022 by GMO LLC. All rights reserved.