by Don Vialoux, EquityClock.com
The Bottom Line
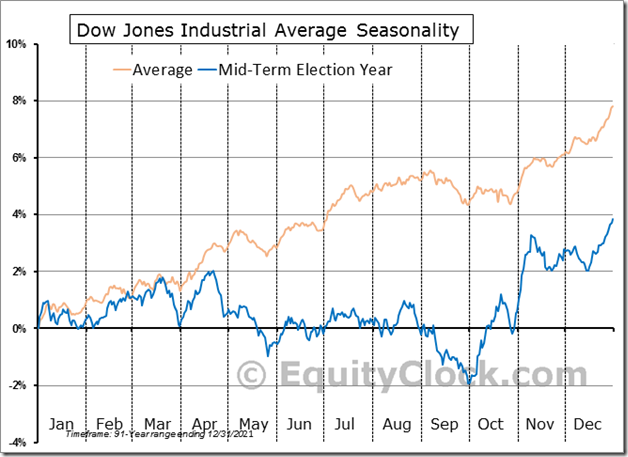
First technical sign of start of a possible intermediate bottom appeared on Friday in North American equity markets. More base building is needed to confirm start of at least a shallow summer rally that normally occurrs during the second year of the U.S. Presidential cycle from late May to mid-August.
Observations
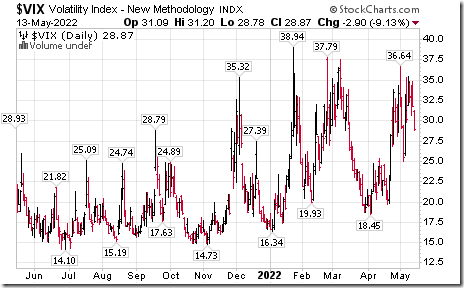
The VIX Index remains elevated, but showed early signs of peaking late last week, typical start of an intermediate bottoming phase for broadly based U.S. equity indices.
The CNN Fear & Greed Index recovered from 6 to 12 on Friday, first signs that “Extreme Fear” is moderating. See Fear and Greed Index – Investor Sentiment | CNN
Strength in North American equity markets was triggered by comments by Federal Reserve Chairman Powell implying that reductions in the Federal Reserve’s balance sheet and increases in the Fed Fund rate by 50 basis points per FOMC meeting will proceed as planned starting on June 1st. North American equity markets responded with the anticipation that no negative surprises to the process are likely to happen. During the next month North American equity markets are likely to respond significantly (one way or the other) to comments by key individual FOMC members when they offer guidelines prior to release of the next FOMC decision scheduled on June 15th.
Consensus earnings estimates for S&P 500 companies on a year-over-year basis in the first quarter of 2022 were unchanged last week. Ninety one percent of companies have reported quarterly results to date. According to www.FactSet.com first quarter earnings on a year-over-year basis are expected to increase 9.1% and revenues are expected to increase 13.4% (versus 13.3% last week)
Consensus earnings estimates for S&P 500 companies beyond the first quarter on a year-over-year basis moved slightly lower again while consensus revenues estimates increased slightly. According to www.FactSet.com second quarter earnings are expected to increase 4.4% (versus 4.8% last week) and revenues are expected to increase 9.9% (versus 9.8% last week). Earnings in the third quarter are expected to increase 10.3% (versus 10.6% last week) and revenues are expected to increase 9.2% (versus 9.0% last week). Earnings in the fourth quarter are expected to increase 9.8% (versus 10.2% last week) and revenues are expected to increase 7.1% (versus 7.2% last week). Earnings on a year-over-year basis for all of 2022 are expected to increase 10.1% and revenues are expected to increase 10.2% (versus 10.0% last week).
Economic News This Week
April Retail Sales to be released at 8:30 AM EDT on Tuesday are expected to increase 0.7% versus a gain of 0.7% in March. Excluding auto sales, April Retail Sales are expected to increase 0.3% versus a gain of 1.4% in March.
April Capacity Utilization to be released at 9:15 AM EDT on Tuesday is expected to increase to 78.6 from 78.3 in March. April Industrial Production is expected to increase 0.4% versus a gain of 0.9% in March.
March Business Inventories to be released at 10:00 AM EDT on Tuesday is expected to increase 1.8% versus a gain of 1.5% in February.
April Housing Starts to be released at 8:30 AM EDT on Wednesday are expected to slip to 1.783 million units from 1.793 million units in March.
Canadian April Consumer Price Index to be released at 8:30 AM EDT on Wednesday is expected to increase 1.0% versus a gain of 1.4% in March. On a year-over-year basis, April CPI is expected to increase 6.1% versus 6.7% in March. Excluding food and energy, April CPI is expected to increase 0.5% versus a gain of 1.0% in March. On a year-over-year basis, April CPI is expected to increase 4.2% versus a gain of 5.5% in March.
May Philly Fed Index to be released at 8:30 AM EDT on Thursday is expected to slip to 17.2 from 17.6 in April.
April U.S. Existing Home Sales to be released at 10:00 AM EDT on Thursday are expected to slip to 565.000 units from 577,000 units in March.
April Leading Economic Indicators to be released at 10:00 AM EDT on Thursday are expected to increase 0.3% versus a gain of 0.3% in March.
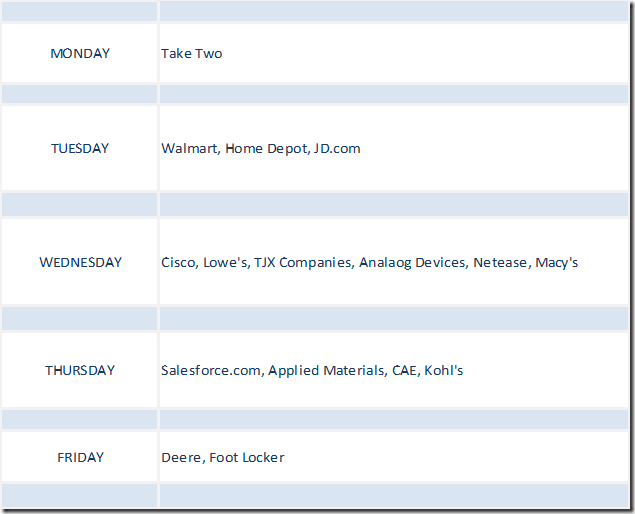
Selected Earnings News This Week
Frequency of quarterly reports slows this week declines once again. Fifteen S&P 500 companies (including three Dow Jones Industrial Average companies) are scheduled to release results.
Trader’s Corner
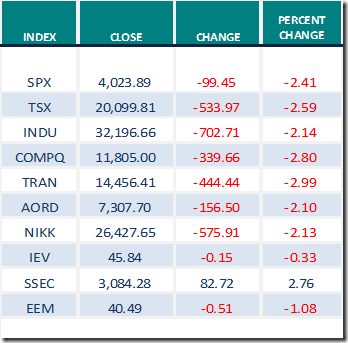
Equity Indices and Related ETFs
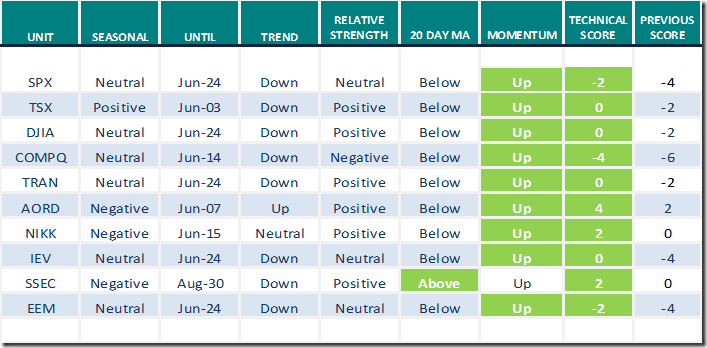
Daily Seasonal/Technical Equity Trends for May 13th 2022
Green: Increase from previous day
Red: Decrease from previous day
Commodities
Daily Seasonal/Technical Commodities Trends for May 13th 2022
Green: Increase from previous day
Red: Decrease from previous day
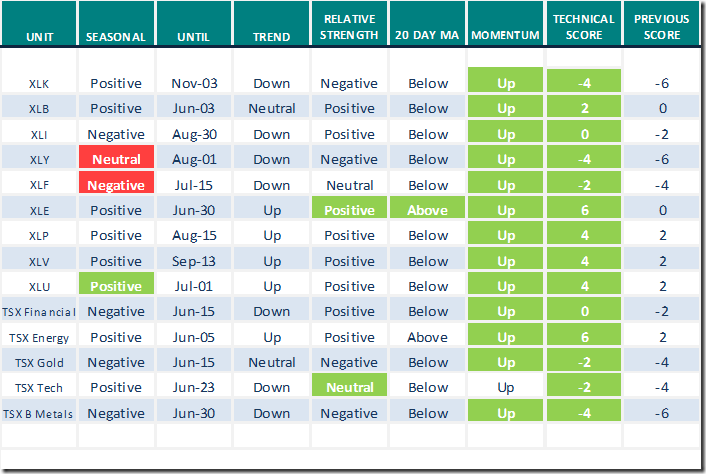
Sectors
Daily Seasonal/Technical Sector Trends for May 13th 2021
Green: Increase from previous day
Red: Decrease from previous day
All seasonality ratings are based on performance relative to the S&P 500 Index (except TSX
Links offered by Valued Providers
Mark Leibovit’s Weekly Comment
Crypto Meltdown Predicted, Now What? – HoweStreet
Links from Mark Bunting and www.uncommonsenseinvestor.com
Shopify’s Crash… – Uncommon Sense Investor
StockCharts.com Chart School
John Murphy’s Ten Laws of Technical Trading [ChartSchool] (stockcharts.com)
Cognitive Biases [ChartSchool] (stockcharts.com)
David Keller comment
This Chart Says More Downside for S&P 500 | The Mindful Investor | StockCharts.com
Greg Schnell says “Tech tries to thrust”.
Tech Tries To Thrust | ChartWatchers | StockCharts.com
Mish Schneider looks at sectors with hidden momentum
3 Key Sectors to Watch with Hidden Momentum | Mish’s Market Minute | StockCharts.com
Tom McClellan notes that “Investors intelligence data at bearish extremes”
Investors Intelligence Data at Bearish Extreme | Top Advisors Corner | StockCharts.com
Tom Bowley discussed on Thursday “How to spot a market bottom”
https://www.youtube.com/watch?v=eJHktYP-pIc
David Keller interviews Matt Maley who discusses “Mean reversion plays in May”.
https://www.youtube.com/watch?v=1bIWeyGzPtg
Bruce Fraser asks “Is the stock market decline ending”?
https://www.youtube.com/watch?v=rj7pYs4kPVE
Jeff Huge asks “Bear Market Bottoming or just getting started”?
https://www.youtube.com/watch?v=j0FAah1G1gc
Michael Campbell’s Money Talks for May 14th
May 14th Episode (mikesmoneytalks.ca)
Victor Adair asks “Why is the U.S. Dollar is such great shape”?
Perfect Storm Hitting the Stock Market – HoweStreet
Technical Scoop from David Chapman and www.Enrichedinvesting.com
Money Show Canada Virtual Expo:
May 24-26
Free registration
Schnell, CMT, MFTA, Greg (moneyshow.com)
More links to follow
Technical Scores
Calculated as follows:
Intermediate Uptrend based on at least 20 trading days: Score 2
(Higher highs and higher lows)
Intermediate Neutral trend: Score 0
(Not up or down)
Intermediate Downtrend: Score -2
(Lower highs and lower lows)
Outperformance relative to the S&P 500 Index: Score: 2
Neutral Performance relative to the S&P 500 Index: 0
Underperformance relative to the S&P 500 Index: Score –2
Above 20 day moving average: Score 1
At 20 day moving average: Score: 0
Below 20 day moving average: –1
Up trending momentum indicators (Daily Stochastics, RSI and MACD): 1
Mixed momentum indicators: 0
Down trending momentum indicators: –1
Technical scores range from -6 to +6. Technical buy signals based on the above guidelines start when a security advances to at least 0.0, but preferably 2.0 or higher. Technical sell/short signals start when a security descends to 0, but preferably -2.0 or lower.
Long positions require maintaining a technical score of -2.0 or higher. Conversely, a short position requires maintaining a technical score of +2.0 or lower
Changes Last Week
Technical Notes for Friday
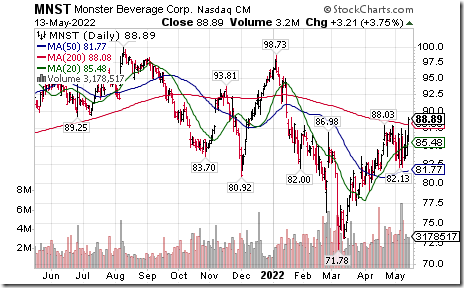
Monster Beverages $MNST a NASDAQ 100 stock moved above $88.03 extending an intermediate uptrend.
S&P 500 Momentum Barometers
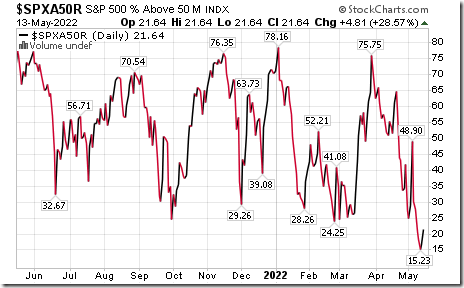
The intermediate term Barometer gained 4.81 on Friday, but dropped 6.22 last week to 21.64. It remains Oversold. Trend remains down, but an early sign of a possible low was recorded on Friday.
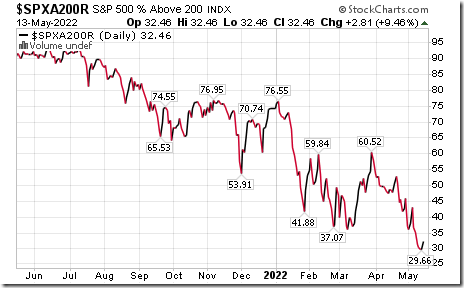
The long term Barometer added 2.81 on Friday, but dropped 2.61 last week to 32.48. It remains Oversold, Trend remains down, but an early sign of a possible low was recorded on Friday.
TSX Momentum Barometers
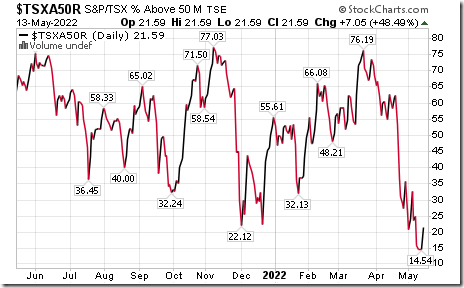
The intermediate term Barometer gained 7.05 on Friday, but dropped 3.30 last week to 21.59. It remains Oversold. Trend remains down, but early sign of a possible low was recorded on Friday.
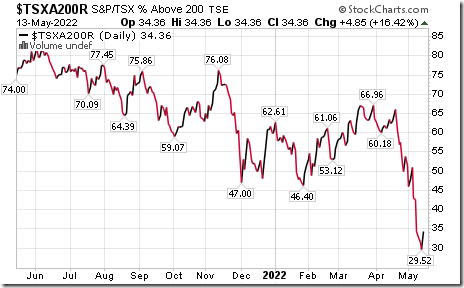
The long term Barometer added 4.85 on Friday, but dropped 8.17 last week to 34.36. It changed from Neutral to Oversold on a move below 40.00. Trend remains down, but early sign of a possible low was recorded on Friday.
Disclaimer: Seasonality and technical ratings offered in this report and at
www.equityclock.com are for information only. They should not be considered as advice to purchase or to sell mentioned securities. Data offered in this report is believed to be accurate, but is not guaranteed.
This post was originally publised at Vialoux's Tech Talk.


![clip_image002[5] clip_image002[5]](https://advisoranalyst.com/wp-content/uploads/2022/05/clip_image0025_thumb.png)
