
by Brian Levitt, Global Market Strategist, Invesco Canada
Brian Levitt goes back to 1995 and examines how different responses to market turmoil would have impacted a $100,000 investment in the U.S. stock market.
Thursday, May 5, was the 54th worst day in the U.S. stock market since 1995.2 I have 54 wrinkles on my forehead commemorating these days. To paraphrase the Goo Goo Dolls song “Name” (coincidentally released in 1995), these markings are souvenirs you never lose. But like any good souvenir they’re meant to be looked at when you need to take a walk down memory lane. Some of those days are as vivid today as they were then. Sept. 17, 2001, the day the market opened after the 9/11 terror attacks. Sept. 15, 2008, the day after the Lehman Brothers collapse. March 16, 2020, the day COVID-19 shut down the global economy. It’s all still painful.
Responding to market downturns
Our success as investors, however, has been determined by how we responded to these agonizing days. Did we break from our investment plans, or did we adhere to principles of sound investing such as consistency and courage? Frequent readers of my writing know that I like to look at how our portfolios would have done based on decisions that our emotions and biases were asking us to make during difficult times. Did we succumb to our instincts, or did we channel George Costanza of Seinfeld fame and do the opposite (apologies for another mid-1990s reference)?
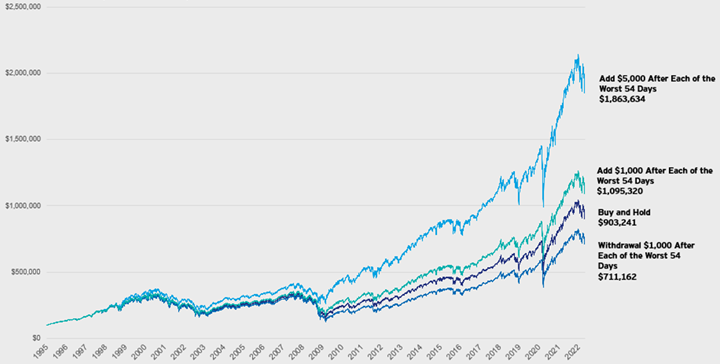
The chart below shows how investors would have fared pulling $1,000 out of the U.S. market after each of the worst 54 days since 1995 versus adding money into the market after each of those days. The results are clear. Investors would have been better served adding money into the market following the worst days. Obviously, the more money added, the better the outcome.3
Buy and hold vs. adding or withdrawing after the worst 54 days in the market since 1995
S&P 500 Index growth of $100,000
 Source: Bloomberg, L.P., May 5, 2022. As represented by the S&P 500 Index. The S&P 500 Index is a market-capitalization-weighted index of the 500 largest domestic U.S. stocks. Indicies cannot be purchased by investors. Past performance does not guarantee future results. This is a hypothetical example shown for illustrative purposes only and does not predict or depict the performance of any investment. All figures in U.S. dollars.
Now, I know what you may be thinking. That was then. This is now. There’s still a lot of monetary policy tightening likely to come. Inflation still needs to peak. Plus, investors still haven’t fully capitulated. After all, 30% of the New York Stock Exchange stocks are still trading above their 200-day moving averages and markets have typically bottomed when that figure is closer to 10% to 15%.4 All true. But the market downturns weren’t over on most of the 54 days analyzed in the chart above.
I don’t begrudge the tactically minded investors who are de-risking their portfolios to get the market right over the next weeks. Admittedly, there are still challenges to be worked through and more investor capitulation to come. Nonetheless, ask yourself how you were feeling on April 14, 2000, during the early days of the tech wreck, or on Nov. 5, 2008, during the height of the Global Financial Crisis. The point is that although there were more down days to come, long-term investors were still ultimately better served investing than withdrawing.
Footnotes:
1 Source: Bloomberg, 5/5/22, refers to the S&P 500 Index.
2 Source: Bloomberg, 5/5/22, refers to the S&P 500 Index.
3 Source: Bloomberg, 5/5/22. As represented by the S&P 500 Index. The S&P 500 Index is a market-capitalization-weighted index of the 500 largest domestic U.S. stocks. Indices cannot be purchased by investors. Past performance does not guarantee future results.
4 Source: Bloomberg, 5/5/22. As represented by the Bloomberg Percentage of New York Stock Exchange Stocks Closing Above 200-Day Moving Average. A moving average illustrates a trend by adding up all the data points during a specific period and dividing the sum by the number of days. Past performance does not guarantee future results.
This post was first published at the official blog of Invesco Canada.