by Don Vialoux, EquityClock.com
The Bottom Line
Despite better than consensus quarterly reports released to date by most S&P 500 companies, equity prices of reporting companies mainly responded to the downside. Look for continuation of this trend this week
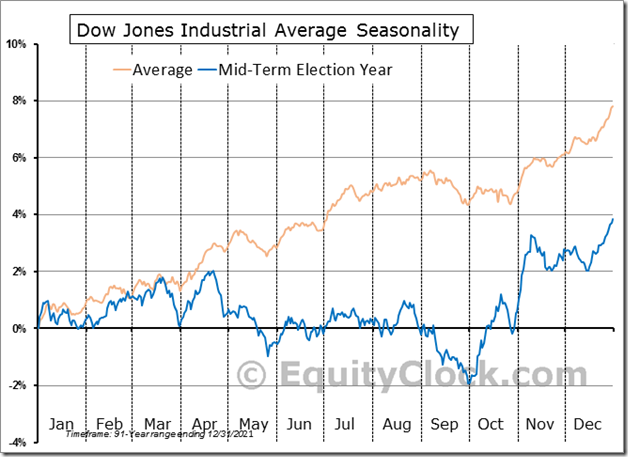
Seasonal influences for broadly based North American equity indices are following their traditional pattern during a U.S. mid-term Presidential election cycle year: Indices move lower from mid-April to at least late May and frequently to the end of June.
Observations
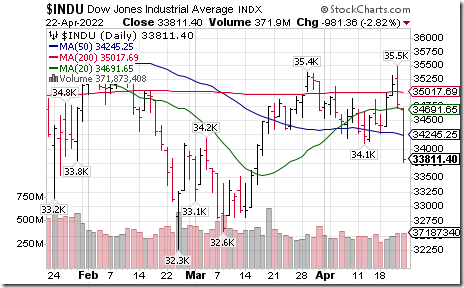
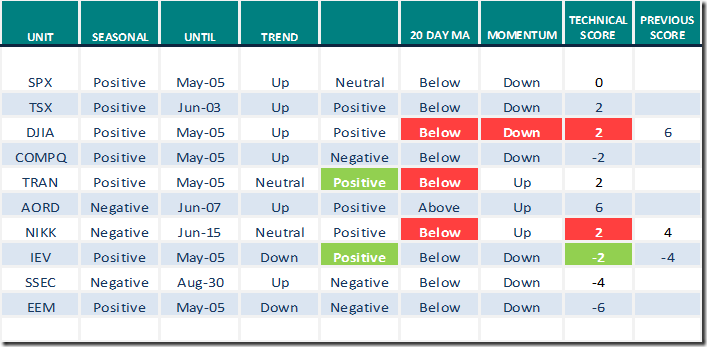
Rare technical action was recorded on late Thursday/Friday! The Dow Jones Industrial Average, S&P 500 Index and Dow Jones Transportation Average managed to break simultaneously below their 200 day, 50 day and 20 day moving averages.
Consensus earnings estimate for S&P 500 companies on a year-over-year basis in the first quarter of 2022 increased again last week. According to www.FactSet.com first quarter earnings on a year-over-year basis are expected to increase 6.6% (versus 5.1% last week) and revenues are expected to increase 11.1% (versus 10.8% last week)
Consensus earnings estimates for S&P 500 companies beyond the first quarter on a year-over-year basis increased again. According to www.FactSet.com second quarter earnings are expected to increase 7.0% (versus 6.5% last week) and revenues are expected to increase 9.9% (versus 9.7% last week). Earnings in the third quarter are expected to increase 11.7% (versus 11.1% last week) and revenues are expected to increase 8.8% (versus an increase of 8.6% last week). Earnings in the fourth quarter are expected to increase 11.4% (versus 10.6% last week) and revenues are expected to increase 7.2% (versus 7.1% last week). Earnings on a year-over-year basis for all of 2022 are expected to increase 10.9% (versus 10.2% last week) and revenues are expected to increase 9.5% (versus 9.3% last week).
Economic News This Week
Bank of Canada governor Macklin updates on monetary policy.at 11:00 AM EDT on Monday.
March Durable Goods Orders to be released at 8:30 AM EDT on Tuesday are expected to increase 1.0% versus a drop of 2.1% in February.
March New Home Sales to be released at 10:00 AM EDT on Tuesday are expected to increase to 776,000 units from 772,000 units in February.
First quarter annualized real GDP to be released at 8:30 AM EDT on Thursday is expected to increase 1.0% versus a gain of 6.9% in the fourth quarter.
March Personal Income to be released at 8:30 AM EDT on Friday is expected to increase 0.4% versus a gain of 0.5% in February. March Personal Spending is expected to increase 0.7% versus a gain of 0.2% in February.
Canada’s February GDP to be released at 8:30 AM EDT on Friday is expected to increase 0.2% versus a gain of 0.2% in January.
April Chicago PMI to be released at 9:45 AM EDT on Friday is expected to drop to 57.0 from 62.9 in March.
April Michigan Consumer Sentiment to be released at 10:00 AM EDT on Friday is expected to remain unchanged from March at 65.7.
Selected Earnings News This Week
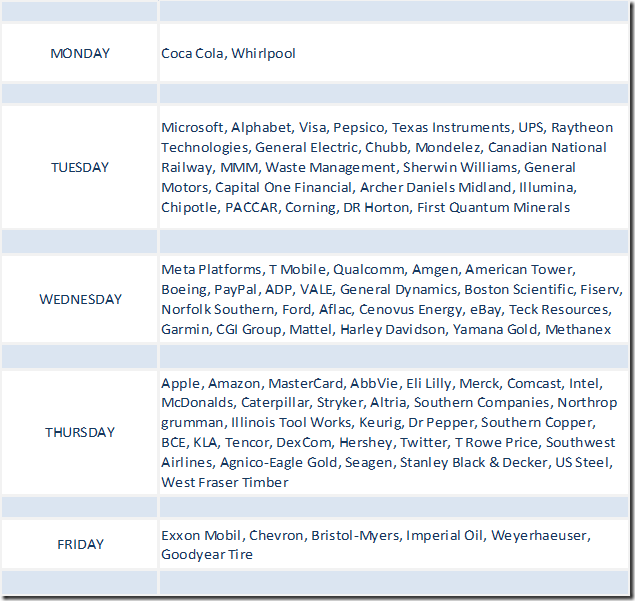
Twenty percent of S&P 500 companies have reported quarterly results to date. Another 35% (i.e.175) companies are scheduled to report this week. Quarterly reports by TSX 60 companies start to appear on Tuesday.
Trader’s Corner
Equity Indices and Related ETFs
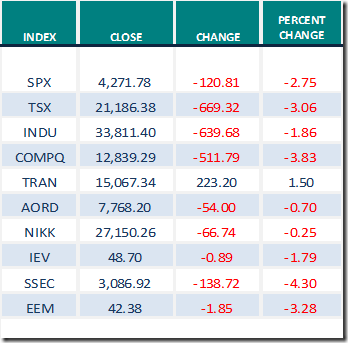
Daily Seasonal/Technical Equity Trends for April 22nd 2022
Green: Increase from previous day
Red: Decrease from previous day
Commodities
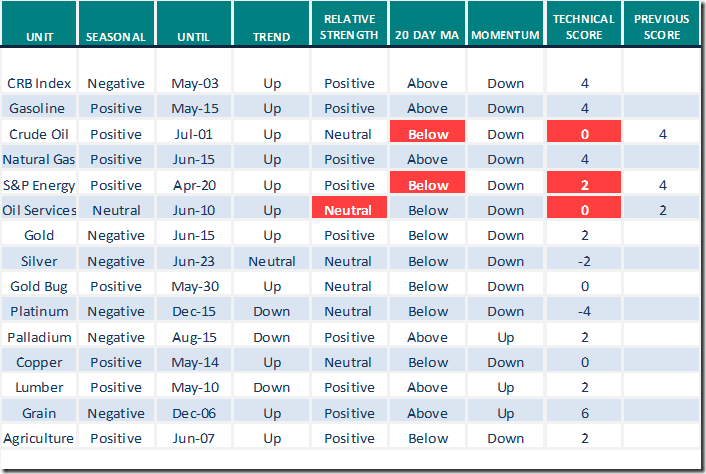
Daily Seasonal/Technical Commodities Trends for April 22nd 2022
Green: Increase from previous day
Red: Decrease from previous day
Sectors
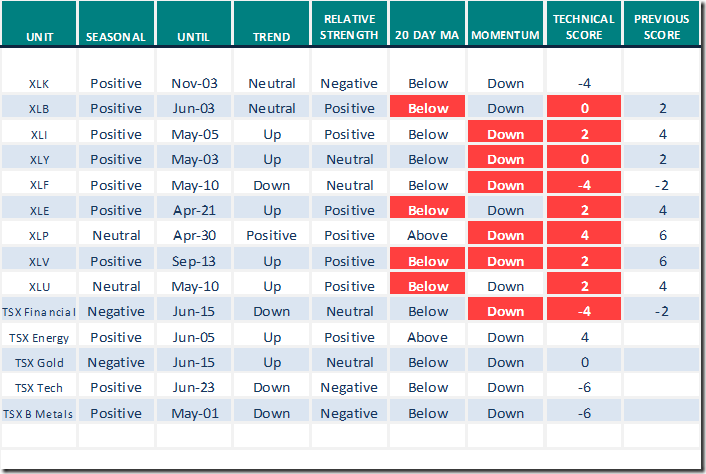
Daily Seasonal/Technical Sector Trends for April 22nd 2021
Green: Increase from previous day
Red: Decrease from previous day
All seasonality ratings are based on performance relative to the S&P 500 Index (except TSX)
Links offered by Valued Providers
Mark Leibovit’s weekly comment
Gold, Silver, Inflation, Interest Rates, Bonds – HoweStreet
Greg Schnell notes that “Commodities start to exit”
Commodities Start To Exit | The Canadian Technician | StockCharts.com
David Keller says “Distribution Phase continues for major Averages”.
Carl and Erin Swenlin note that the Technology sector has completed a “Death Cross”
Death Cross for Technology Sector | ChartWatchers | StockCharts.com
Michael Campbell’s Money Talks for April 23rd
April 23rd Show Now Available (mikesmoneytalks.ca)
Links from Mark Bunting and www.uncommonsenseinvestor.com
Stocks Heading for "Goldilocks" Environment & "Last Hurrah" – Uncommon Sense Investor
Watch Netflix But Don’t Be Tempted by the Stock. Here’s Why. – Uncommon Sense Investor
Victor Adair’s Trading Notes for April 23rd
Trading Desk Notes For April 23, 2022 – HoweStreet
Technical Scoop by David Chapman and www.enrichedinvesting.com
Technical Scores
Calculated as follows:
Intermediate Uptrend based on at least 20 trading days: Score 2
(Higher highs and higher lows)
Intermediate Neutral trend: Score 0
(Not up or down)
Intermediate Downtrend: Score -2
(Lower highs and lower lows)
Outperformance relative to the S&P 500 Index: Score: 2
Neutral Performance relative to the S&P 500 Index: 0
Underperformance relative to the S&P 500 Index: Score –2
Above 20 day moving average: Score 1
At 20 day moving average: Score: 0
Below 20 day moving average: –1
Up trending momentum indicators (Daily Stochastics, RSI and MACD): 1
Mixed momentum indicators: 0
Down trending momentum indicators: –1
Technical scores range from -6 to +6. Technical buy signals based on the above guidelines start when a security advances to at least 0.0, but preferably 2.0 or higher. Technical sell/short signals start when a security descends to 0, but preferably -2.0 or lower.
Long positions require maintaining a technical score of -2.0 or higher. Conversely, a short position requires maintaining a technical score of +2.0 or lower
Changes Last Week
Technical Notes released on Friday at
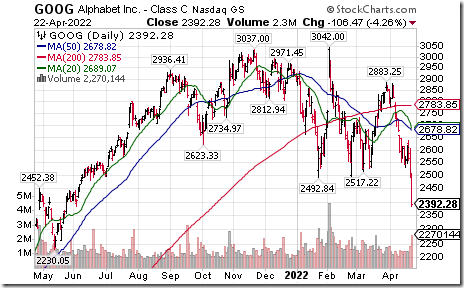
Alphabet is leading U.S. equity prices on the downside this morning. $GOOG moved below $2,492.84 and GOOGL moved below $2490.00 extending an intermediate downtrend.
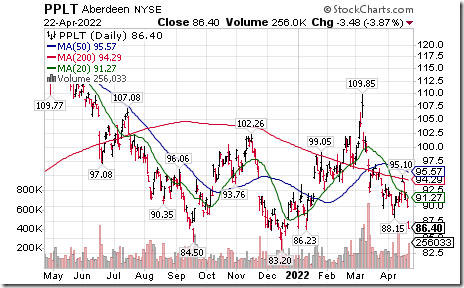
Platinum ETN $PPLT moved below $88.15 extending an intermediate downtrend.
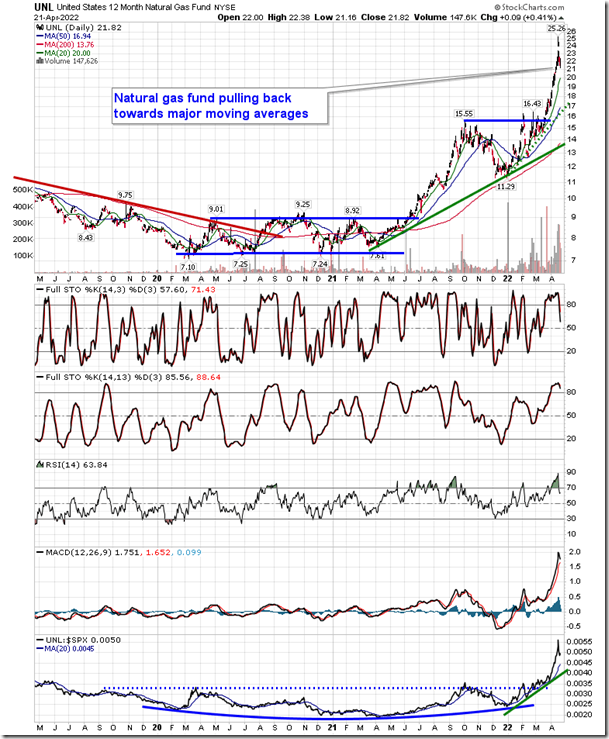
We’re taking profits in a number of seasonal trades that have each returned over 40% in just a few months. equityclock.com/2022/04/21/… $UNG $UNL $UGAZ $NG_F #NatGas
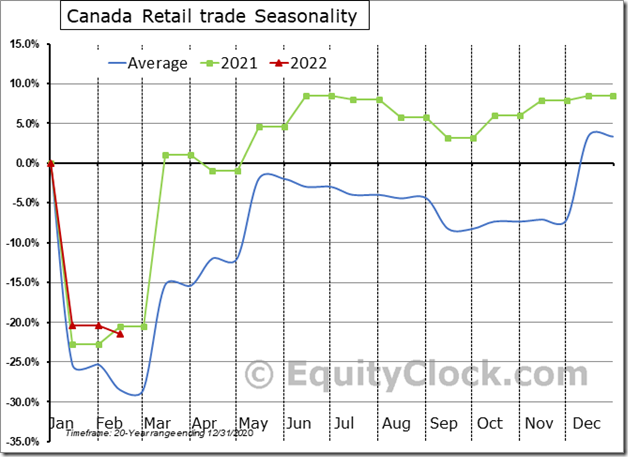
Canadian Retail Sales fell by 1.2% in February, which is firmly better than the 3.9% decline that is average for this time of year. The year-to-date change is now trending 7.0% above the seasonal norm. $MACRO $STUDY #CDNecon #CAD
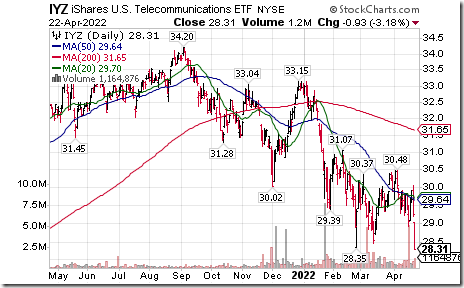
U.S. Telecommunications iShares $IYZ moved below $28.35 extending an intermediate downtrend.
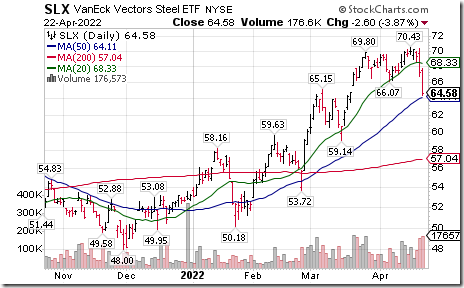
Steel ETF $SLX moved below intermediate support at $66.07
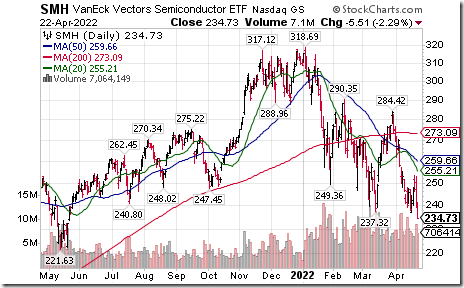
Semiconductor ETF $SMH moved below$237.32 extending an intermediate downtrend.
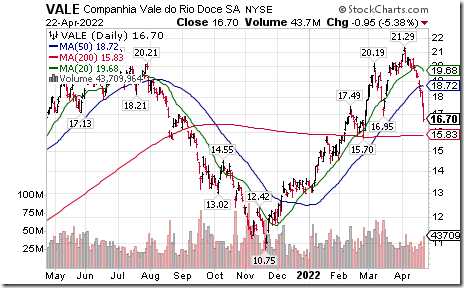
Base Metal stocks and related ETFs $PICK $XBM.CA are under exceptional downside technical pressure. One of the largest producers Vale $VALE moved below support at $16.95
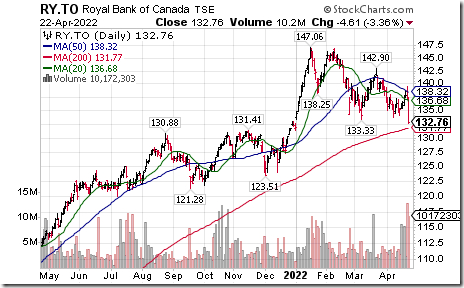
Canadian banks stocks and related ETFs $ZEB.CA $XFN.CA are leading weakness in TSX 60 stocks. Royal Bank $RY.CA moved below $133.33 and $133.68 extending an intermediate downtrend.
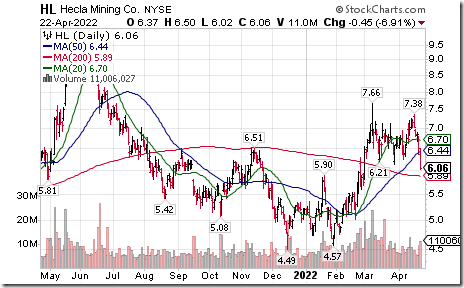
Silver stocks and related ETF $SIL are under technical pressure. Hecla Mining $HL moved below $6.13 completing a double top pattern.
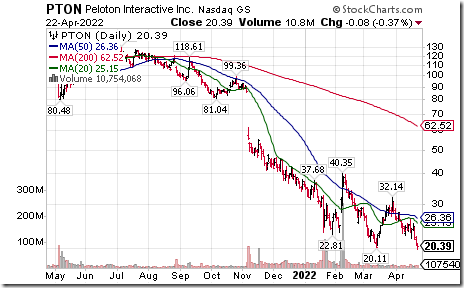
Peloton $PTON a NASDAQ 100 stock moved below $20.11 extending an intermediate downtrend.
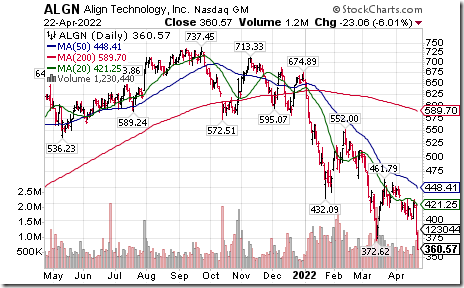
Align Technology $ALGN a NASDAQ 100 stock moved below $372.62 extending an intermediate downtrend.
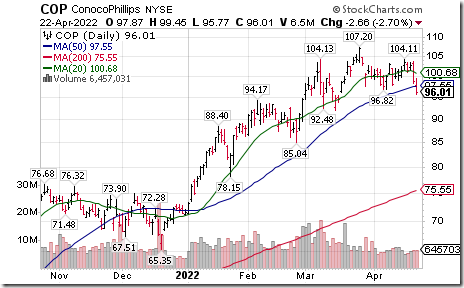
ConocoPhillip $COP an S&P 100 stock moved below $96.82 completing a double top pattern.
S&P 500 Momentum Barometers
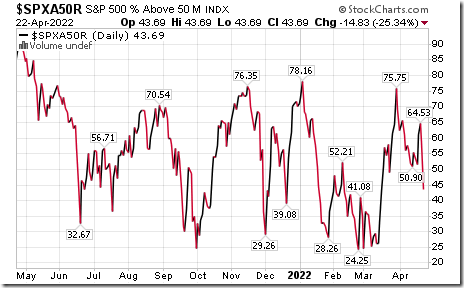
The intermediate term Barometer plunged 14.83 on Friday and 9.82 last week to 43.69. It remains Neutral. Trend is down.
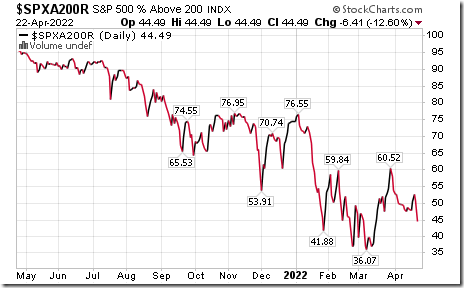
The long term Barometer dropped 6.41 on Friday and 3.81 last week to 44.49. It remains Neutral. Trend is down.
TSX Momentum Barometers
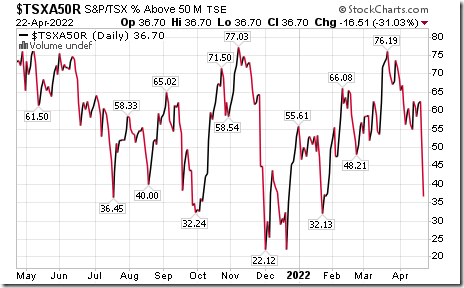
The intermediate term Barometer plunged 16.51 on Friday and 24.29 last week to 36.70. It changed from Overbought to Oversold on a move below 60.00 and 40.00. Trend is down
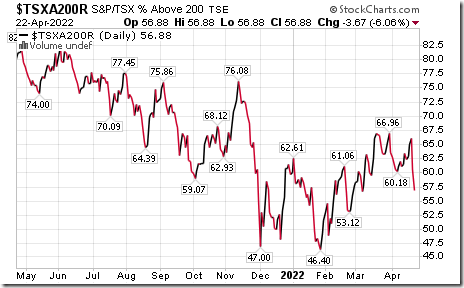
The long term Barometer slipped 3.67 on Friday and 5.45 last week to 56.88. It changed from Overbought to Neutral on a drop below 60.00. Trend is down.
Disclaimer: Seasonality and technical ratings offered in this report and at
www.equityclock.com are for information only. They should not be considered as advice to purchase or to sell mentioned securities. Data offered in this report is believed to be accurate, but is not guaranteed.
This post was originally publised at Vialoux's Tech Talk.


