by Don Vialoux, EquityClock.com
Technical Notes released yesterday at
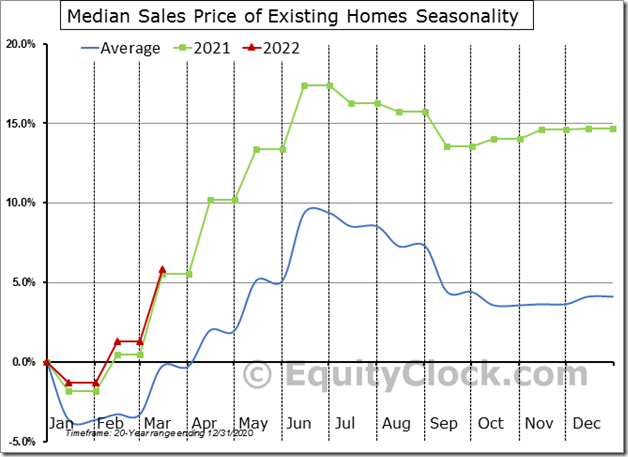
Strong demand and limited supply continue to drive the cost of homes higher. The median price of homes sold in the US has climbed by 5.8% through the first quarter of the year, which is the strongest rise through this period on record. $STUDY $MACRO #Economy #Housing $ITB $XHB
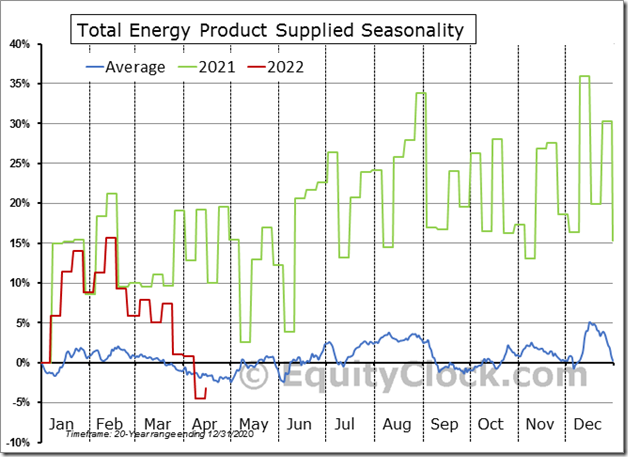
As demand destruction for energy products materializes, it is time to tighten up the stops on energy stocks and/or rotate to other energy sector beneficiaries. equityclock.com/2022/04/20/… $XLE $XOP $USO $CL_F #Oil
Continued jobless claims are now showing the largest percentage drawdown through the middle of April on record, lower by 28.1% year-to-date. The result continues to emphasize how tight the labor market remains, which is further ingraining wage pressures in the economy. $MACRO $STUDY #Economy #Employment
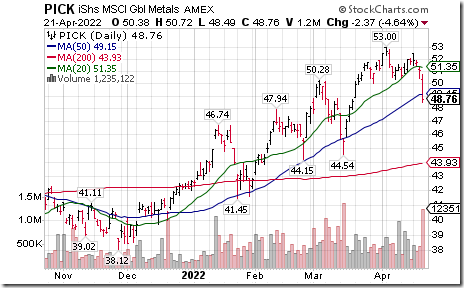
Base Metals iShares $PICK moved below $50.31 completing a short term Head & Shoulders pattern.
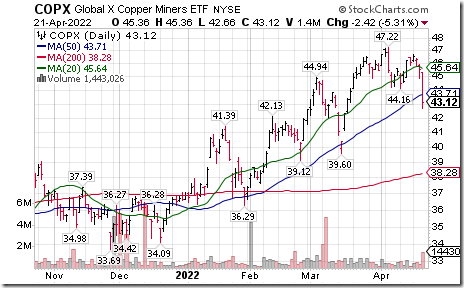
Copper Mining ETF $COPX moved below $44.16 completing a short term double top pattern.
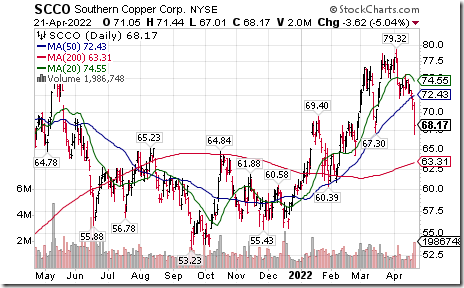
Copper stocks and related ETFs are under significant technical pressure. Southern Copper $SCCO one of the largest copper producer in the world moved below intermediate support at $67.30
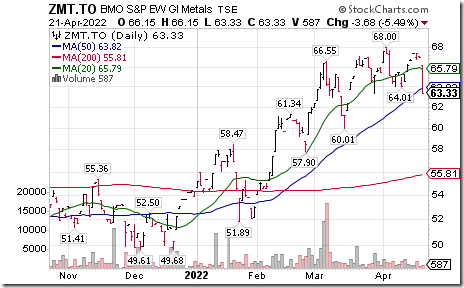
BMO Equal Weight Base Metals ETF $ZMT.CA moved below $63.34 completing a short term Head & Shoulders pattern.
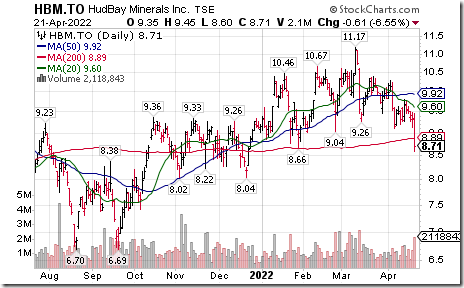
HudBay Minerals $HBM.CA a major base metals producer moved below Cdn$9.04 completing a Head & Shoulders pattern.
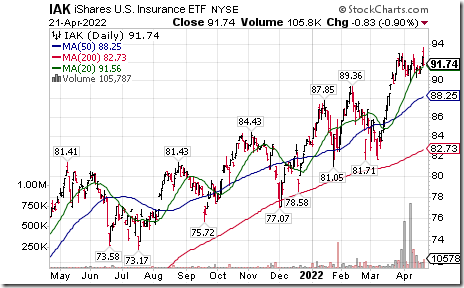
U.S. Insurance iShares $IAK moved above $93.00 to an all-time high extending an intermediate uptrend.
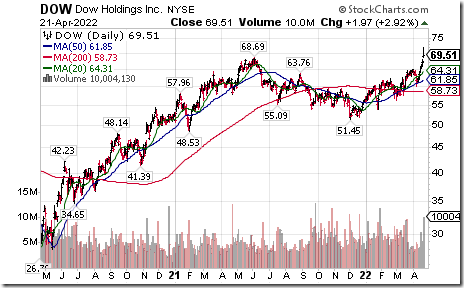
Dow Holdings $DOW an S&P 100 stock moved above $68.69 to an all-time high extending an intermediate uptrend.
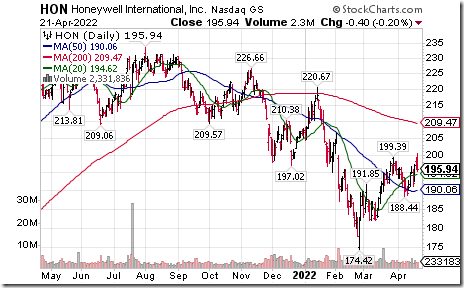
Honeywell $HON a Dow Jones Industrial Average stock moved above $197.39 extending an intermediate uptrend.
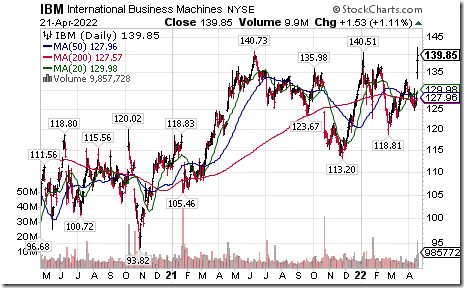
IBM $IBM a Dow Jones Industrial Average stock moved above $140.51 and $140.73 to a nine year high extending an intermediate uptrend.
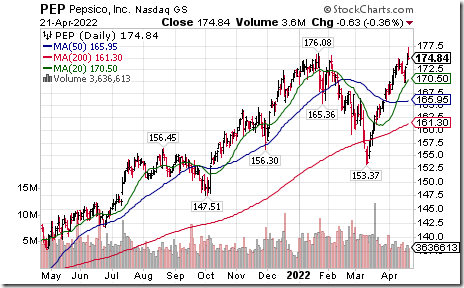
Pepsico $PEP a NASDAQ 100 stock moved above $176.08 to an all-time high extending an intermediate uptrend. Seasonal influences are favourable to July 17th. If a subscriber to EquityClock, see seasonality chart at https://charts.equityclock.com/pepsico-inc-nysepep-seasonal-chart
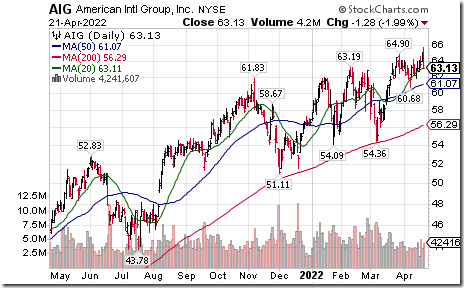
American International Group $AIG an S&P 100 stock moved above $64.90 extending an intermediate uptrend. Seasonal influences are favourable to June 8th. If a subscriber to EquityClock, see seasonality chart at https://charts.equityclock.com/american-international-group-inc-nyseaig-seasonal-chart
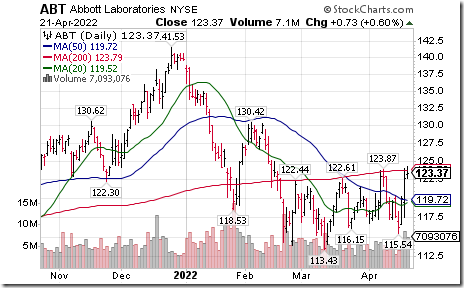
Abbott Labs $ABT an S&P 100 stock moved above $123.87 extending an intermediate uptrend.
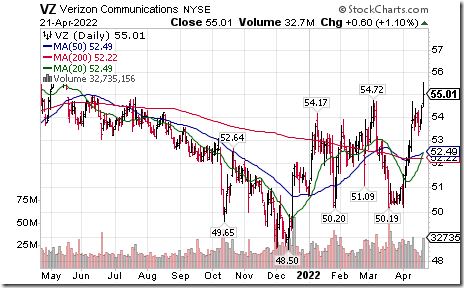
Verizon $VZ a Dow Jones Industrial Average stock moved above $54.72 extending an intermediate uptrend.
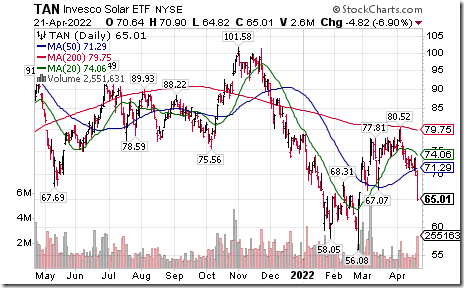
Solar ETF $TAN moved below intermediate support at $67.07
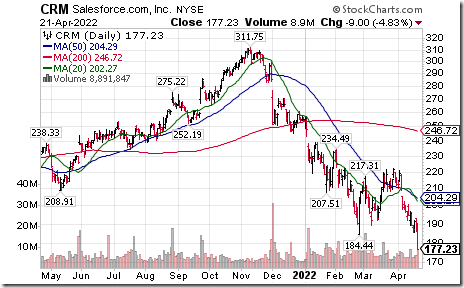
Salesforce $CRM a NASDAQ 100 stock moved below $184.44 extending an intermediate downtrend.
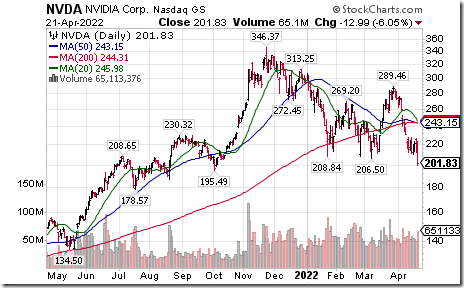
Nvidia $NVDA a NASDAQ 100 stock moved below $206.50 extending an intermediate downtrend.
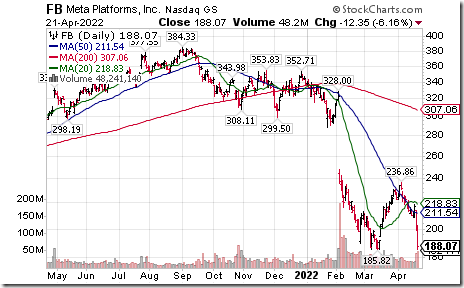
Meta Platforms $FB a NASDAQ 100 stock moved below $185.82 extending an intermediate downtrend.
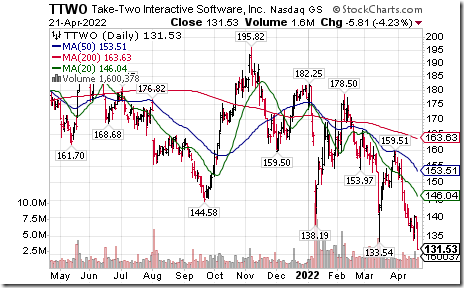
Take Two Interactive $TTWO a NASDAQ 100 stock moved below $133.54 extending an intermediate downtrend.
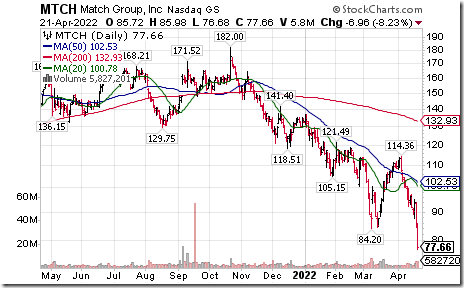
Match $MTCH a NASDAQ 100 stock moved below $84.20 extending an intermediate downtrend.
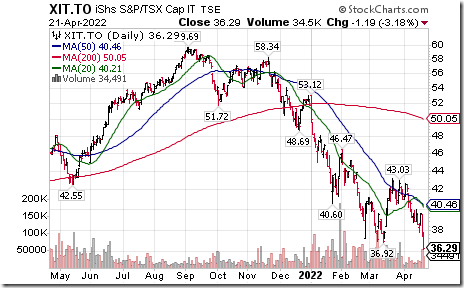
Canadian Technology iShares $XIT.CA moved below $36.92 extending an intermediate downtrend.
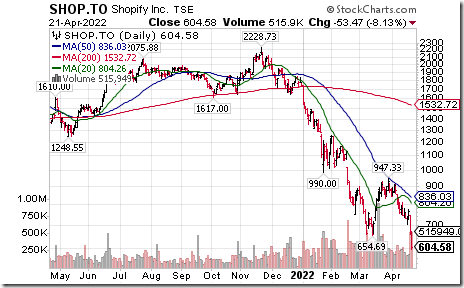
Shopify $SHOP.CA a TSX 60 stock moved below Cdn$654.69 extending an intermediate downtrend.
Trader’s Corner
Equity Indices and Related ETFs
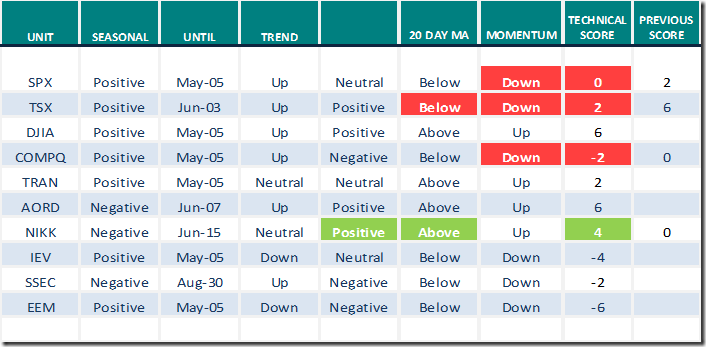
Daily Seasonal/Technical Equity Trends for April 21st 2022
Green: Increase from previous day
Red: Decrease from previous day
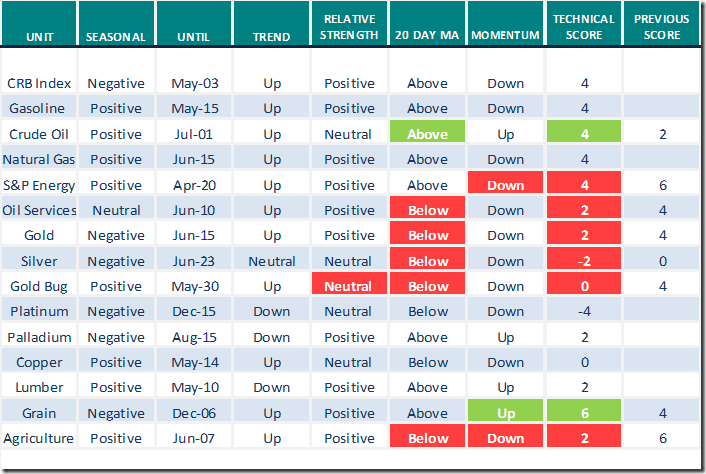
Commodities
Daily Seasonal/Technical Commodities Trends for April 21th 2022
Green: Increase from previous day
Red: Decrease from previous day
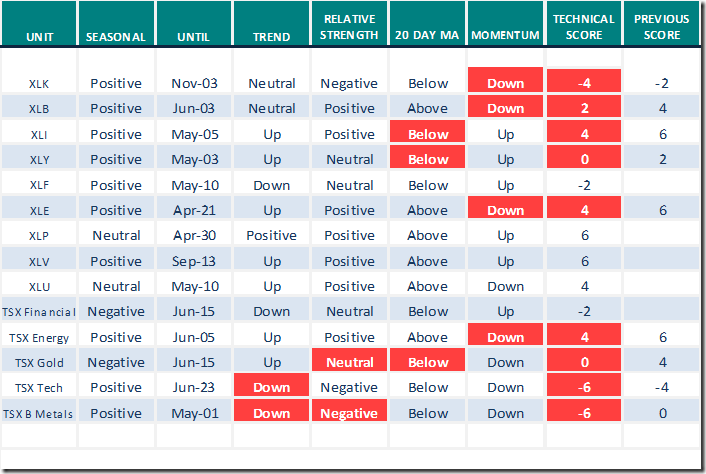
Sectors
Daily Seasonal/Technical Sector Trends for April 21st 2021
Green: Increase from previous day
Red: Decrease from previous day
All seasonality ratings are based on performance relative to the S&P 500 Index (except TSX)
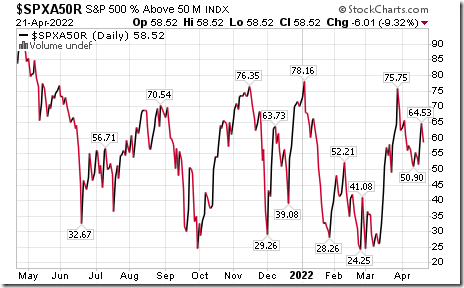
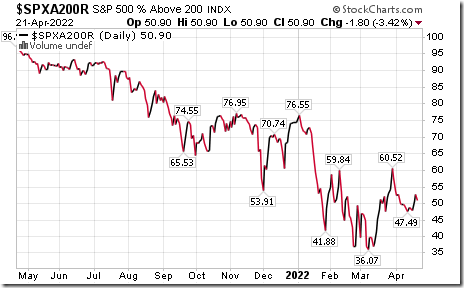
S&P 500 Momentum Barometers
The intermediate term Barometer dropped 6.01 to 58.52 yesterday. It changed back to Neutral from Overbought on a drop below 60.00.
The long term Barometer slipped 1.80 to 50.90 yesterday. It remains Neutral.
TSX Momentum Barometers
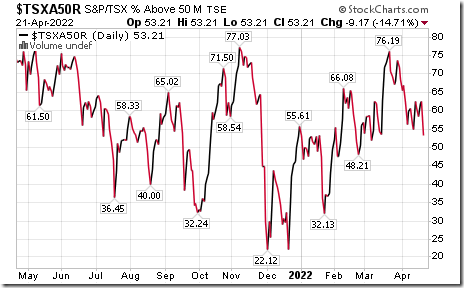
The intermediate term Barometer dropped 9.17 to 53.21 yesterday. It turned back to Neutral from Overbought on a return below 60.00.
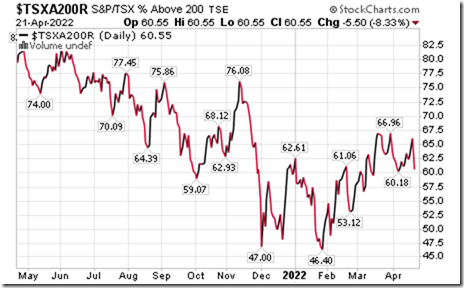
The long term Barometer dropped 5.50 to 60.55 yesterday. It remained Overbought
Disclaimer: Seasonality and technical ratings offered in this report and at
www.equityclock.com are for information only. They should not be considered as advice to purchase or to sell mentioned securities. Data offered in this report is believed to be accurate, but is not guaranteed.
This post was originally publised at Vialoux's Tech Talk.


