by Don Vialoux, EquityClock.com
Technical Notes released yesterday at
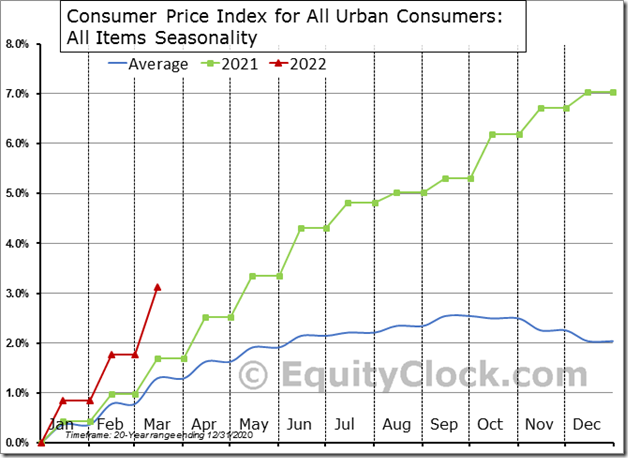
US Consumer Prices jumped by another 1.3% in March , which is more than double the 0.5% increase that is average for this time of the year. With a year-to-date increase of 3.1%, the change in consumer prices has already surpassed the increase that has been average for an entire year. $STUDY $MACRO $TIP $IEF #Economy #CPI
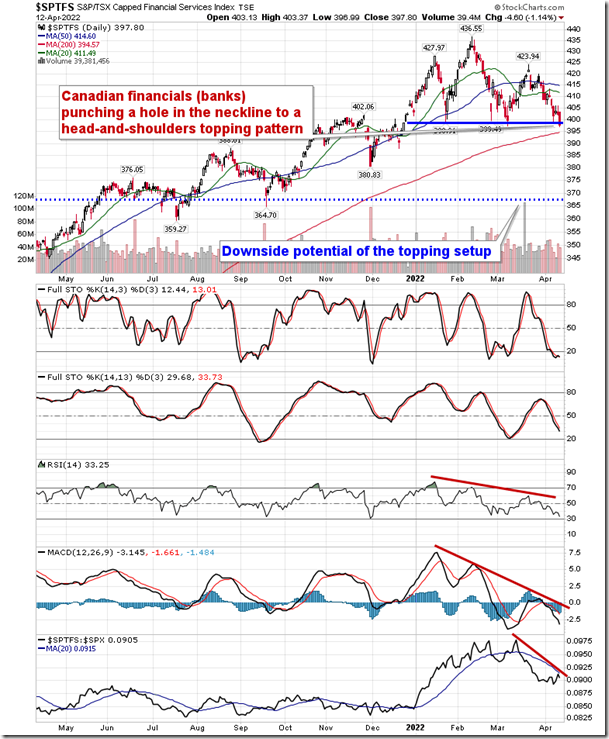
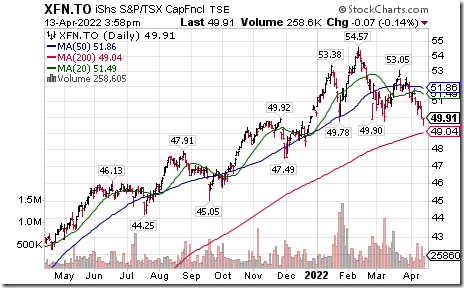
As we enter earnings season with reports from some of the major banks, the technical setup for these financial institutions is concerning. equityclock.com/2022/04/12/… $JPM $TD $BMO $CM $BNS $RY $XFN.CA $ZEB.CA
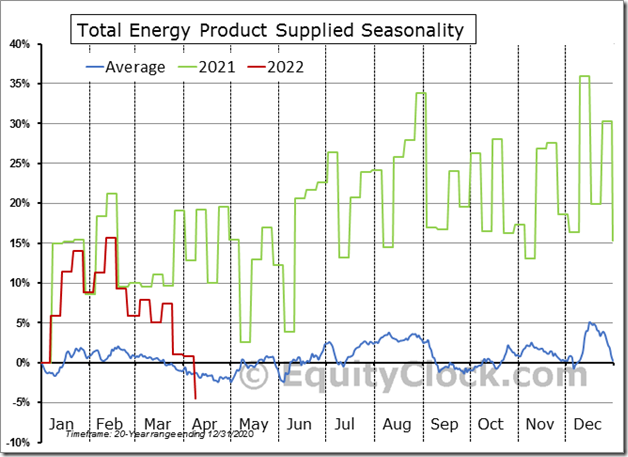
After a strong start to the year, Total Energy Product Supplied has now slipped below its seasonal average trend as high prices weigh on activity. The metric of demand is now lower on the year by 4.5%, below the 1.4% decline that is average through this point in the year. $XLE $XOP $USO $CL_F $MACRO $STUDY
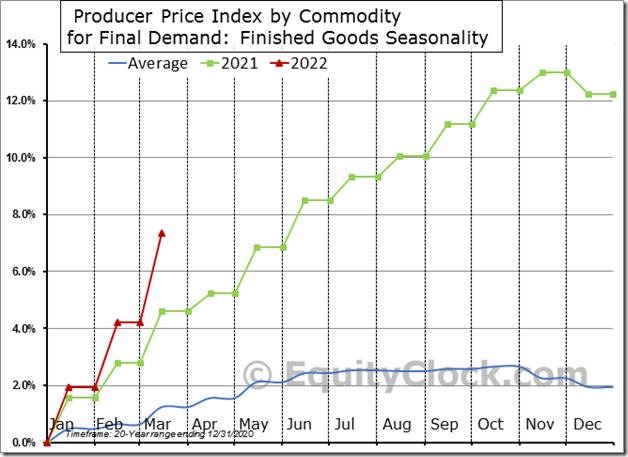
With a 3.0% jump in March alone, the 7.4% rise in Producer Prices Final Demand through the first quarter of 2022 is the fastest rise in inflationary pressures for this time of year on record. The average increase through the first quarter is a mere 1.2%. $MACRO $STUDY #Economy #PPI
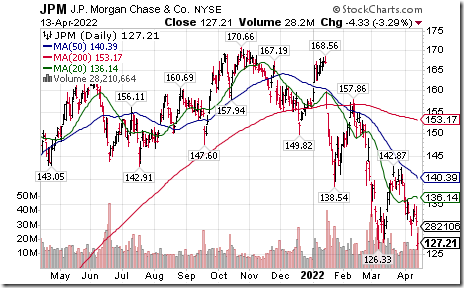
JP Morgan $JPM a Dow Jones Industrial Average stock moved below $126.33 extending an intermediate downtrend following release of lower than consensus first quarter results.
TSX Financials iShares $XFN.CA moved below $49.90 and $49.78 completing a Head & Shoulders pattern.
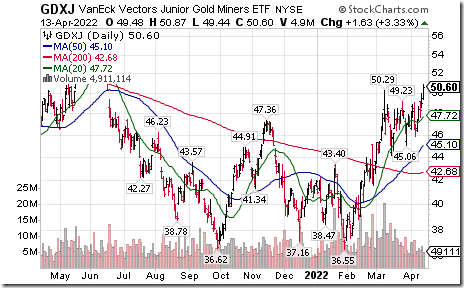
Junior Gold ETF $GDXJ moved above $50.29 extending an intermediate uptrend.
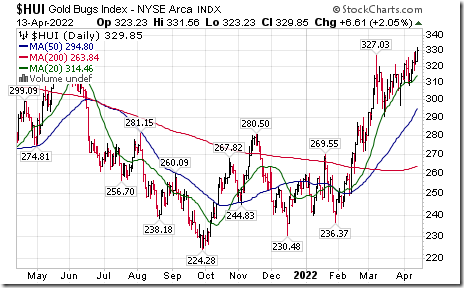
Gold Bug Index $HUI moved above $327.03 extending an intermediate uptrend.
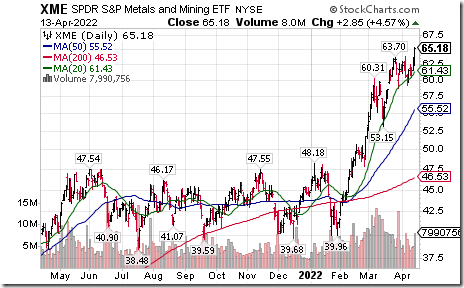
Metals & Mining SPDRs $XME moved above $63.70 to an all-time high extending an intermediate uptrend.
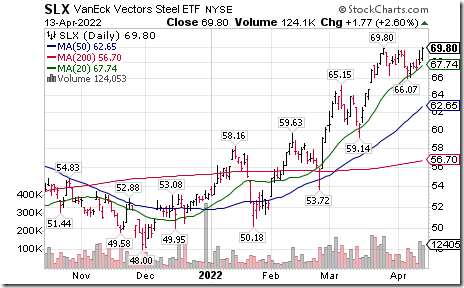
Steel ETF $SLX moved above $69.80 to a 14 year high extending an intermediate uptrend.
Trader’s Corner
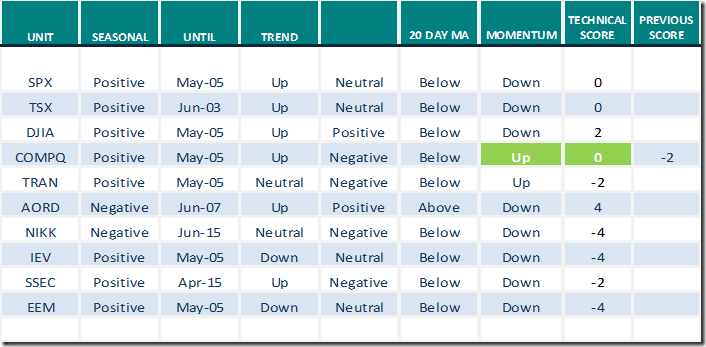
Equity Indices and Related ETFs
Daily Seasonal/Technical Equity Trends for April 13th 2022
Green: Increase from previous day
Red: Decrease from previous day
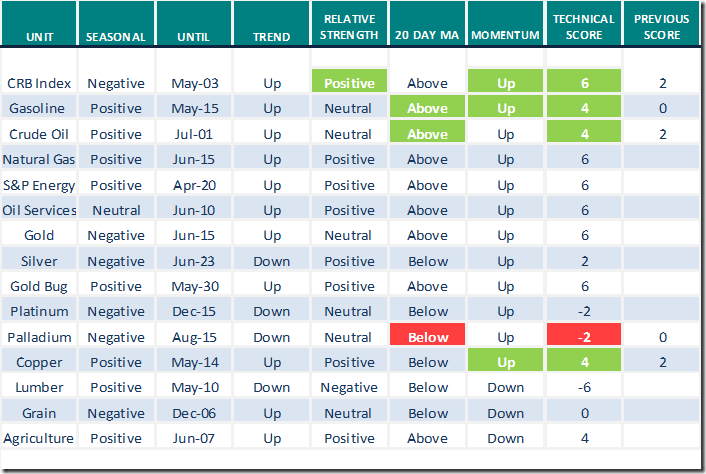
Commodities
Daily Seasonal/Technical Commodities Trends for April 13th 2022
Green: Increase from previous day
Red: Decrease from previous day
Sectors
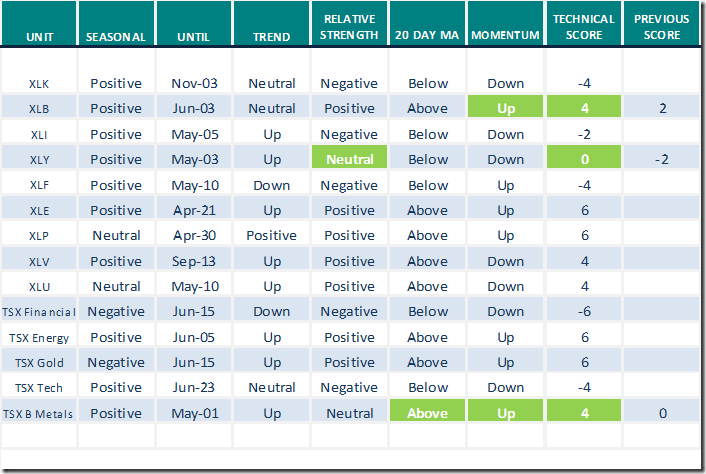
Daily Seasonal/Technical Sector Trends for April 13th 2021
Green: Increase from previous day
Red: Decrease from previous day
All seasonality ratings are based on performance relative to the S&P 500 Index (except TSX)
Links from Valued Providers
Comments from Mark Bunting and www.uncommonsenseinvestor.com
Three Rip Van Winkle Stocks – Uncommon Sense Investor
Five Reasons the Worst May Be Over for Stocks – Uncommon Sense Investor
John Kosar from www.StockCharts.com says “Market on the verge of a steeper decline”.
https://www.youtube.com/watch?v=y8pxca_B9-8
S&P 500 Momentum Barometers
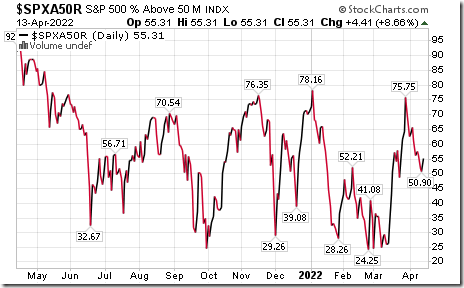
The intermediate term Barometer added 4.41 to 55.31 yesterday. It remains Neutral.
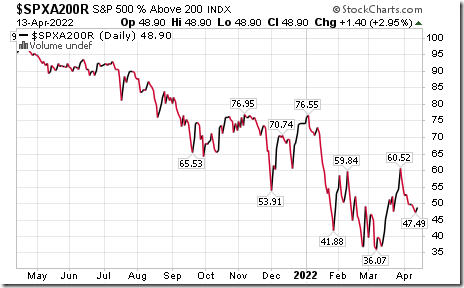
The long term Barometer added 1.40 to 48.90 yesterday. It remains Neutral.
TSX Momentum Barometers
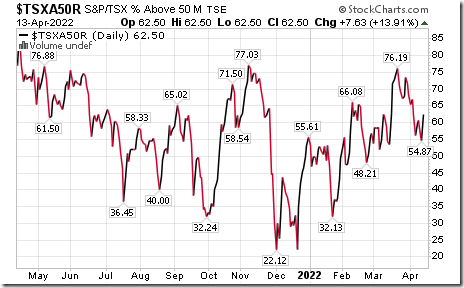
The intermediate term Barometer added 7.63 to 62.50 yesterday. It changed from Neutral to Overbought on a move above 60.00.
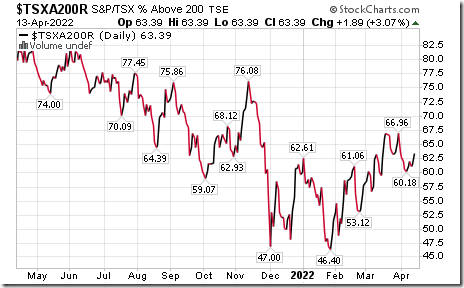
The long term Barometer added 1.89 to 63.39 yesterday. It remains Overbought.
Disclaimer: Seasonality and technical ratings offered in this report and at
www.equityclock.com are for information only. They should not be considered as advice to purchase or to sell mentioned securities. Data offered in this report is believed to be accurate, but is not guaranteed.
This post was originally publised at Vialoux's Tech Talk.


