by Don Vialoux, EquityClock.com
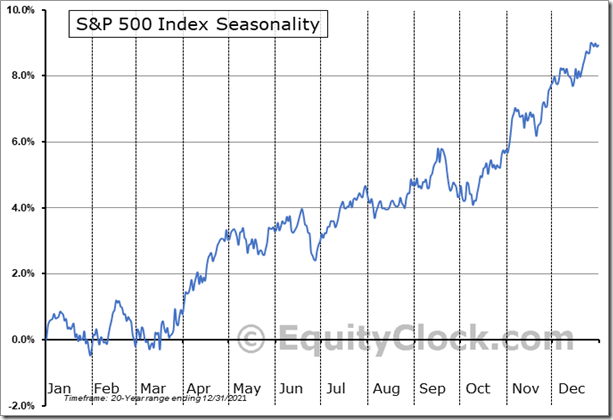
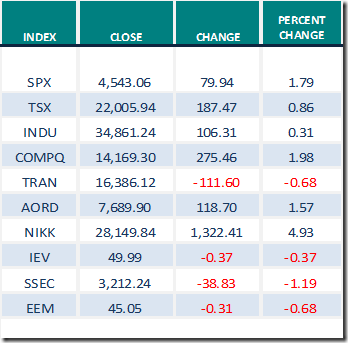
The traditional Spring rally by North American equity markets from mid-March to the first week in May continued last week.
During the past 20 years, April has been the strongest month in the year for the S&P 500 Index. The Index has gained in 16 of the past 20 periods. Average return per period was 2.40%.
Observations
Consensus earnings estimates for S&P 500 companies on a year-over-year basis in the first quarter of 2022 were unchanged again last week: 66 companies have issued negative guidance to date and 29 companies have issued positive guidance. According to www.FactSet.com first quarter earnings on a year-over-year basis are expected to increase 4.8% and revenues are expected to increase 10.7%.
Consensus estimates for S&P 500 companies beyond the first quarter on a year-over-year basis increased slightly. According to www.FactSet.com second quarter earnings are expected to increase 5.6% (versus 5.4% last week) and revenues are expected to increase 9.7%. Earnings on a year-over-year basis for all of 2022 are expected to increase 9.4% (versus 9.3% last week) and revenues are expected to increase 9.0%.
Economic News This Week
March ADP Private Employment Report to be released at 8:15 AM EDT on Wednesday is expected to show an increase of 450,000 versus a gain of 475,000 in February.
Fourth Quarter U.S. annualized GDP to be released at 8:30 AM EDT on Wednesday is expected to show growth at a 7.1% rate versus growth at a 7.0% rate in the third quarter.
February Personal Income to be released at 8:30 AM EDT on Thursday is expected to increase 0.5% versus a gain of 0.4% in January. February Personal Spending is expected to increase 0.5% versus a gain of 2.1% in January.
January Canadian GDP to be released at 8:30 AM EDT on Thursday is expected to increase 0.1% versus a gain of 0.6% in December.
March Chicago Purchasing Managers Index to be released at 9:45 AM EDT on Thursday is expected to increase to 56.4 from 56.3 in February.
March Non-farm Payrolls to be released at 8:30 AM EDT on Friday is expected to increase 486,000 versus a gain of 678,000 in February. March Unemployment Rate is expected to slip to 3.7% from 3.8% in February. March Average Hourly Earnings are expected to increase 0.4% versus a gain of 0.6% in February. On a year-over-year basis, March Average Hourly Earnings are expected to increase 5.5% versus a gain of 5.1% in February.
February Construction Spending to be released at 10:00 AM EDT on Friday is expected to increase 0.9% versus a gain of 1.3% in January.
March ISM Manufacturing Index to be released at 10:00 AM EDT on Friday is expected to slip to 58.4 from 58.6 in February.
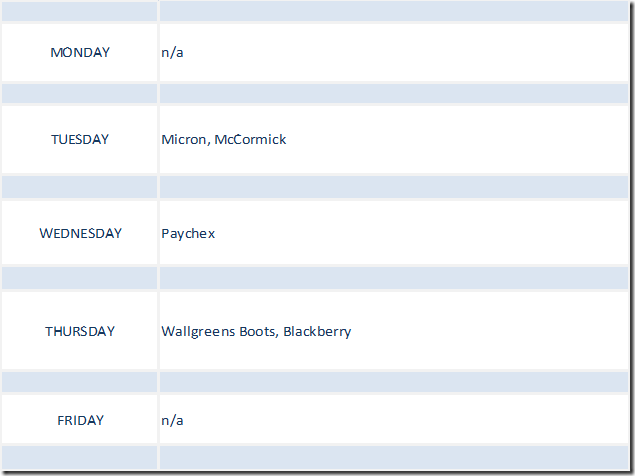
Earnings News This Week
Trader’s Corner
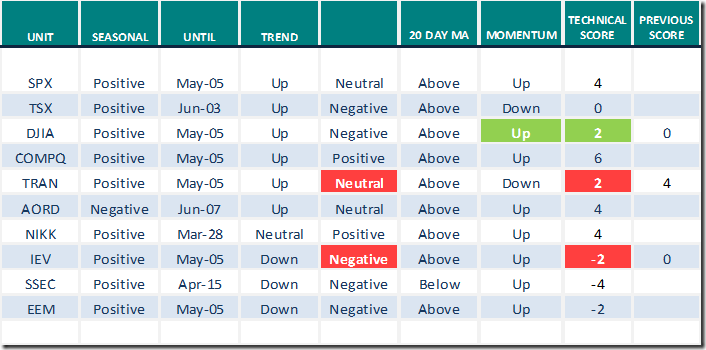
Equity Indices and Related ETFs
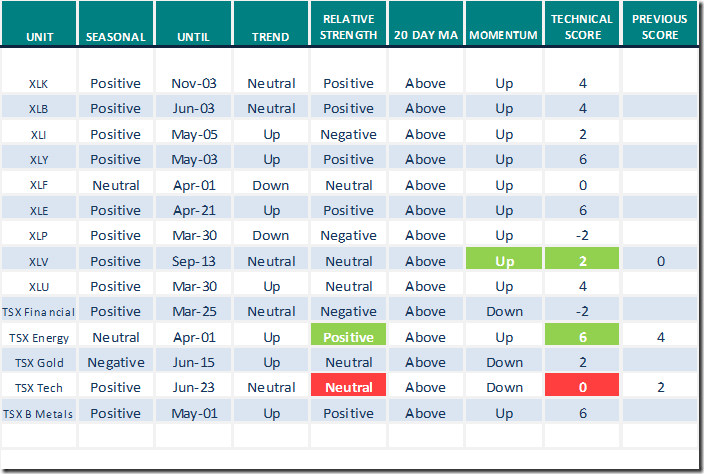
Daily Seasonal/Technical Equity Trends for March 25th 2022
Green: Increase from previous day
Red: Decrease from previous day
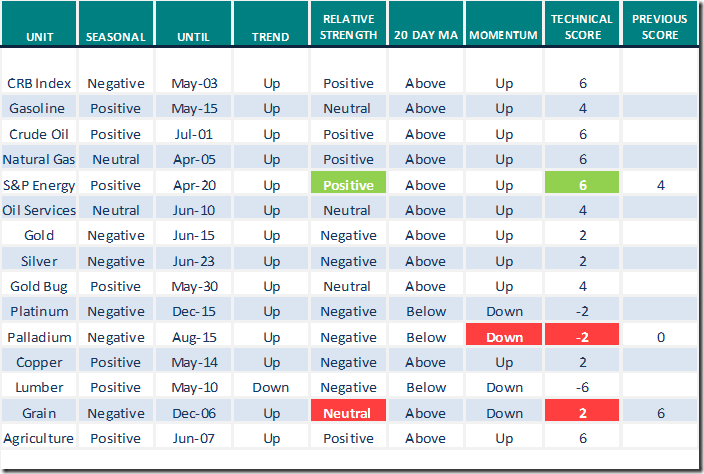
Commodities
Daily Seasonal/Technical Commodities Trends for March 25th 2022
Green: Increase from previous day
Red: Decrease from previous day
Sectors
Daily Seasonal/Technical Sector Trends for March 25th 2021
Green: Increase from previous day
Red: Decrease from previous day
All seasonality ratings are based on performance relative to the S&P 500 Index (except TSX)
Links offered by Valued Providers
Weekly Mark Leibovit’s comments:
Cannabis, Uranium, Cryptos, Electric Vehicles – HoweStreet
Seven themes that have emerged: Authur Hill from www.stockcharts.com
https://www.youtube.com/watch?v=PyTTlQpUXLE
Links from Mark Bunting and www.uncommonsenseinvestor.com
Seven Attractive Bets from Legendary Stock Picker Bill Miller – Uncommon Sense Investor
The S&P 500 is Overvalued by 62% Based on These Historical Charts – Uncommon Sense Investor
Comments by Tom Bowley
Is this Bear Market Rally Ending? These 2 Charts Will Tell Us | ChartWatchers | StockCharts.com
Comments by Mary Ellen McGonagle
The Markets Have Bottomed – Here’s Where You Need to be Investing | ChartWatchers | StockCharts.com
Michael Campbell’s Money Talks for Saturday March 25th
March 26th Episode (mikesmoneytalks.ca)
Weekly Technical Scoop from David Chapman and www.EnrichedInvesting.com
To be added
Technical Scores
Calculated as follows:
Intermediate Uptrend based on at least 20 trading days: Score 2
(Higher highs and higher lows)
Intermediate Neutral trend: Score 0
(Not up or down)
Intermediate Downtrend: Score -2
(Lower highs and lower lows)
Outperformance relative to the S&P 500 Index: Score: 2
Neutral Performance relative to the S&P 500 Index: 0
Underperformance relative to the S&P 500 Index: Score –2
Above 20 day moving average: Score 1
At 20 day moving average: Score: 0
Below 20 day moving average: –1
Up trending momentum indicators (Daily Stochastics, RSI and MACD): 1
Mixed momentum indicators: 0
Down trending momentum indicators: –1
Technical scores range from -6 to +6. Technical buy signals based on the above guidelines start when a security advances to at least 0.0, but preferably 2.0 or higher. Technical sell/short signals start when a security descends to 0, but preferably -2.0 or lower.
Long positions require maintaining a technical score of -2.0 or higher. Conversely, a short position requires maintaining a technical score of +2.0 or lower
Changes Last Week
Technical Notes released on Friday at
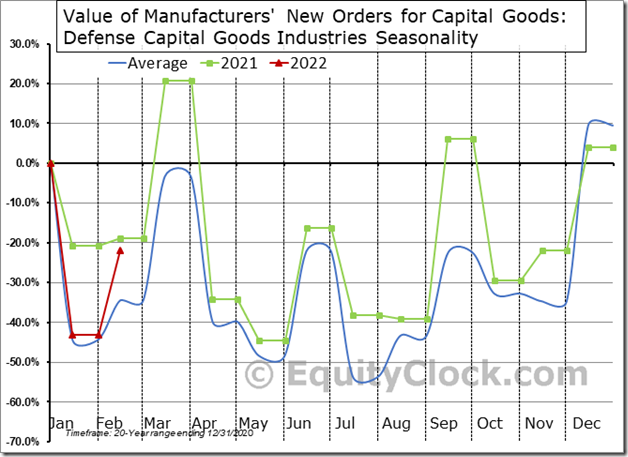
As geopolitical tensions rise, defense capital goods orders are expanding, elevating the year-to-date change to 12.5% above the seasonal norm through the first two months of the year. This creates a tailwind behind the stocks with exposure. $STUDY $MACRO $ITA $LMT $RTX $BA $TXT $GD $LHX $NOC
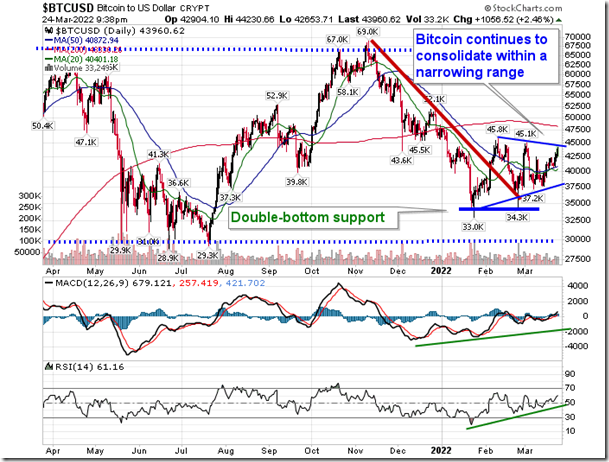
The stability of Bitcoin is seen as a positive for risk assets in this market rebound, but we still need to see a break above $45,000 in order to place it back on our list of market segments to accumulate. equityclock.com/2022/03/24/… $BTC.X $GBTC $BTC_F $BITO
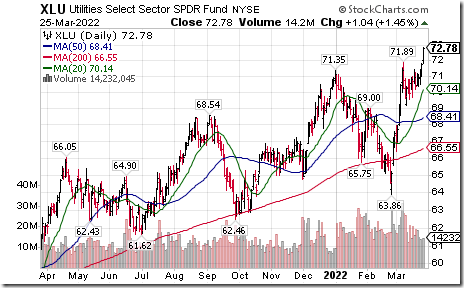
Utilities SPDRs $XLU moved above $71.89 to an all-time high extending an intermediate uptrend. Seasonal influences are favourable to July 2nd. If a subscriber to EquityClock, see seasonality chart at https://charts.equityclock.com/utilities-select-sector-spdr-fund-nysexlu-seasonal-chart
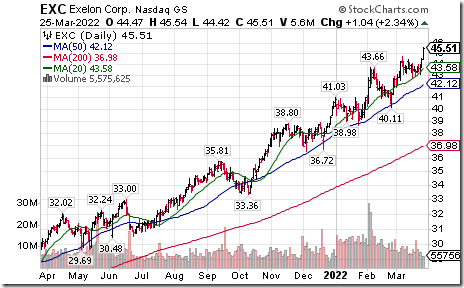
Exelon $EXC an S&P 100 stock moved above $44.73 extending an intermediate uptrend. Seasonal influences are favourable to June 14th. If a subscriber to EquityClock, see seasonality chart at https://charts.equityclock.com/exelon-corporation-nyseexc-seasonal-chart
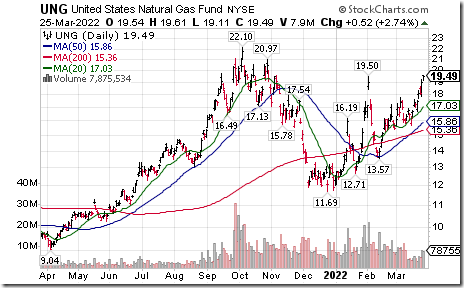
Natural Gas ETN $UNG moved above $19.50 extending an intermediate uptrend. Seasonal influences are favourable to June 29th. If a subscriber to EquityClock, see seasonality chart at https://charts.equityclock.com/united-states-natural-gas-fund-nyseung-seasonal-chart
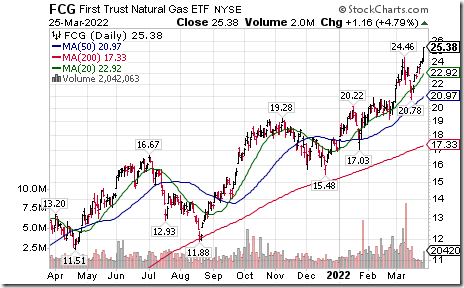
Natural gas equity ETF $FCG moved above $24.36 extending an intermediate uptrend. Responding to higher natural gas prices. Seasonal influences are favourable to June 11th. If a subscriber to EquityClock, see the seasonality chart at
https://charts.equityclock.com/first-trust-natural-gas-etf-nysefcg-seasonal-chart
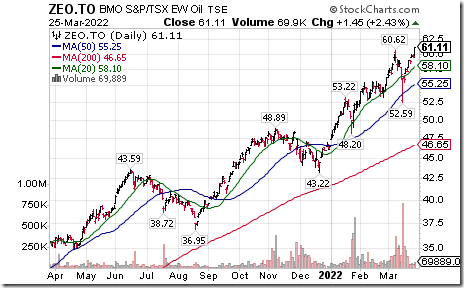
BMO Equal Weight Oil and Gas ETF $ZEO.CA moved above $60.62 extending an intermediate uptrend. Seasonal influences are favourable to June 2nd. If a subscriber to EquityClock, see seasonality chart at https://charts.equityclock.com/bmo-sp-tsx-equal-weight-oil-gas-index-etf-tsezeo-seasonal-chart
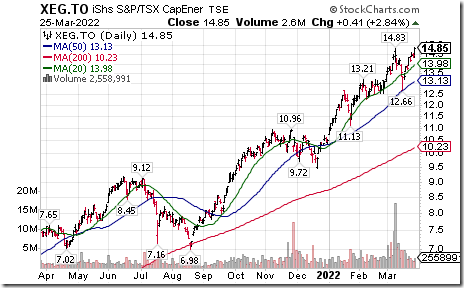
TSX Energy iShares $XEG.CA moved above $14.83 to an 8 year high extending an intermediate uptrend.
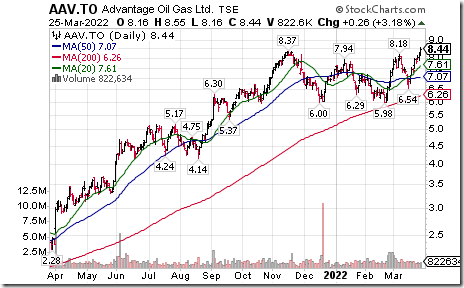
Canadian "gassy" stocks are responding to higher natural gas prices. Birchcliff Energy $BIR.CA moved above $7.83. Advantage Oil and Gas $AAV.CA moved above $8.37 extending an intermediate uptrend. Both have favourable seasonality to late May/Early June. If a subscriber to EquityClock, see seasonality chart at https://charts.equityclock.com/advantage-oil-gas-tseaav-seasonal-chart
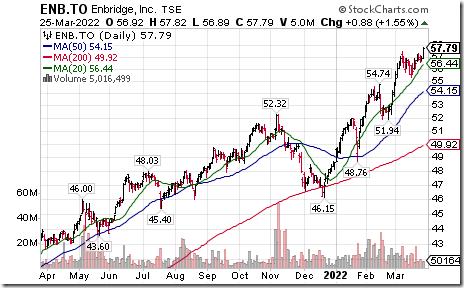
Enbridge $ENB.CA a TSX 60 stock moved above Cdn$57.54 to an all-time high extending an intermediate uptrend.
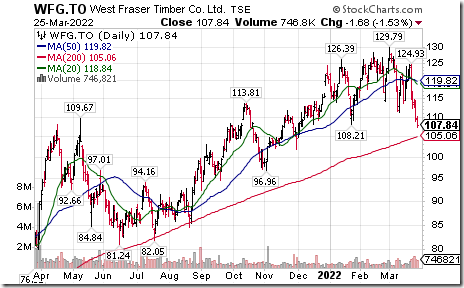
Canadian lumber producer stocks remain under technical pressure in response to lower lumber prices. $CFP.CA $IFP.CA and $WFG.CA are lower again this morning. West Fraser Timber moved below intermediate support at Cdn$108.21 extending an intermediate downtrend.
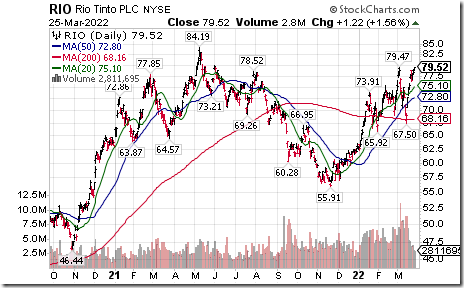
Rio Tinto $RIO one of the world’s largest base metals producer moved above $79.47 extending an intermediate uptrend.
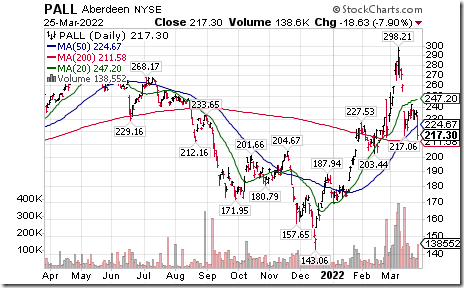
Palladium ETN $PALL moved below $217.06 setting an intermediate downtrend.
S&P 500 Momentum Barometers
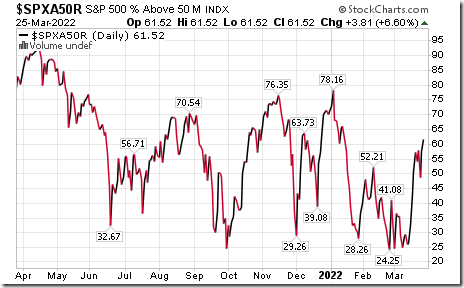
The intermediate term Barometer added 3.81 on Friday and 4.41 last week to 61.52. It changed on Friday from Neutral to Overbought on a move above 60.00. Trend is up, No technical signs of a peak have appeared yet.
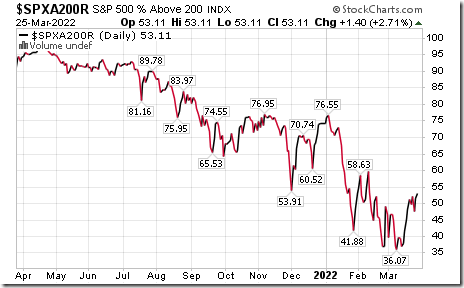
The long term Barometer added 1.40 on Friday and 1.81 last week. It remained Neutral. Trend is up.
TSX Momentum Barometers
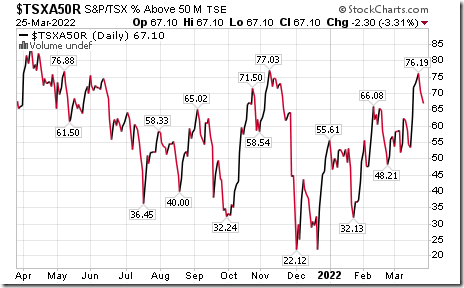
The intermediate term Barometer slipped 2.30 on Friday and 5.86 last week to 67.10. It remains Overbought. Early signs of a peak are indicated.
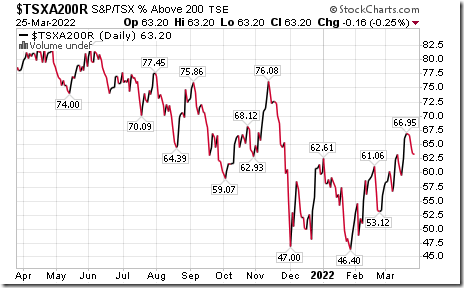
The long term Barometer slipped 0.16 on Friday and 3.75 last week to 63.20. It remains Overbought. Early signs of a peak are indicated.
Disclaimer: Seasonality and technical ratings offered in this report and at
www.equityclock.com are for information only. They should not be considered as advice to purchase or to sell mentioned securities. Data offered in this report is believed to be accurate, but is not guaranteed.
This post was originally publised at Vialoux's Tech Talk.


