by Don Vialoux, EquityClock.com
Technical Notes released yesterday at
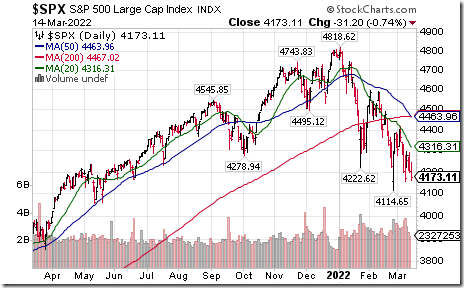
S&P 500 Index $SPX closed at a nine month closing low
Editor’s Note: At the close, the Index completed a “Death Cross” pattern when its 50 day moving average dropped below its 200 day moving average.
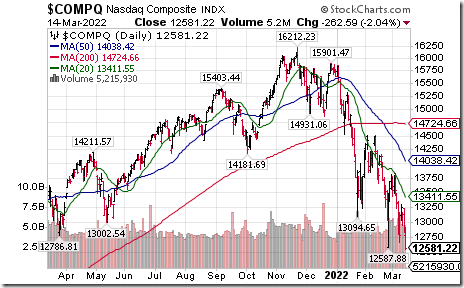
NASDAQ Composite Index $COMPQ moved below 12,587.88 extending an intermediate downtrend.
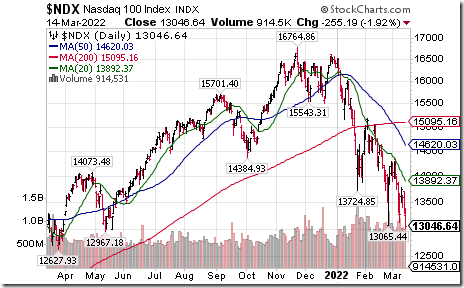
NASDAQ 100 Index $NDX moved below 13,065.44 extending an intermediate downtrend.
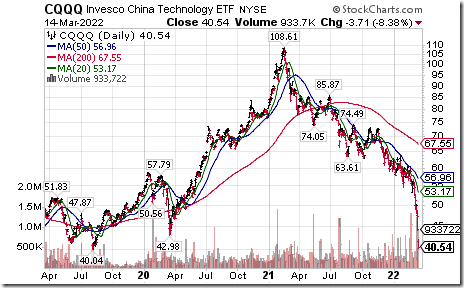
A major meltdown by the Chinese technology ETF $CQQQ !
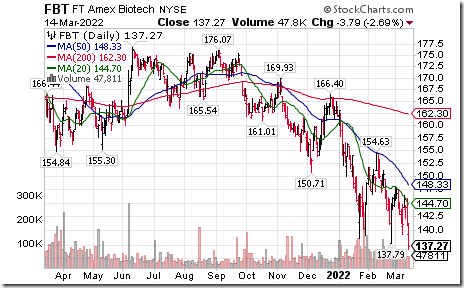
First Trust Biotech ETF $FBT moved below $137.79 extending an intermediate downtrend.
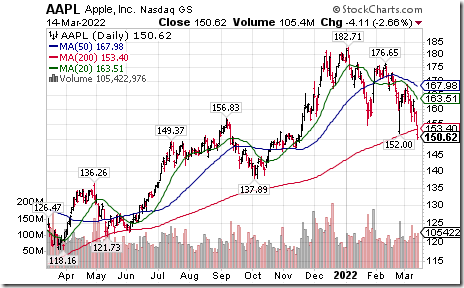
Apple $AAPL an S&P 100 stock moved below $152.00 extending an intermediate downtrend.
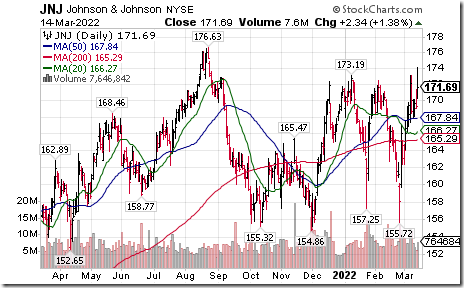
Johnson & Johnson $JNJ a Dow Jones Industrial Average stock moved above $173.19 resuming an intermediate uptrend.
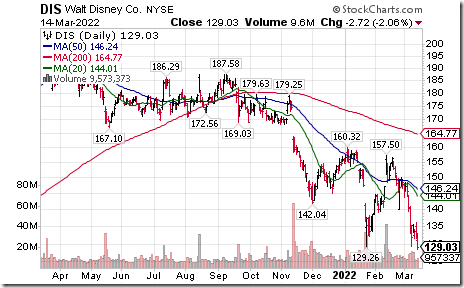
Disney $DIS a Dow Jones Industrial Average stock moved below $129.26 extending an intermediate downtrend.
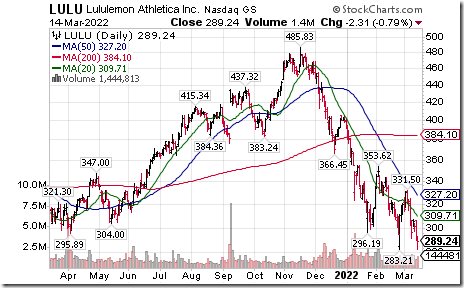
Lululemon $LULU a NASDAQ 100 stock moved below $283.21 extending an intermediate downtrend.
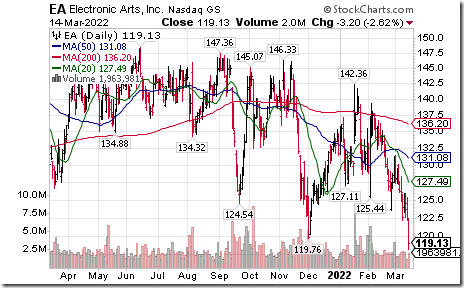
Electronic Arts $EA a NASDAQ 100 stock moved below $119.76 extending an intermediate downtrend.
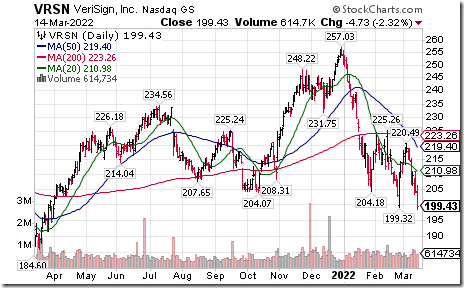
VeriSign $VRSN a NASDAQ 100 stock moved below $199.32 extending an intermediate downtrend.
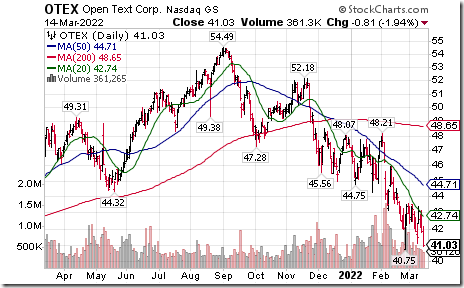
Open Text $OTEX a TSX 60 stock moved below US$40.75 extending an intermediate downtrend.
Trader’s Corner
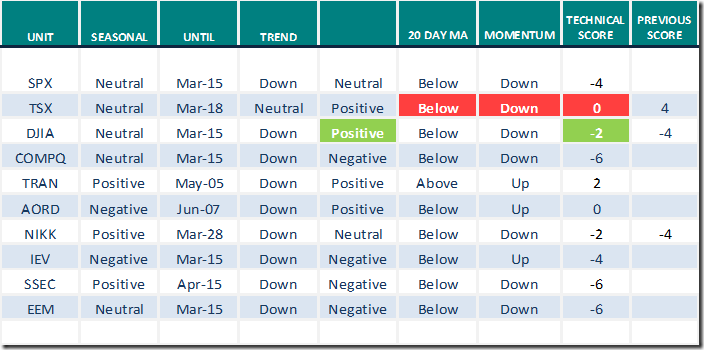
Equity Indices and Related ETFs
Daily Seasonal/Technical Equity Trends for March 14th 2022
Green: Increase from previous day
Red: Decrease from previous day
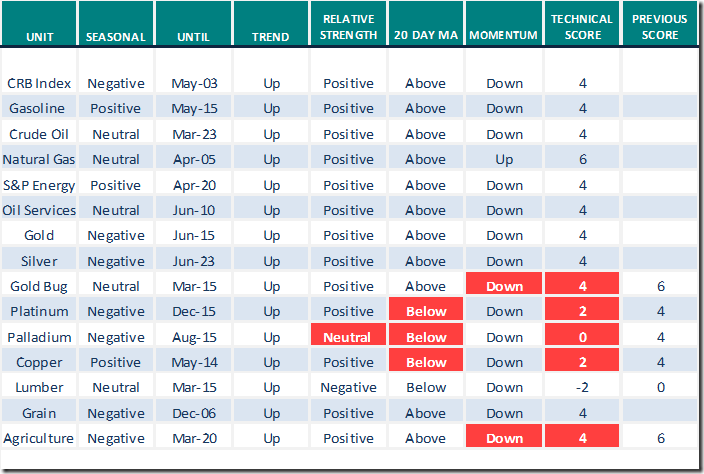
Commodities
Daily Seasonal/Technical Commodities Trends for March 14th 2022
Green: Increase from previous day
Red: Decrease from previous day
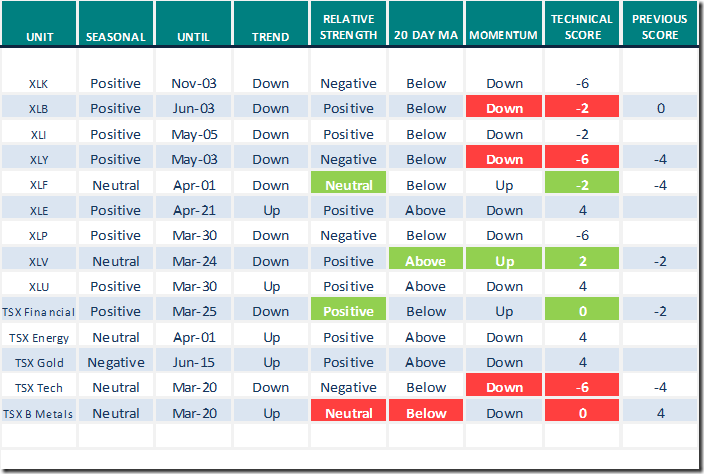
Sectors
Daily Seasonal/Technical Sector Trends for March 14th 2021
Green: Increase from previous day
Red: Decrease from previous day
All seasonality ratings are based on performance relative to the S&P 500 Index (except TSX)
Links from valued providers
Larry Tentarelli from www.stockcharts.com says “QQQ near key support level”.
https://www.youtube.com/watch?v=8WbYi9KmDe4
History: Behind the charts with Tony Dwyer (Link from Feb.27th 2020)
https://www.youtube.com/watch?v=s1Lg2DMrRPE
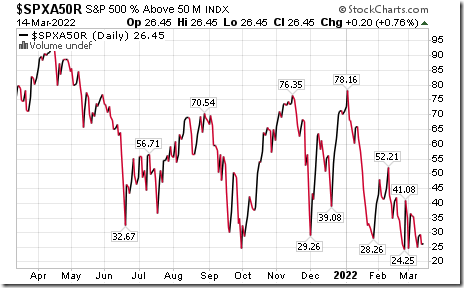
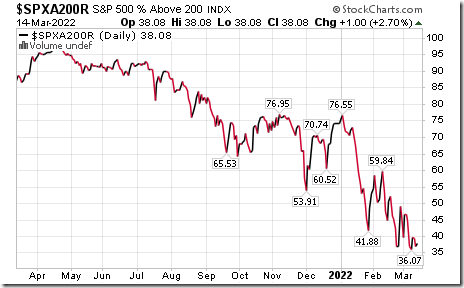
S&P 500 Momentum Barometers
The intermediate term Barometer added 0.20 to 26.45 yesterday. It remains Oversold. Trend remains down.
The long term Barometer added 1.00 to 38.08 yesterday. It remains Oversold.
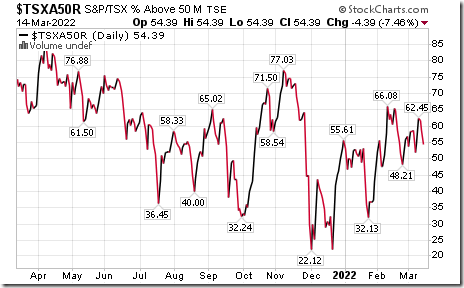
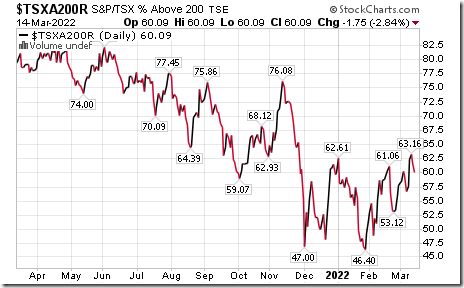
TSX Momentum Barometers
The intermediate term Barometer dropped 4.39 to 54.39 yesterday. It remains Neutral.
The long term Barometer slipped 1.75 to 60.09 yesterday. It remains Overbought.
Disclaimer: Seasonality and technical ratings offered in this report and at
www.equityclock.com are for information only. They should not be considered as advice to purchase or to sell mentioned securities. Data offered in this report is believed to be accurate, but is not guaranteed.
This post was originally publised at Vialoux's Tech Talk.


