by Don Vialoux, EquityClock.com
Technical Notes released yesterday at
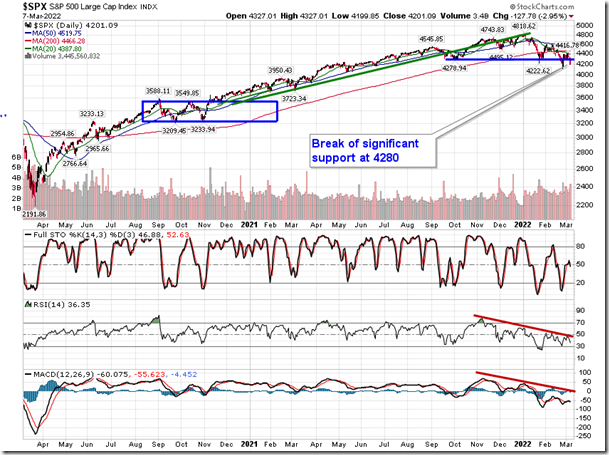
S&P 500 Index has broken back below significant support at 4280, reigniting the risk of the completion of the head-and-shoulders topping pattern. equityclock.com/2022/03/07/… $SPX $SPY $ES_F
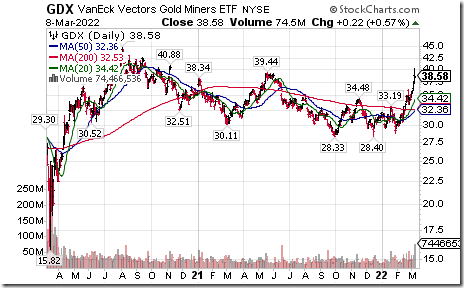
Gold equity ETF $GDX moved above $39.44 extending an intermediate uptrend.
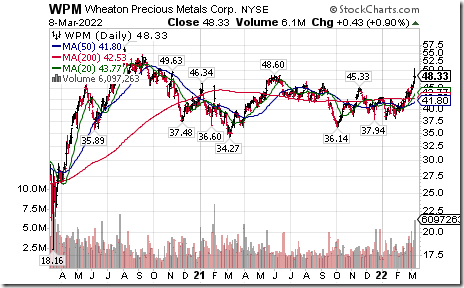
Wheaton Precious Metals $WPM a TSX 60 stock moved above US$48.60 extending an intermediate uptrend. Seasonal influences are favourable to the end of April. If a subscriber to EquityClock, see charts.equityclock.com/silv…
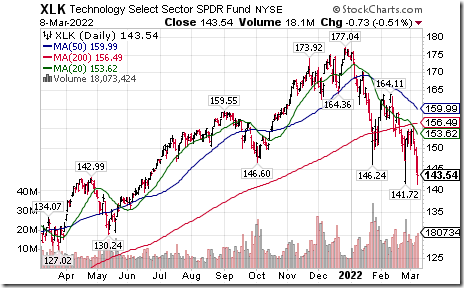
Technology SPDRs $XLK moved below $141.72 extending a Head & Shoulders pattern.
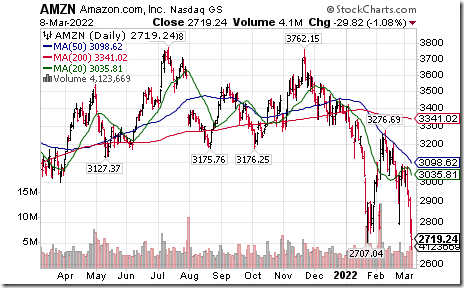
Amazon $AMZN an S&P 100 stock moved below $2,707.04 extending an intermediate downtrend
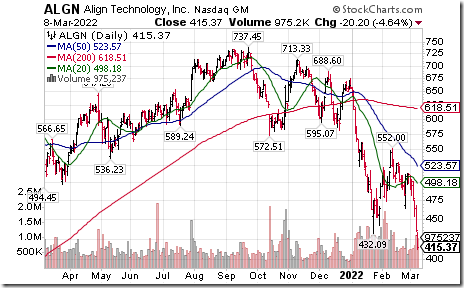
Align Technology $ALGN a NASDAQ 100 stock moved below $432.09 extending an intermediate downtrend.
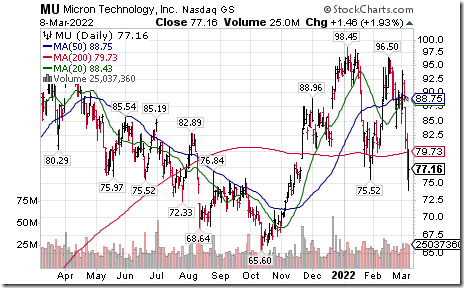
Micron $MU a NASDAQ 100 stock moved below $75.52 extending an intermediate downtrend
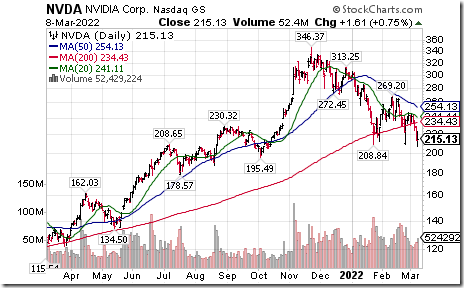
Nvidia $NVDA a NASDAQ 100 stock moved below $208.84 extending an intermediate downtrend
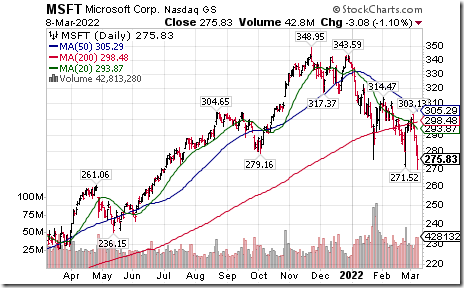
Microsoft $MSFT a Dow Jones Industrial Average stock moved below $271.52 extending a Head & Shoulders pattern.
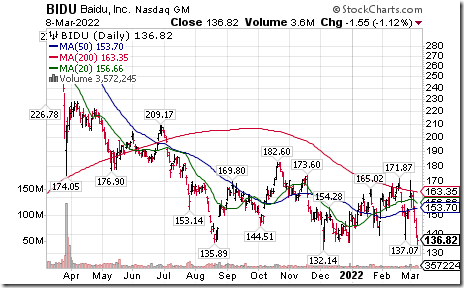
Baidu $BIDU a NASDAQ 100 stock moved below $132.14 extending an intermediate downtrend.
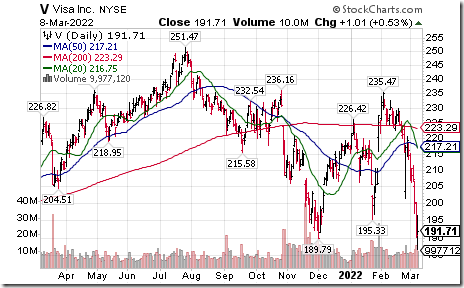
Visa $V a Dow Jones Industrial Average stock moved below $189.79 extending an intermediate downtrend
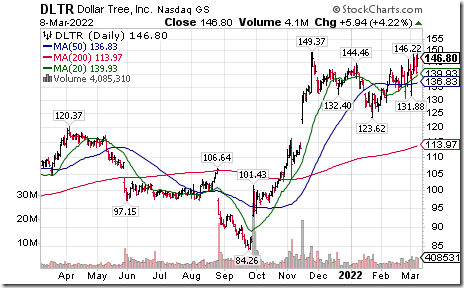
Dollar Tree $DLTR a NASDAQ 100 stock moved above $149.37 to an all-time high extending an intermediate uptrend. Seasonal influences are favourable to early July. If a subscriber to EquityClock, see seasonality chart at https://charts.equityclock.com/dollar-tree-inc-nasdaqdltr-seasonal-chart
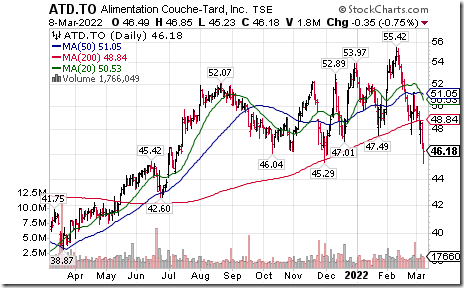
Couche Tard $ATD.CA a TSX 60 stock moved below $45.29 extending an intermediate downtrend.
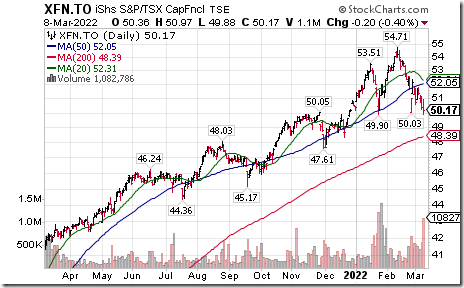
TSX Financials iShares $XFN.CA moved below $49.90 completing a Head & Shoulders pattern.
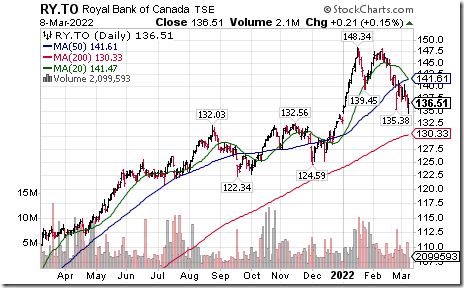
Royal Bank $RY.CA a TSX 60 stock moved below Cdn$135.38 extending an intermediate downtrend.
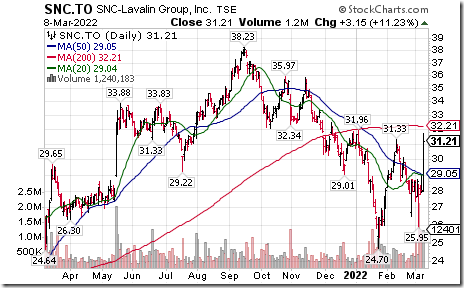
SNC Lavalin $SNC.CA a TSX 60 stock moved above $31.33 extending an intermediate uptrend. Seasonal influences are favourable to late June. If a subscriber to EquityClock, see seasonality chart at https://charts.equityclock.com/snc-lavalin-group-inc-tsesnc-seasonal-chart
Trader’s Corner
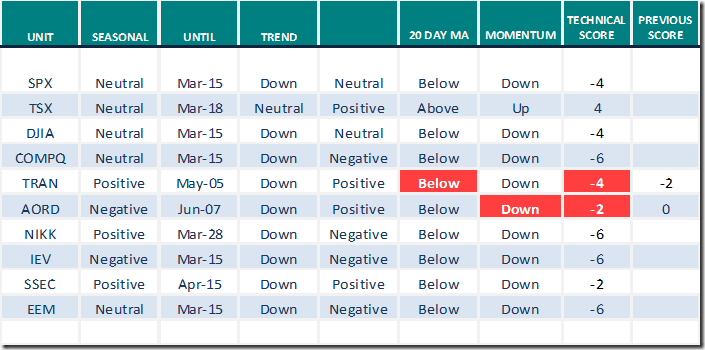
Equity Indices and Related ETFs
Daily Seasonal/Technical Equity Trends for March 8th 2022
Green: Increase from previous day
Red: Decrease from previous day
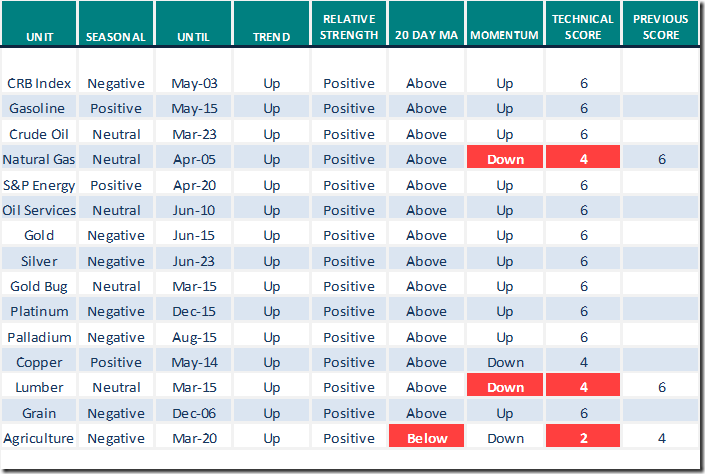
Commodities
Daily Seasonal/Technical Commodities Trends for March 8th 2022
Green: Increase from previous day
Red: Decrease from previous day
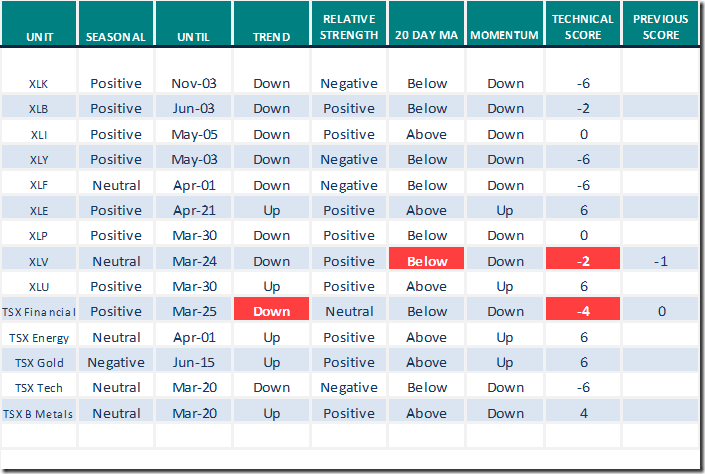
Sectors
Daily Seasonal/Technical Sector Trends for March 8th 2021
Green: Increase from previous day
Red: Decrease from previous day
All seasonality ratings are based on performance relative to the S&P 500 Index (except TSX)
S&P 500 Momentum Barometers
The intermediate term Barometer dropped another 4.01 to 25.25 yesterday. It remains Oversold, but has yet to show technical signs of a bottom.
The long term Barometer slipped another 1.00 to 36.07 yesterday. It remains Oversold. Downtrend was extended.
TSX Momentum Barometers
The intermediate term Barometer added 2.82 to 54.59 yesterday. It remains Neutral.
The long term Barometer added 0.87 to 57.64 yesterday. It remains Neutral.
Disclaimer: Seasonality and technical ratings offered in this report and at
www.equityclock.com are for information only. They should not be considered as advice to purchase or to sell mentioned securities. Data offered in this report is believed to be accurate, but is not guaranteed
This post was originally publised at Vialoux's Tech Talk.


![clip_image001[5] clip_image001[5]](https://advisoranalyst.com/wp-content/uploads/2022/03/clip_image0015_thumb-1.png)
![clip_image002[5] clip_image002[5]](https://advisoranalyst.com/wp-content/uploads/2022/03/clip_image0025_thumb.png)
![clip_image003[5] clip_image003[5]](https://advisoranalyst.com/wp-content/uploads/2022/03/clip_image0035_thumb.png)
![clip_image004[5] clip_image004[5]](https://advisoranalyst.com/wp-content/uploads/2022/03/clip_image0045_thumb.png)


