by Don Vialoux, EquityClock.com
The Bottom Line
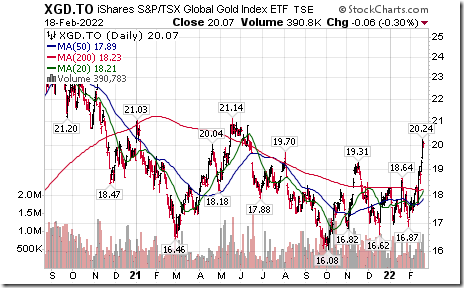
Uncertainty triggered by anticipation of a pending military conflict in Ukraine weighed on world equity markets last week. Precious metal prices and related equities and Exchange Traded Funds responded on the upside.
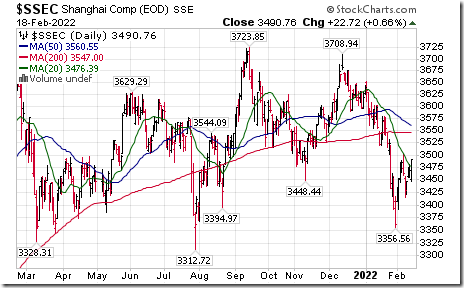
Chinese equity indices and related Exchange Traded Funds were the exception. They entered their traditional seasonal rally after the Chinese New Year celebration. Seasonal influences are favourable until mid-April. Canadian investors can participate in Canadian Dollars with XCH.TO and ZCH.TO
Observations
Consensus earnings and revenue estimates on a year-over-year basis for S&P 500 companies for the fourth quarter of 2021 continued to increase: 84% of companies have released results to date with 77% reporting higher than consensus earnings and 78% reporting higher than consensus revenues. According to www.FactSet.com projected earnings on a year-over-year basis in the fourth quarter are projected to increase 30.9% versus a gain of 29.2% reported last week. Revenues are projected to increase 15.5% versus a gain of 15.0 last week.
Consensus earnings estimates for S&P 500 companies on a year-over-year basis in the first quarter of 2022 were reduced slightly: 55 companies issued negative guidance and 22 companies issued positive guidance. According to www.FactSet.com first quarter earnings on a year-over-year basis are expected to increase 5.2% (versus 5.6% last week) and revenues are expected to increase 10.3% (versus 10.2% last week).
Consensus estimates for S&P 500 companies beyond the first quarter on a year-over-year basis increased slightly. According to www.FactSet.com second quarter earnings are expected to increase 4.7% (up from 4.4% last week) and revenues are expected to increase 8.6%. Earnings on a year-over-year basis for all of 2022 are expected to increase 8.6% and revenues are expected to increase 8.1% (up from 8.0% last week).
Economic News This Week
U.S. fourth quarter real GDP to be released on Thursday at 8:30 AM EST on Thursday is expected to grow at a 7.0% annualized rate versus growth at a 6.9% rate in the third quarter.
January U.S. New Home Sales to be released at 10:00 AM EST on Thursday are expected to slip to 807,000 units from 811,000 units in December.
January Durable Goods Orders to be released at 8:30 AM EST on Friday are expected to increase 0.7% versus a decline of 0.6% in December. Excluding transportation orders, January Durable Goods Orders are expected to increase 0.4% versus a gain of 0.6% in December.
January Personal Spending to be released at 8:30 AM EST on Friday is expected to increase 1.5% versus a decline of 0.6% in December. January Personal Income is expected to drop 0.3% versus a gain of 0.3% in December.
February Michigan Consumer Sentiment to be released at 10:00 AM EST on Friday is expected to drop to 61.7 from 67.2 in January.
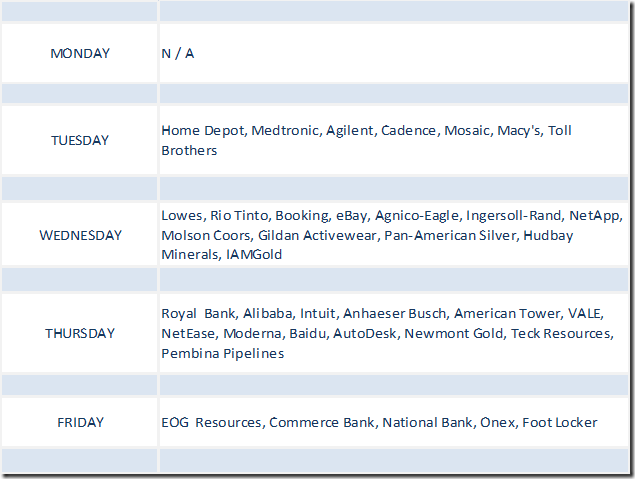
Selected Earnings News This Week
Trader’s Corner
Equity Indices and Related ETFs
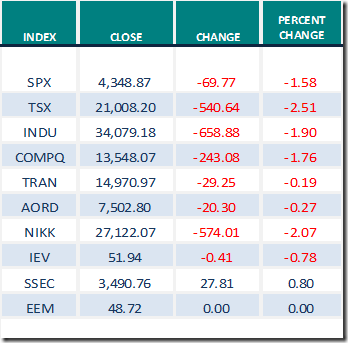
Daily Seasonal/Technical Equity Trends for Feb.18th 2022
Green: Increase from previous day
Red: Decrease from previous day
Commodities
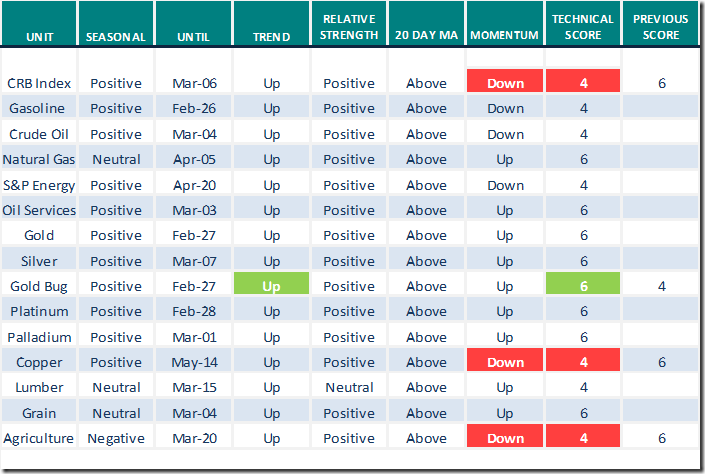
Daily Seasonal/Technical Commodities Trends for Feb.18th 2022
Green: Increase from previous day
Red: Decrease from previous day
Sectors
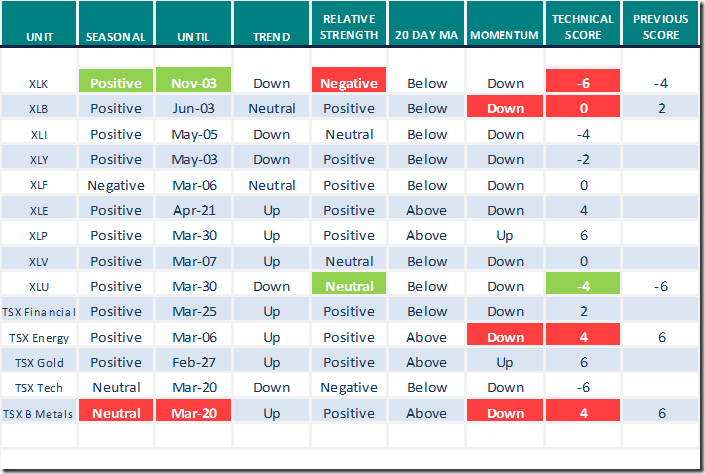
Daily Seasonal/Technical Sector Trends for Feb.18th 2021
Green: Increase from previous day
Red: Decrease from previous day
All seasonality ratings are based on performance relative to the S&P 500 Index (except TSX)
Links offered by valued providers
Weekly Comments by Mark Leibovit
https://www.howestreet.com/2022/02/trucker-freedom-convoy-cryptos-inflation-nfts-mark-leibovit/
Greg Schnell discusses three big names at risk of losing their leadership
Three Big Names at Risk of Losing Their Leadership | ChartWatchers | StockCharts.com
Tom Browley from www.StockCharts.com asks “Are you ready for a Market Meltdown? It’s coming”!
Are You Ready for a Market Meltdown? It’s Coming | ChartWatchers | StockCharts.com
Mary Ellen McGonagle notes that the S&P 500 broke below its 200 day moving average and 50 week moving average. See:
S&P 500 Breaks Key Support | Mary Ellen McGonagle | The MEM Edge (02.18.22) – YouTube
Michael Campbell’s Money Talks for February 19th
February 19th Episode (mikesmoneytalks.ca)
Comments and videos from Mark Bunting and www.uncommonsenseinvestor.com
Three Top Family-Run Companies Churning Out Gains – Uncommon Sense Investor
What Massive Government, Corporate & Household Debt Piles Mean for Investors – YouTube
Tesla Still Number One as Rivals Struggle to Catch Up – Uncommon Sense Investor
Jeremy Grantham’s GMO Identifies 4 Mistakes to Avoid As Stocks Decline (businessinsider.com)
Weekly Technical Scoop from David Chapman and www.EnrichedInvesting.com
Death cross crystallize in NASDAQ Composite Index on Friday for first time in 2 years in a bearish sign for the stock market
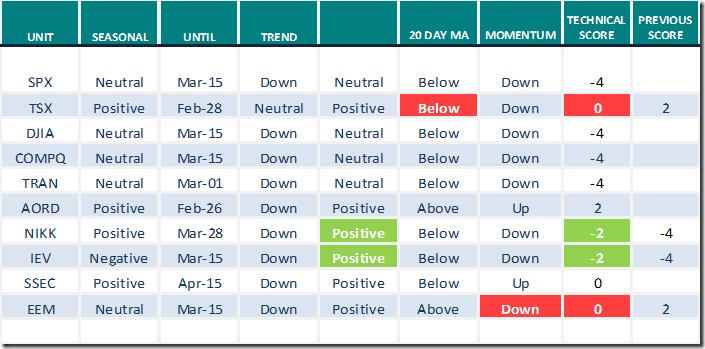
Technical Scores
Calculated as follows:
Intermediate Uptrend based on at least 20 trading days: Score 2
(Higher highs and higher lows)
Intermediate Neutral trend: Score 0
(Not up or down)
Intermediate Downtrend: Score -2
(Lower highs and lower lows)
Outperformance relative to the S&P 500 Index: Score: 2
Neutral Performance relative to the S&P 500 Index: 0
Underperformance relative to the S&P 500 Index: Score –2
Above 20 day moving average: Score 1
At 20 day moving average: Score: 0
Below 20 day moving average: –1
Up trending momentum indicators (Daily Stochastics, RSI and MACD): 1
Mixed momentum indicators: 0
Down trending momentum indicators: –1
Technical scores range from -6 to +6. Technical buy signals based on the above guidelines start when a security advances to at least 0.0, but preferably 2.0 or higher. Technical sell/short signals start when a security descends to 0, but preferably -2.0 or lower.
Long positions require maintaining a technical score of -2.0 or higher. Conversely, a short position requires maintaining a technical score of +2.0 or lower
Changes Last Week
Technical Notes released on Friday at
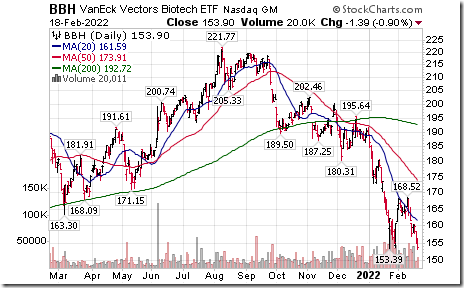
Biotech ETF $BBH moved below $153.39 extending an intermediate downtrend.
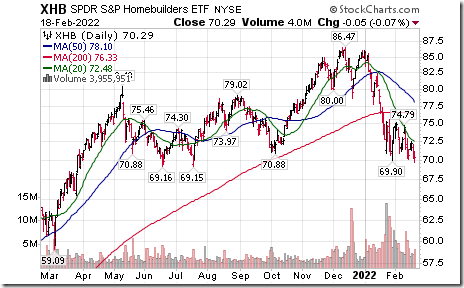
Home Builders SPDRs $XHB moved below $69.90 extending an intermediate downtrend.
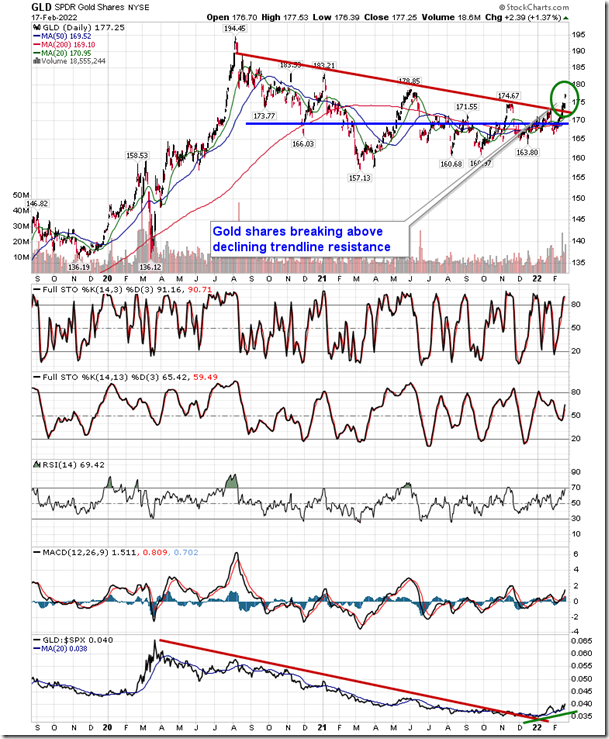
The Gold fund is breaking out as it continues to benefit from the volatility and uncertainty that are notorious of the market in the first couple of months of the year. equityclock.com/2022/02/17/… $GC_F $GLD $SGOL $BAR $GDX $GDXJ $NUGT $JNUG #GOLD
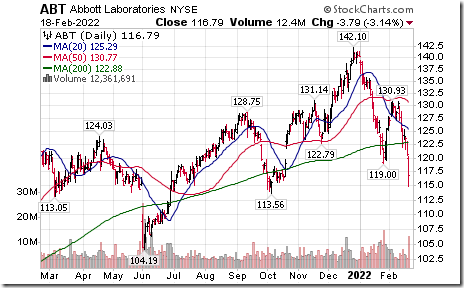
Abbott Labs $ABT an S&P 500 stock moved below $119.00 extending an intermediate downtrend.
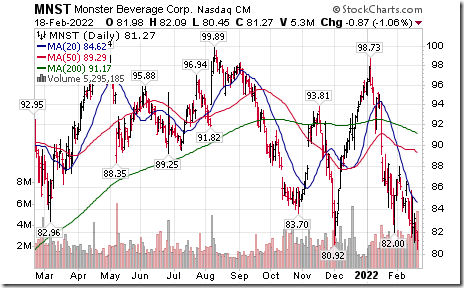
Monster Beverages $MNST a NASDAQ 100 stock moved below $80.92 extending an intermediate downtrend.
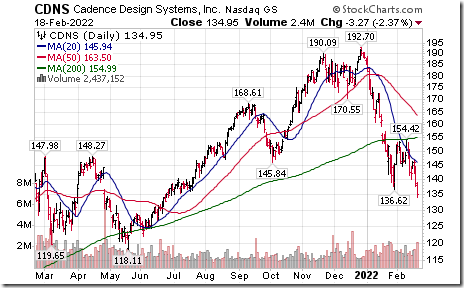
Cadence Design Systems $CDNS a NASDAQ 100 stock moved below $136.62 extending an intermediate downtrend.
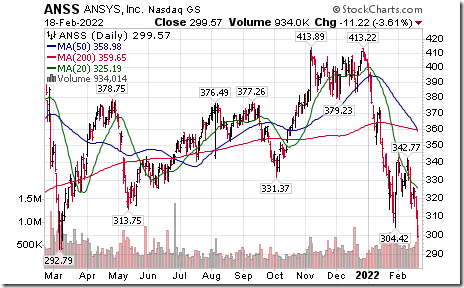
ANSYS $ANSS a NASDAQ 100 stock moved below $304.42 extending an intermediate downtrend
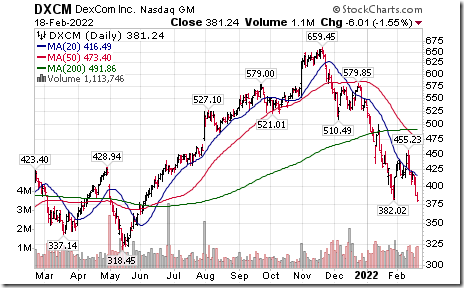
Another technology sector breakdown! DexCom $DXCM a NASDAQ 100 stock moved below $382.02 extending an intermediate downtrend
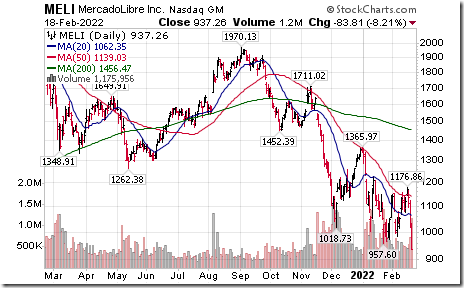
MercadoLibre $MELI a NASDAQ 100 stock moved below $257.60 extending an intermediate downtrend.
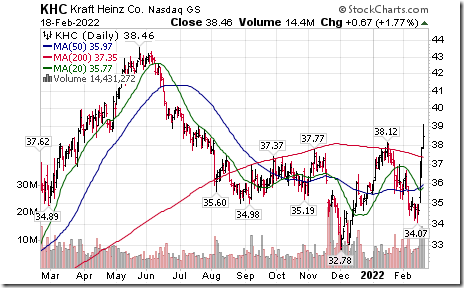
KraftHeinz $KHC a NASDAQ 100 stock moved above $38.12 completing a base building pattern.
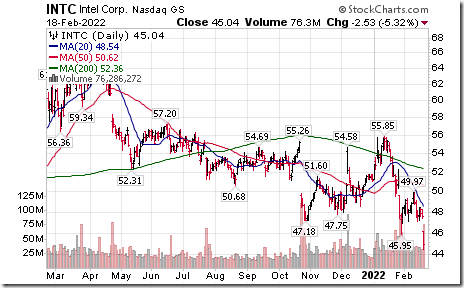
Intel $INTC a Dow Jones Industrial Average stock moved below $45.95 extending an intermediate downtrend.
S&P 500 Momentum Barometers
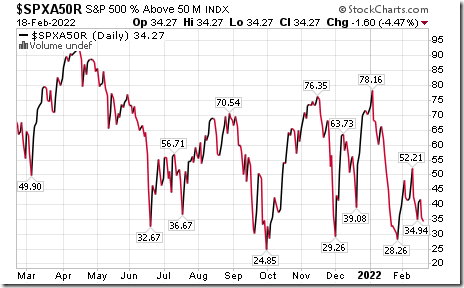
The intermediate term Barometer slipped 1.60 on Friday and 5.49 last week to 34.27. It remains Oversold below 40.00 and trending down. Signs of bottoming have yet to appear. .
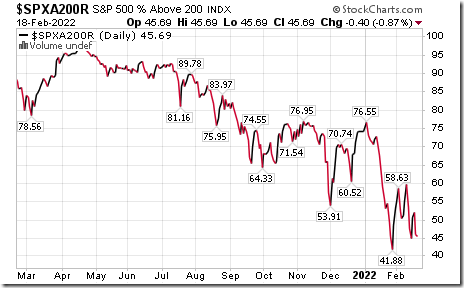
The long term Barometer slipped 0.40 on Friday and 2.10 last week to 45.69. It remains Neutral and trending down.
TSX Momentum Barometers
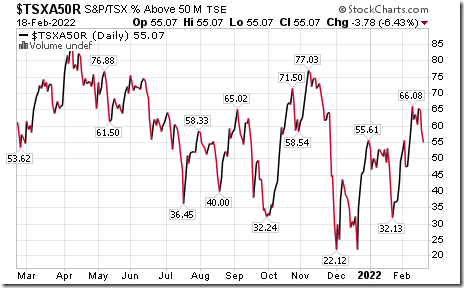
The intermediate term Barometer dropped 3.78 on Friday and 8.49 last week to 55.07. It changed from Overbought to Neutral on a move below 60.00. Trend is down.
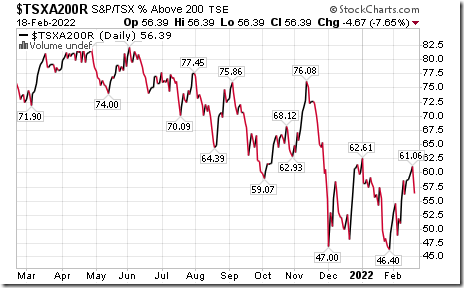
The long term Barometer dropped 4.67 on Friday and 2.28 last week to 56.39. It remains Neutral.
Disclaimer: Seasonality and technical ratings offered in this report and at
www.equityclock.com are for information only. They should not be considered as advice to purchase or to sell mentioned securities. Data offered in this report is believed to be accurate, but is not guaranteed
This post was originally publised at Vialoux's Tech Talk.


