by John Mauldin, Mauldin Economics
Slow-Motion Theft
Mixed Expectations
Sticky Rent
Future Inflation Is Path Dependent
I’m at Least Thinking About Traveling…
But mouse-friend, you are not alone
In proving foresight may be vain:
The best-laid schemes of Mice and Men
Go oft awry,
And leave us only grief and pain,
For promised joy!—Robert Burns, “To a Mouse,” English translation
How much inflation is okay? People have different answers. I think it should be very low, but definitely positive to forestall deflation. Whatever your ideal may be, there’s a range of possibilities that would at least satisfy you. Political scientists call this range the “Overton Window,” a hypothetical box around the limits of acceptable policy. Anything outside the box is, by definition, unacceptable.
Ideologues figured out long ago the way to achieve unacceptable goals is to expand the Overton Window. If you can just bring your radical idea into the discussion where it’s not immediately dismissed, you are on the way to getting it adopted. Sort of like Putin wanting Ukraine to move its borders away from his troops.
The same applies to inflation. I have often written that I’ve been in the room with senior Fed economists and Nobel laureates privately advocating targeting 4% inflation. Nobody ever said that in public. But Bernanke says 2% and then Yellen and Powell suggest we should run hotter than that to get an average of 2%. Maybe two years ago you would have said 4–5% CPI growth was unacceptable. Now, having just seen a 7.5% year-over-year number, 4% suddenly looks a lot better. That’s what happens when the window widens.
Economists talk about “inflation expectations” because what happened in the past and what we expect for the future are two different things. CPI is the past. Worse, it’s not even a very accurate past, as we’ll discuss below. But whatever it was, it’s over. If you’re making some kind of financial decision you have to assume what inflation will be going forward. We all know what they say about assumptions.
The first part of this letter is going to be a general discussion around the concept of inflation and the second part will get into what you really want to know, which is the likely path of inflation over the next 12 months.
But first, we are putting the final touches on the 19th annual Strategic Investment Conference in early May. We have an outstanding lineup of speakers but I really am looking for a few more specific names that I’m having trouble getting in touch with. I’m wondering if you can help me? I want to talk with Matt Taibbi (he has been on fire lately, even though we seemingly are from different perspectives), Marc Andreessen because he is just so profoundly interesting and of course Ray Dalio as I want to touch on some of the points in his last book. If you can help me, send a note to businesses@2000wave.com. And if you have some ideas on the conference, you can drop them in a note there as well. My staff will get them to me.
Slow-Motion Theft
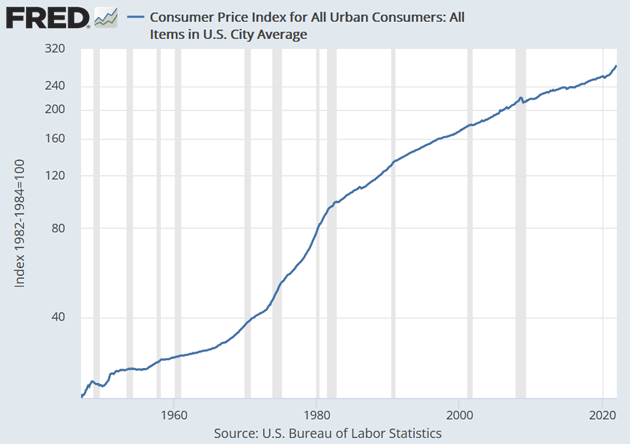
We’ll begin with a chart. This is a long-term look at the Consumer Price Index in a format you don’t often see: the actual index. This one is also a log scale so you can see percentage growth consistently (i.e., the vertical distance from 40 to 80 is the same as 80 to 160, and so on). Take a long look and see if you can find a period since World War II when inflation was “transitory.”
 Source: FRED
Like what you’re reading?
Get this free newsletter in your inbox every Saturday! Read our privacy policy here.
(By the way, I’m going to use “CPI” and “inflation” interchangeably even though we all know CPI has serious flaws and doesn’t accurately reflect most people’s cost of living. We’ll get to that below.)
As you can see, CPI grew steadily for the entire postwar period. The few minor interruptions ended quickly. You can also see clearly how the line bent upward in the late 1960s and 1970s. It then returned to the previous uptrend in the mid-1980s.
For this 75-year period, the index rose 3.44% on average per year, which adds up to almost 13X. Today you need $1,261 to have the same spending power $100 provided in 1947—though this is a rough comparison because today’s economy is qualitatively different. In 1947 you couldn’t buy an iPhone at any price.
Recently, inflation was running below average until the last year or so. A couple decades of that condition narrowed our Overton Window. I suspect we would still be pretty concerned if it had simply popped up to 3% or 4%. That would have been far outside the bounds of recent experience. In reality it’s far worse.
The point I want to stress, though, is that any inflation is a problem. Even 2% inflation—which the Fed now regards as a floor—steals your purchasing power. Slow-motion theft is still theft. Now it’s not even slow motion.
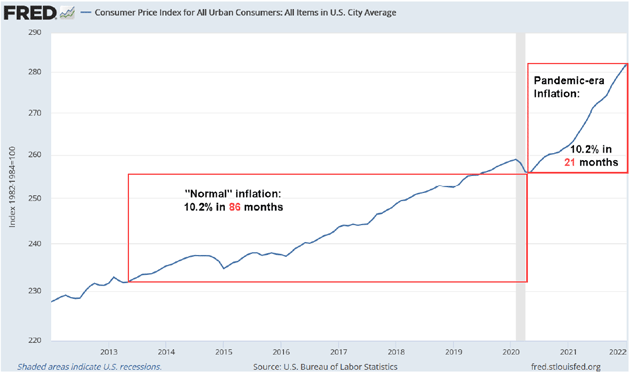
Here’s the same chart as above, zoomed in on the last 10 years and still with a log scale. The two red boxes are the same size vertically, meaning they represent the same amount of inflation.
Source: FRED
From May 2020 through January 2022, CPI rose a total (not annualized) of 10.2%. Going backward from the same point, you have to start at March 2013 to get the same amount of inflation. That means the pace has more than quadrupled.
This calls to mind the old saw of a frog in hot water. We are the frogs and we enjoyed a nice warm bath for many years. Now it’s uncomfortable and getting more so. No surprise, we’re trying to jump out. It’s not as easy as we thought.
Mixed Expectations
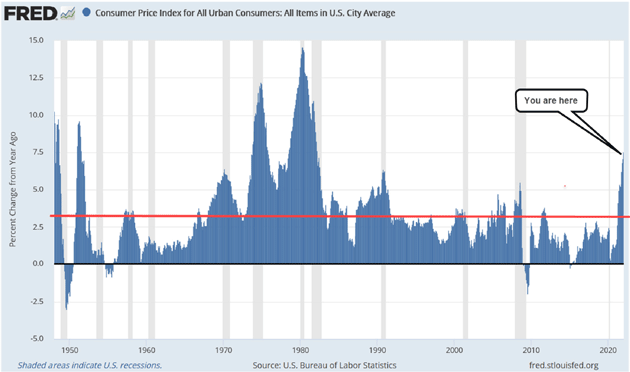
If long-term experience means anything, a 3.5% CPI annual reading would be about normal, although that does get distorted by the inflation of the ‘70s. But it wouldn’t feel normal because most years were above or below the average. Here’s another chart showing annual percent change in CPI. Each bar represents a 12-month period, and the red line is that 3.44% average.
Source: FRED
This gives us a better look at today’s situation vs. different points in the past. CPI growing at a 7.5% annual clip is pretty unusual, previously seen only in the immediate postwar period and the 1970s era.
Like what you’re reading?
Get this free newsletter in your inbox every Saturday! Read our privacy policy here.
Put all that together and we can say two things:
- Some inflation is normal but
- Today’s inflation is not.
Moreover, today’s inflation is abnormal not just because it is abnormally high, but because it is occurring when interest rates are abnormally low, and will likely remain so even if the Fed hikes quite a bit in the next year.
The odd part is that this level of inflation, with wide belief it will remain significant even if somewhat milder, should be driving interest rates a lot higher than they are. What’s going on? I believe the answer is the Fed has broken the markets.
Here’s a chart of five-year expected inflation, inferred from the difference in 5-year Treasury bonds vs. 5-year TIPS Treasury bonds, which have an embedded inflation adjustment. You can see inflation expectations dropped hard in early 2020, then recovered and moved even higher.
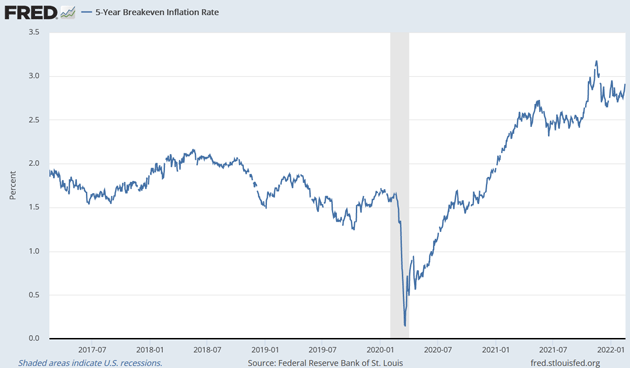
Source: FRED
A couple of oddities here. Expected inflation was running around 1.6% before COVID. Now it’s about 2.9%, and most of that increase occurred in late 2020/early 2021, well before supply chain problems and higher energy prices were in the headlines. Further, 2.9% is still historically below-average inflation. Having been above 7% already, CPI averaging 2.9% over the next five years will require quite a plunge, and soon. How does this make sense?
One explanation is that Treasury yields are being held artificially low by the Federal Reserve’s vast quantitative easing purchases. Yields would have been higher without that intervention, with accordingly higher implied inflation expectations.
Another explanation—which can actually co-exist with the first one—is the market is discounting future economic weakness. Recessions always bring lower inflation if not outright deflation. If growth turns negative for any reason—Fed overshoot, debt collapse, a more serious pandemic, whatever—and stays low for a year, it could easily bring average inflation down to 3% or even lower.
Dave Rosenberg finds that view persuasive. He was early in the “transitory” inflation camp and is sticking to his guns. He thinks the current inflation is almost entirely an artifact of COVID-driven disruptions, which are now being resolved.
Like what you’re reading?
Get this free newsletter in your inbox every Saturday! Read our privacy policy here.
More from Dave below but here’s the rub: Headline inflation isn’t what counts. You can’t eat CPI or PCE. They are imperfect representations of average living costs across a large, hideously complex economy. Saying “Your mileage may vary” is kind of meaningless for people who don’t even have cars.
Inflation is a radically different experience for people who are on foot, vs. those who travel by limousine and private jet.
[WATCH] A shocking shift on Wall Street has permanently closed entire offices and created a brand-new class of stocks called "Wealth Accelerators" that offer gains like 375%, 818%, and even 1,437%.
Click here to watch Thompson Clark's FREE presentation.
Sticky Rent
Wholesale prices, at least as measured by the Producer Price Index (PPI) have been climbing even faster than consumer prices. PPI rose 1% in January alone and 9.7% in the last 12 months.
Here’s what Ben Hunt, who never minces words, said on Twitter after the PPI news.
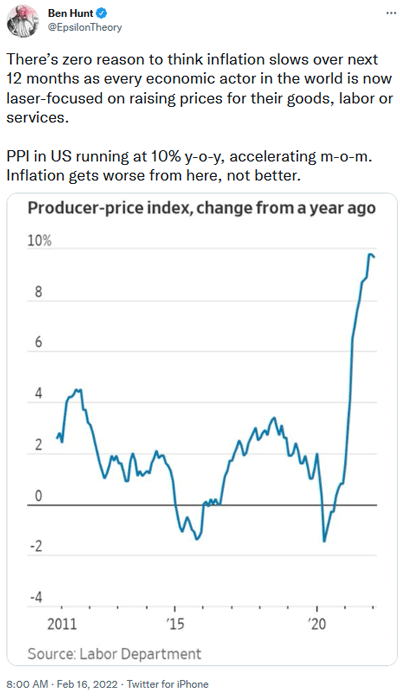
Source: Ben Hunt
In theory, higher production costs should push final goods costs up as well. In practice it’s not quite so simple. Companies can find ways to cut other costs or accept lower profit margins. Competition matters but, as I mentioned last week, competition in many sectors isn’t as robust as it used to be.
Here we get another oddity: rising profit margins at large-cap companies even as production costs go sharply higher. Obviously, there’s a lot of variation. But in the aggregate, many businesses have enough pricing power to offset higher input costs.
That’s actually the mechanism by which fiscal and monetary stimulus generates price inflation. More cash in consumers’ pockets makes them less price-sensitive, letting producers raise prices without losing sales. It’s not an accident. Everyone is doing exactly what they are incentivized to do.
Now, this effect should fade as the stimulus works its way through the economy. It will happen at different rates in different segments. Evidence is growing that higher housing costs will be “sticky” for a long time. This is important because housing is the single largest expense for most American households. And whether you rent or own, your costs are probably rising.
Let’s look at rent first. According to the Consumer Price Index, rent of primary residences rose 3.8% in 2021. Your mileage may not just vary, but vary wildly. Here’s some apartment rental data from John Burns, via Axios.

Source: Axios
Like what you’re reading?
Get this free newsletter in your inbox every Saturday! Read our privacy policy here.
Those are the hottest areas but the Burns data shows 13% average annual rent growth across all major markets last year. CPI at 3.8% is nowhere near that, in part because CPI includes renewal rates which are typically lower. But not that much lower.
Personal note: My son Trey recently moved to the Orlando area where he has a significantly higher-paying job than he had in Texas and Oklahoma. He is now looking for apartments. The price for a one-bedroom apartment is simply staggering compared to the equivalent a year ago in Texas or Oklahoma. It way more than consumes the increase in his salary. But more expensive food, energy, etc., etc., is real as well.
Not everyone rents, but for CPI purposes the calculation assumes your housing cost is an imputed “owner’s equivalent rent,” what you would have to pay to rent the same home you currently own. This is necessarily imprecise, but you would think it broadly matches actual home prices. It doesn’t.
Here’s a chart comparing OER (red line) with median home prices (blue line), both indexed to January 2020. Through Q3 2021, home prices rose 24% while OER rose only 4.8% in the same period.
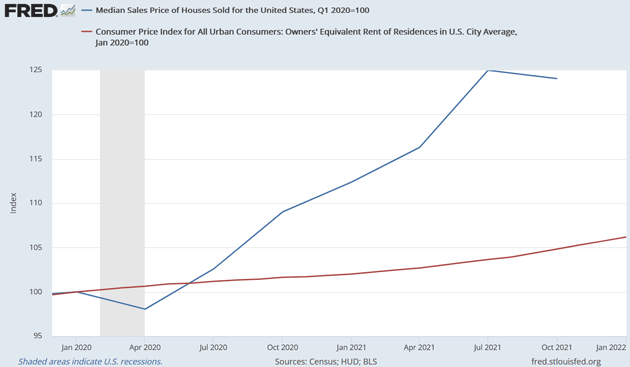
Source: FRED
Admittedly, home prices are relevant only if you have to buy a house. If you owned yours prior to 2020, your mortgage payment probably hasn’t changed much (though taxes and maintenance are likely higher). The point is that people who move—a large and growing part of the population—are encountering sharply higher housing inflation, much of which doesn’t show in CPI.
Combine this with food, energy, healthcare, automobiles, plus everything else, and very few Americans are escaping inflation. And the solution? The Federal Reserve is going to raise interest rates, which will further hurt many people who carry variable-rate debt. And when the Fed talks about “cooling growth,” one of the unintended consequences is “kill some jobs.” So incomes will drop for some folks, too.
None of this is good. I keep talking about Fed officials having painted themselves into a corner. It’s actually worse because we’re all in the corner with them. Maybe you don’t want to be there, but you are. That’s the maddening part of all this. We are at the mercy of this unelected committee that can’t help much even if the members wanted to, and it’s not clear they do.
Future Inflation Is Path Dependent
The Fed tries hard not to surprise the markets. They pretty much telegraph their plans in advance. We know that QE will stop within a month (though why it is still underway with 7% inflation is beyond me!) and they plan to raise rates 0.25% per meeting for the next 4–5 meetings with Fed Funds reaching 1.5% sometime in 2023. They will signal well in advance if they decide to do an inter-meeting rate hike, or something changes.
Let’s look at the landscape in which the Fed is proposing to tighten. Look at the chart below which shows the evolution of the Atlanta-based GDPNow versus blue-chip economists. Even the ever-optimistic blue-chip economists see a first-quarter GDP of 2%. The Atlanta Fed is at 1.3%.
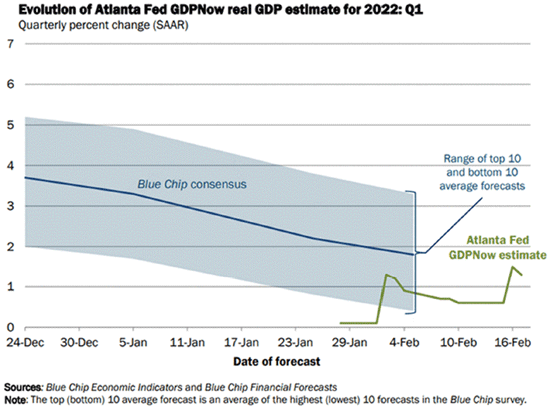
Source: Atlanta Federal Reserve Bank
My friend David Rosenberg points out that tightening cycles generally begin around 3% GDP growth. He goes on to say:
“The yield curve is half the slope it usually is heading into the first volley. And the stock market is typically very strong. And has the Fed ever embarked on a tightening cycle with consumer sentiment down 20% on a YoY basis? Answer is no. The issue here is 7.5% inflation, a product of the pandemic and principally supply-induced, and so if there is a remedy beyond a robust global harvest, OPEC+ becoming less stingy, shipping capacity spring back to life, or China easing back from its zero-COVID-19 policy, the only way central banks will be able to bring inflation back down with the tools at their disposal will be to crush demand. So think recession. And every recession in history brought with it a bear market in equities—and most of the time, it is more like down 30%–40%, not 20%.”
Like what you’re reading?
Get this free newsletter in your inbox every Saturday! Read our privacy policy here.
Rosie’s views are often aggressive, but often right. If the markets don’t respond favorably to three rate hikes, another scenario would be for the Fed to shift to balance sheet reduction instead of rate hikes. That might accommodate the markets and still bring down inflation. Maybe.
This chart is from my friend Sam Rines who is now working with René Aninao at CORBU. It shows CPI inflation of the last 24 months on a month-by-month basis. Note that January and February 2021 were very low inflation months, so the year-over-year comparison to the high side is much easier. Starting in March, those easy comparisons go away. April, May, and June were in the 5% range, which will lower the year-over-year increase. So even though inflation will be high, it will look lower. Will that reduce the pressure on the Fed?
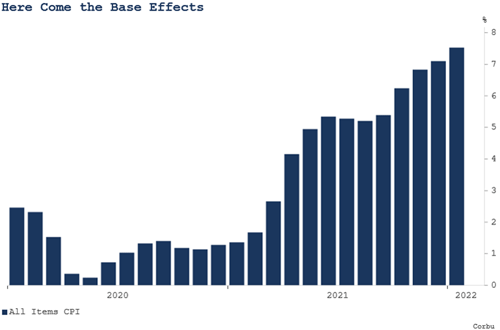
Source: CORBU
My biggest concern is that the Fed tries to steer a path between fighting inflation and protecting markets. Their number-one job has to be fighting inflation. Most of the people I follow closely believe the Fed will blink.
In any event, I believe we are in for a bumpy ride as the yield curve is already flatter than it has ever been going into a tightening cycle. Look how close the yield on the 5- and 10-year bonds are. The 20–30s is already inverted. A 1% hike this year, which is already priced in, brings an inverted yield curve even closer. I don’t believe the Fed will hike if the yield curve inverts, no matter what inflation is. Sigh.
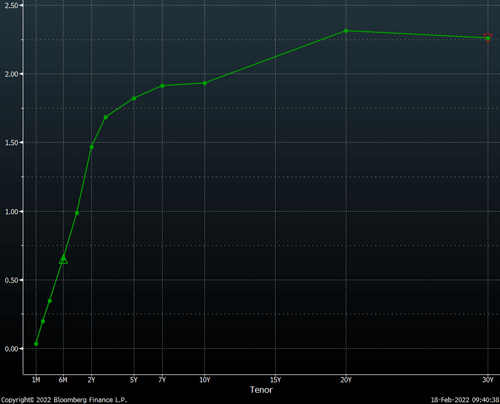
Source: Peter Boockvar
As I said earlier, the Fed has painted us along with them into a very tight corner. Inflation is going to be stickier than most people believe. I long ago asked for a refund on my Team Transitory T-shirt. The last time the US had to deal with inflation it was a very bumpy ride and I see no reason for it to be any different this time.
I don’t have a clear path because I don’t know what Jerome Powell is thinking. He is not Paul Volcker willing to crush an economy to kill inflation. But nevertheless, he has to try and kill inflation while not throwing the economy into recession. I don’t know how he can do that from where we are today. So many paths but no good choices.
I’m at Least Thinking About Traveling…
Although I have not booked any flights, I know I need to get to Cleveland this spring and I will be in NYC. I can’t remember a period of my life since I turned 30 that I’ve done so little traveling. But with COVID on the wane I expect that will change.
Let me point you to a fabulous David Bahnsen podcast with The Lords of Easy Money author Christopher Leonard. I’m not a huge podcast listener, but this had me engaged.
It’s time to hit the send button so let me wish you a great week and don’t forget to follow me on Twitter.
Your watching prices go much higher here in Puerto Rico analyst,
John Mauldin