by Don Vialoux, EquityClock.com
Technical Notes released yesterday at
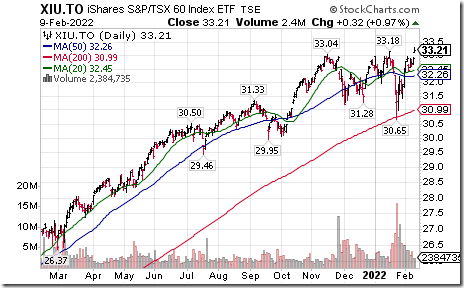
TSX 60 iShares $XIU.CA moved above $33.18 to an all-time high extending an intermediate uptrend. Seasonal influences are favourable to early June. If a subscriber to EquityClock, see seasonality chart at https://charts.equityclock.com/ishares-sptsx-60-index-fund-etf-tsexiu-seasonal-chart
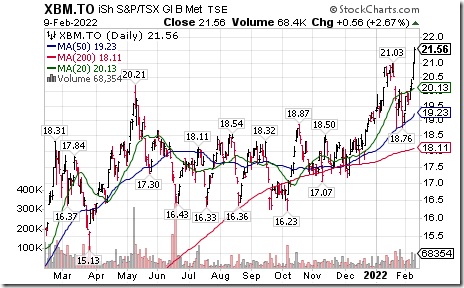
Base Metals iShares $XBM.CA moved above $21.03 to an all-time high extending an intermediate uptrend.
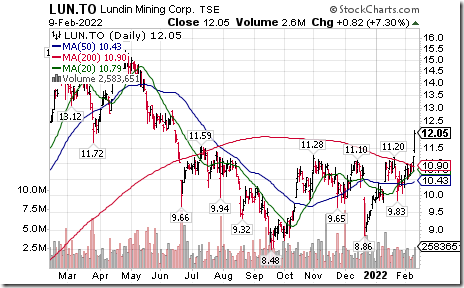
Lundin Mining $LUN.CA a major base metal producer moved above $11.28 and $11.59 completing a reverse Head & Shoulders pattern. Seasonal influences are favourable until the end of April. If a subscriber to EquityClock, see seasonality chart at https://charts.equityclock.com/lundin-mining-corporation-tselun-seasonal-chart
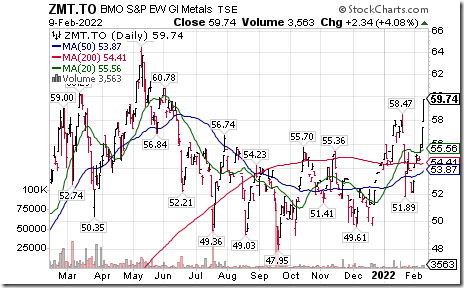
BMO Equal Weight Base Metals ETF $ZMT.CA moved above $58.47 extending an intermediate uptrend.
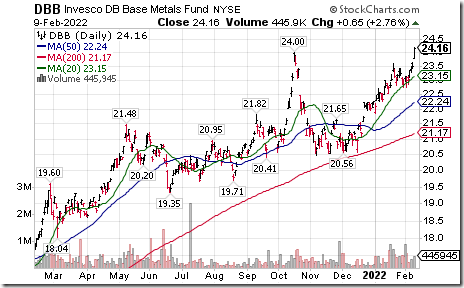
Base Metals ETN $DBB (1/3 each in copper, zinc and aluminum) moved above $24.00 to an all-time high extending an intermediate uptrend. Seasonal influences are favourable to early March. If a subscriber to EquityClock, see seasonality chart at https://charts.equityclock.com/invesco-db-base-metals-fund-nysedbb-seasonal-chart
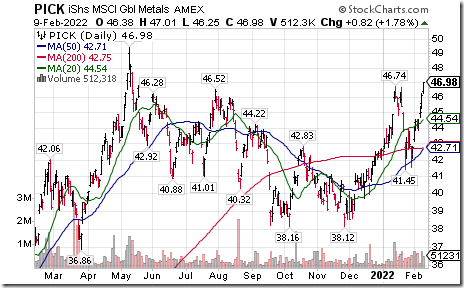
Base Metals iShares $PICK moved above $46.74 extending an intermediate uptrend.
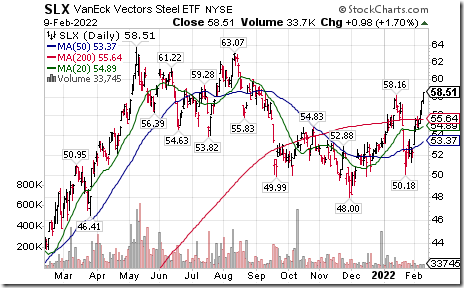
Steel ETF $SLX moved above $58.16 extending an intermediate uptrend. Seasonal influences are favourable to early May. If a subscriber to EquityClock, see seasonality chart at https://charts.equityclock.com/vaneck-vectors-steel-etf-nyseslx-seasonal-chart
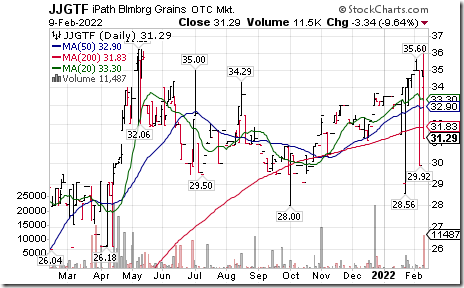
More signs of inflationary pressures! Grain ETN $JJGTF (1/3 each in corn, wheat and soybeans) moved above $36.23 extending an intermediate uptrend.
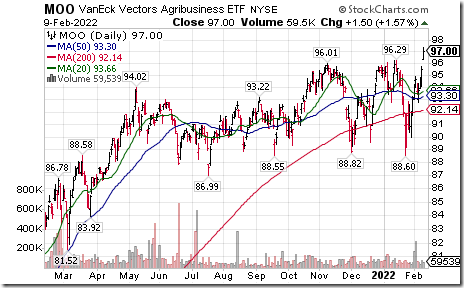
Agribusiness ETF $MOO moved above US$96.29 to an all-time high extending an intermediate uptrend.
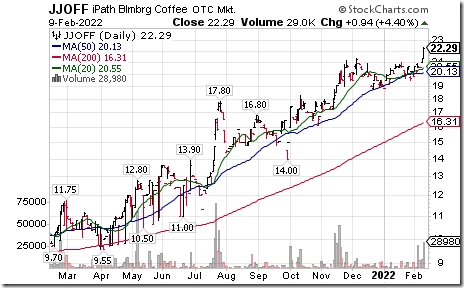
"Soft" commodity prices also are rising. Coffee ETN $JJOFF moved above $21.40 extending an intermediate uptrend.
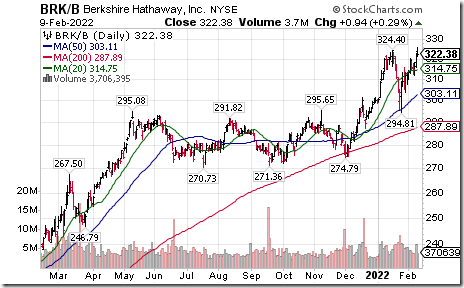
Berkshire Hathaway $BRK.B an S&P 100 stock moved above $324.40 to an all-time high extending an intermediate uptrend. Seasonal influences are favourable until at least mid-March. If a subscriber to EquityClock, see seasonality chart at https://charts.equityclock.com/berkshire-hathaway-inc-nysebrkb-seasonal-chart
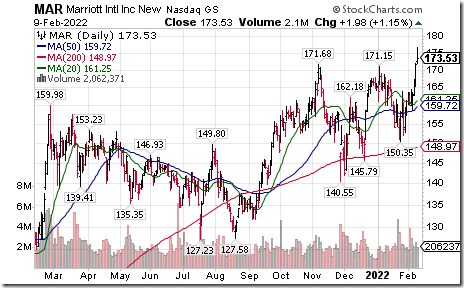
Marriott $MAR a NASDAQ 100 stock moved above $171.68 to an all-time high extending an intermediate uptrend. Seasonal influences are favourable until the end of April. If a subscriber to EquityClock, see seasonality chart at https://charts.equityclock.com/marriott-international-inc-nysemar-seasonal-chart
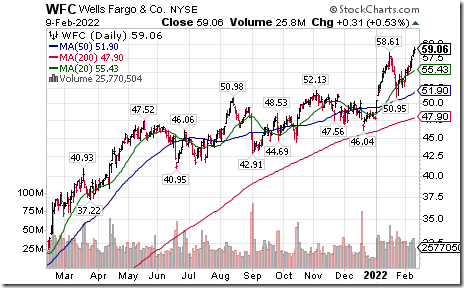
Wells Fargo $WFC an S&P 100 stock moved above $58.61 extending an intermediate uptrend.
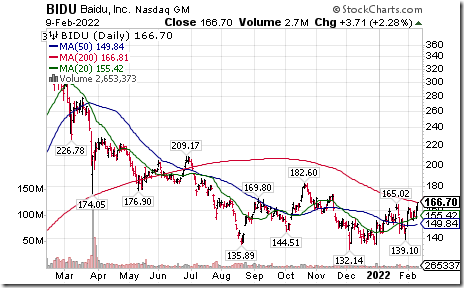
Large Cap China equities show improving technicals. Baidu $BIDU moved above $165.02 completing a base building pattern. Seasonal influences are favourable until the end of July. If a subscriber to EquityClock, see seasonality chart at https://charts.equityclock.com/baidu-com-inc-adr-nasdaqbidu-seasonal-chart
Trader’s Corner
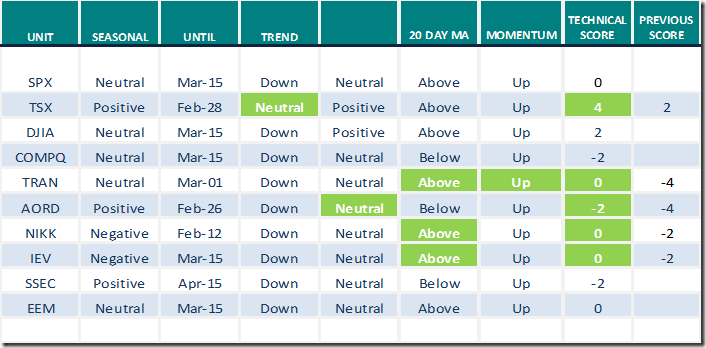
Equity Indices and Related ETFs
Daily Seasonal/Technical Equity Trends for Feb.9th 2022
Green: Increase from previous day
Red: Decrease from previous day
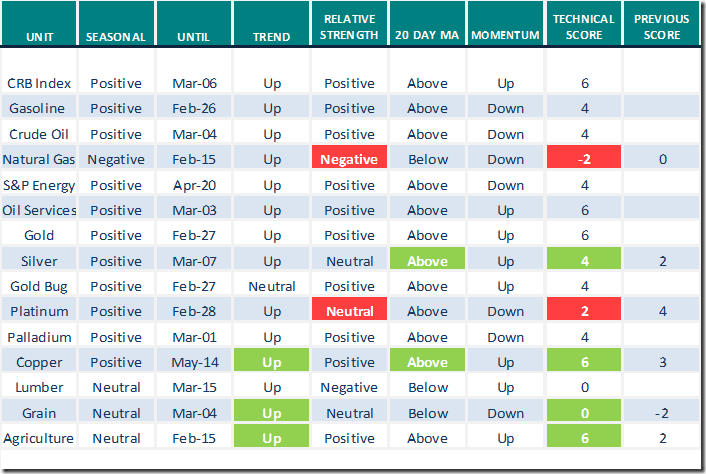
Commodities
Daily Seasonal/Technical Commodities Trends for Feb.9th 2022
Green: Increase from previous day
Red: Decrease from previous day
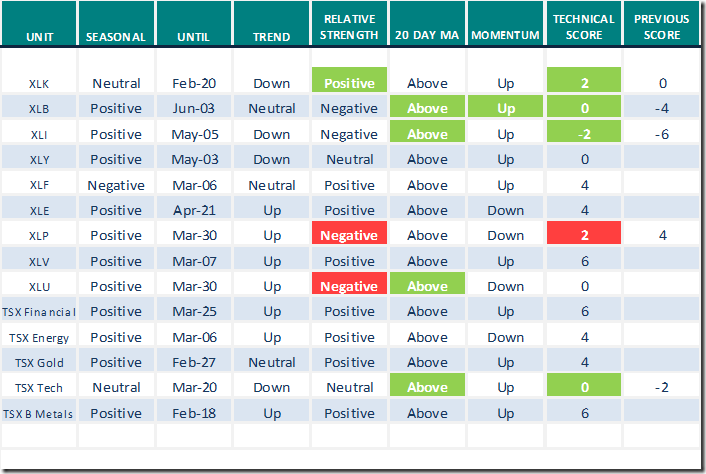
Sectors
Daily Seasonal/Technical Sector Trends for Feb.7th 2021
Green: Increase from previous day
Red: Decrease from previous day
All seasonality ratings are based on performance relative to the S&P 500 Index (except TSX
Market Buzz
Greg Schnell notes that “Bankers enjoy the rate rise”. Following is a link:
Bankers Enjoy The Rate Rise | Greg Schnell, CMT | Market Buzz (02.09.22) – YouTube
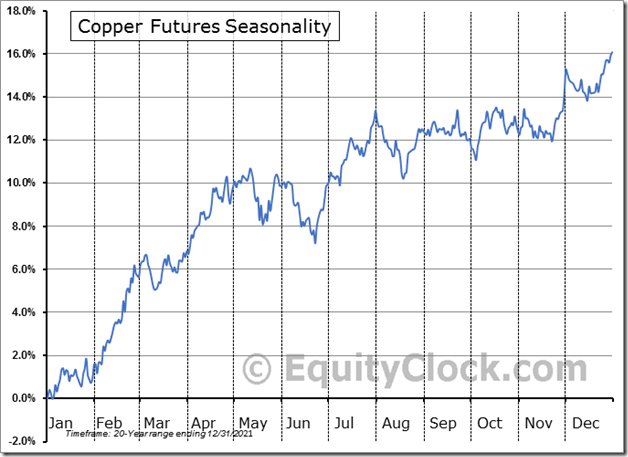
Seasonality Chart of the Day from www.EquityClock.com
Seasonal influences on a real and relative basis for copper are favourable to mid-May.
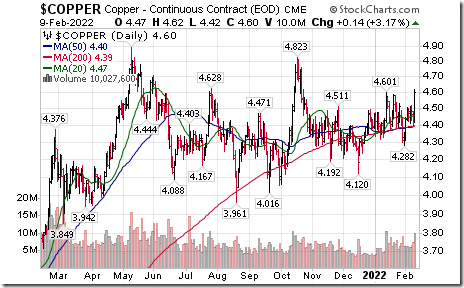
Encouraging news yesterday on the charts: Spot price moved above $4.60 per lb setting an intermediate uptrend. Price moved above its 20 and 50 day moving averages. Daily momentum indicators are trending higher. Strength relative to the S&P 500 recently turned positive.
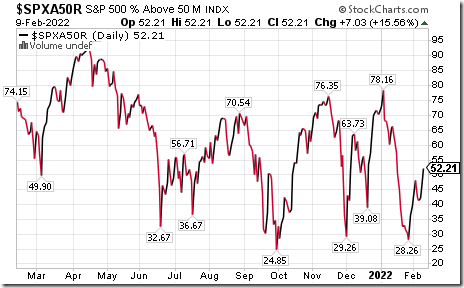
S&P 500 Momentum Barometers
The intermediate term Barometer gained 7.03 to 52.21 yesterday. It remains Neutral. Trend is up.
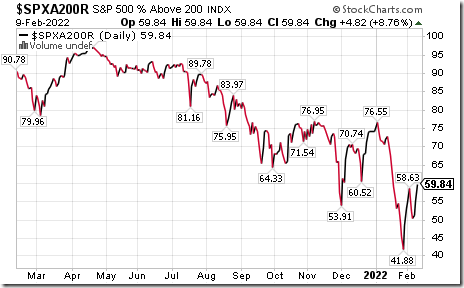
The long term Barometer added 4.82 to 59.84 yesterday. It remains Neutral. Trend is up.
TSX Momentum Barometers
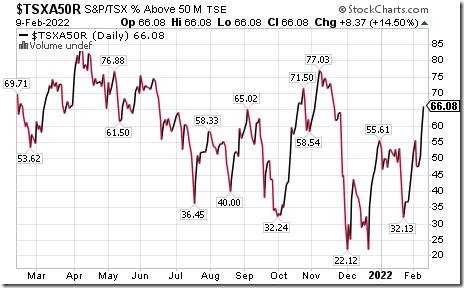
The intermediate term Barometer advanced 8.37 to 66.08 yesterday. It changed from Neutral to Overbought on a move above 60.00. Trend is up.
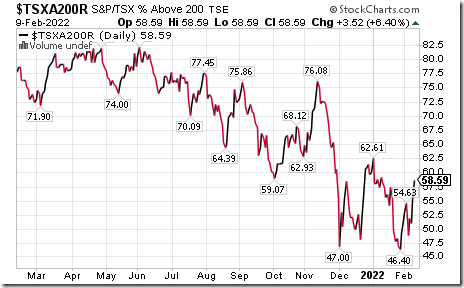
The long term Barometer added 3.52 to 58.59 yesterday. It remains Neutral. Trend is up.
Disclaimer: Seasonality and technical ratings offered in this report and at
www.equityclock.com are for information only. They should not be considered as advice to purchase or to sell mentioned securities. Data offered in this report is believed to be accurate, but is not guaranteed
This post was originally publised at Vialoux's Tech Talk.


