by Don Vialoux, EquityClock.com
The Bottom Line
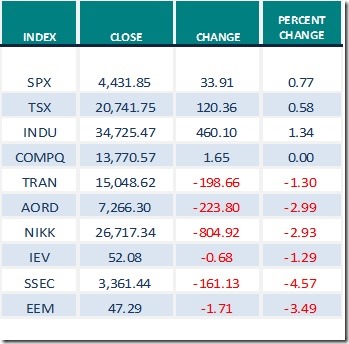
Technical signs of capitulation occurred in U.S. equity markets last week. After the S&P 500 Index dropped 12.4% and the NASDAQ Composite Index plunged 17.3% from January 3rd to January 24th on increasing volume, U.S. equity markets began to show volume and price signs of an intermediate bottom. U.S. indices bounced back from intermediate oversold levels.
The VIX Index showed technical signs of reaching an intermediate top at 38.94% on January 24th before turning lower by the end of the week.
Weakness is typical during the first month in the second year of the Presidential Election cycle after a new President with a new agenda is elected. Investors become skeptical on how the new President will be able to pay for his promised spending programs passed by Congress during the first year of his mandate: They become concerned about inflation pressures triggered by higher government spending and higher taxation. History is repeating in 2022.
What typically happens in U.S. equity markets after the first month in the second year of a new President? U.S. equity indices normally recover to mid-April followed by another downtrend to the end of June. Trading opportunities exist in U.S. equity indices between last week and the middle of April, but selection is important. Look for sectors that have recorded positive strength relative to the S&P 500 Index since the beginning of January. Top candidates are equities/ETFs that are expected to benefit from Biden’s recently approved $1.1 trillion infrastructure program.
Relief in U.S. equity markets by mid-week came for good reason. Early last week, U.S. equity markets were concerned by the possibility that the Federal Reserve would truncate its bond buying taper program before its conclusion in March. However, the Fed confirmed on Wednesday that it has not changed its program (at least not yet). Equity prices responded accordingly.
What could change the Federal Reserve’s current policy? President Biden has proposed a scaled back “Build Back Better” program originally valued at $3.5 trillion and now valued at $1.7 trillion. The program has been approved by the House of Representatives, but not the Senate where a majority vote is required. Anticipation of approval of the program by this spring will be positive for U.S. equity prices. However, if the program eventually is approved by the Senate, current high inflation rates in the U.S. likely will be extended. The Federal Reserve will feel compelled to take action by this summer to lower inflationary pressures by tightening monetary policy. The window of opportunity for higher equity prices between now and spring is short, but attractive.
Passage of the “Build Back Better” program will have an immediate positive impact on precious metal prices and precious metal equity prices in anticipation of elevated inflation rates. However, passage of the program is far from certain. Meanwhile, precious metal prices are expected to be trendless.
Observations
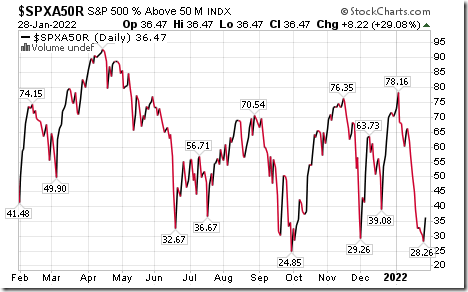
Intermediate term technical indicator for U.S. equity markets (Percent of S&P 500 stocks trading above their 50 day moving average) changed from Neutral to Oversold last week. Trend remained down and has yet to show signs of bottoming. See Momentum Barometer chart at the end of this report.
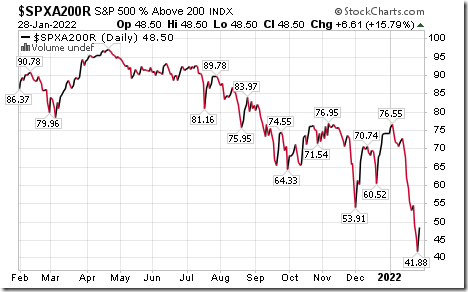
Long term technical indicator for U.S. equity markets (Percent of S&P 500 stocks trading above their 200 day moving average) changed from Overbought to Neutral last week. Trend remains down. See Momentum Barometer chart at the end of this report.
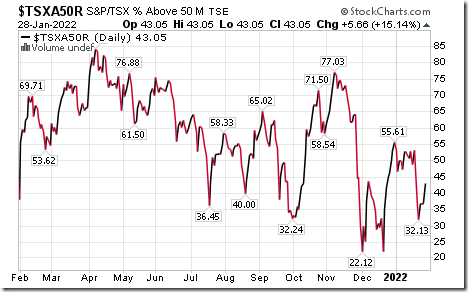
Intermediate term technical indicator for Canadian equity markets changed from Neutral to Oversold last week. . Trend remains down. See Momentum Barometer chart at the end of this report.
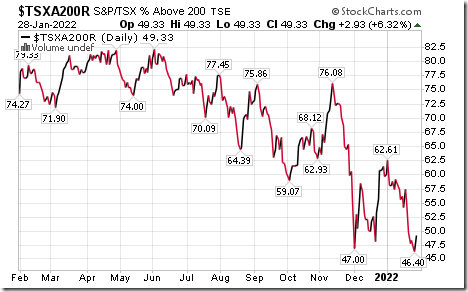
Long term technical indicator for Canadian equity markets (Percent of TSX stocks trading above their 200 day moving average) remained Neutral last week. Trend is down. See Momentum Barometer chart at the end of this report.
Consensus earnings and revenue estimates for S&P 500 companies for the fourth quarter of 2021 continued to increase. According to www.FactSet.com projected earnings on a year-over-year basis in the fourth quarter increased from 21.7% two weeks ago, 23.1% last week to current 24.3%. 33% of companies that have reported to date: Seventy seven percent of reporting companies exceeded consensus estimates. Revenues increased 13.9% versus a gain of 13.1% last week with 75% of reporting companies exceeding consensus.
Consensus earnings estimates for S&P 500 companies in the first half of 2022 were little changed. According to www.FactSet.com first quarter earnings on a year-over-year basis are expected to increase 5.6% and second quarter earnings are expected to increase 4.3%.
Economic News This Week
November Canadian GDP to be released at 8:30 AM EST on Tuesday is expected to increase 0.8% versus a gain of 0.8% in October.
December Construction Spending to be released at 8:30 AM EST on Tuesday is expected to increase 0.7% versus a gain of 0.4% in November.
January ISM Manufacturing PMI to be released at 10:00 AM EST on Tuesday is expected to slip 57.5 from 58.8 in December.
Fourth quarter Non-farm Productivity to be released at 8:30 AM EST on Thursday is expected to increase 2.8% versus a decline of 5.2% in the third quarter.
December Factory Orders to be released at 10:00 AM EST on Thursday are expected to increase 0.1% versus a gain of 1.6% in November.
January Non-Manufacturing ISM PMI to be released at 10:00 AM EST on Thursday are expected to drop to 58.7 from 62.3 in December
January Non-Farm Payrolls to be released at 8:30 AM EST on Friday are expected to increase to 200,000 from 199,000 in December. January Unemployment Rate is expected to remain unchanged from December at 3.9%. January Average Hourly Earnings are expected to increase 0.5% versus a gain of 0.6% in December.
Canada’s January Employment to be released at 8:30 AM EST on Friday is expected to drop 125,000 versus a gain of 54,700 in December. January Unemployment Rate is expected to increase to 6.0% from 5.9% in December.
Selected Earnings News This Week
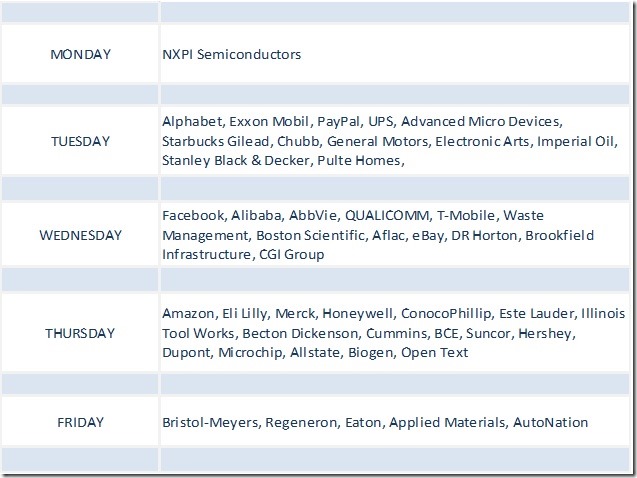
Another 109 S&P 500 companies are scheduled to report quarterly results this week (including two Dow Jones Industrial Average companies).
TSX 60 companies scheduled to release quarterly results include Imperial Oil, Brookfield Infrastructure, CGI Group and Open Text.
Trader’s Corner
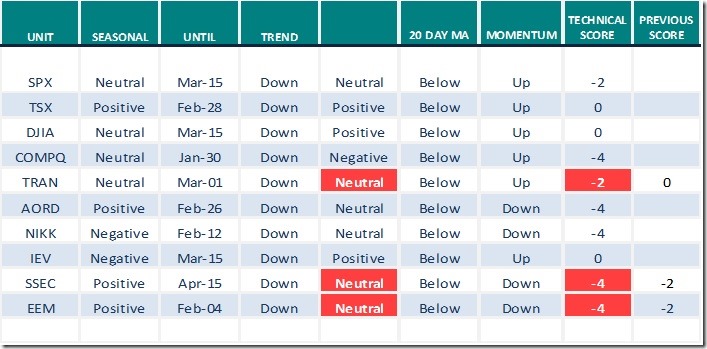
Equity Indices and Related ETFs
Daily Seasonal/Technical Equity Trends for Jan.28th 2022
Green: Increase from previous day
Red: Decrease from previous day
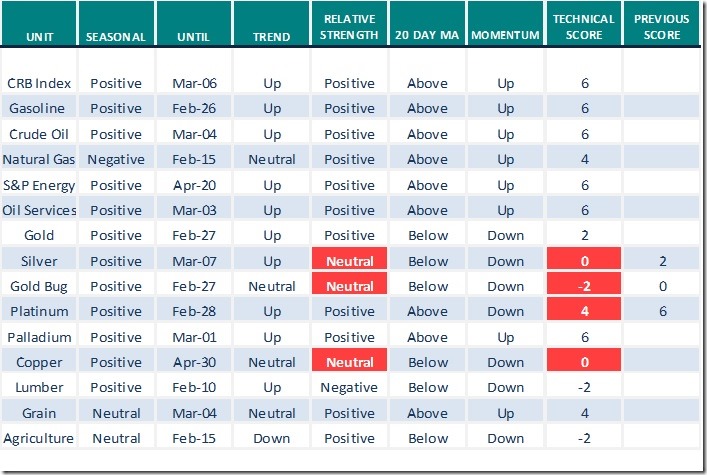
Commodities
Daily Seasonal/Technical Commodities Trends for Jan.28th 2022
Green: Increase from previous day
Red: Decrease from previous day
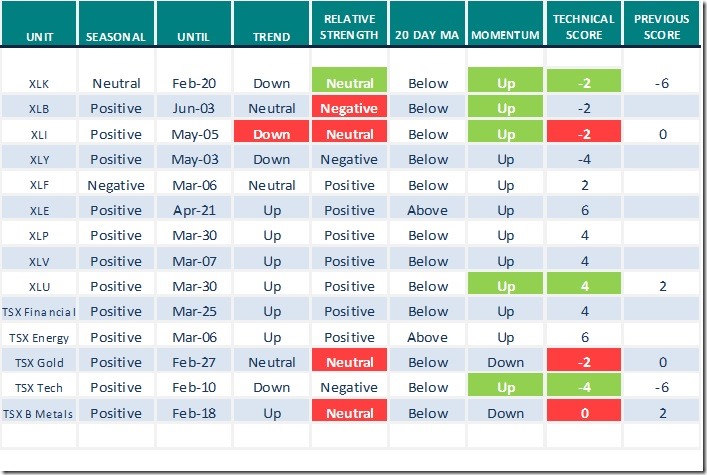
Sectors
Daily Seasonal/Technical Sector Trends for Jan.28th 2021
Green: Increase from previous day
Red: Decrease from previous day
All seasonality ratings are based on performance relative to the S&P 500 Index (except TSX)
Links offered by valued providers
Greg Schnell notes that “North American equity markets had a higher close on Friday”
https://stockcharts.com/articles/canada/2022/01/a-higher-close-957.html
Michael Campbell’s Money Talks for January 29th
January 29th Episode (mikesmoneytalks.ca)
Erin Swenlin from www.StockCharts.com says “Bear Market Rally Ahead”
https://www.youtube.com/watch?v=PAQ9azdXBgo
Mary Ellen McGonagle from www.StockCharts.com asks “Are markets bottoming”?
https://www.youtube.com/watch?v=PAQ9azdXBgo
Mark Bunting and www.uncommonsenseinvestor.com asks “Correction or Bear Market? We’ve got answers
Correction or Bear Market? We’ve Got Answers. – Uncommon Sense Investor
David Rosenberg says, “The Market is Pricing in Too Many Rate Hikes. What the Fed will do instead
Comments by Mark Leibovit: Stock Marktets, Volatility, Russia and Ukraine.
This Week in Money – HoweStreet
Technical Scoop for January 31st by David Chapman
Technical Scores
Calculated as follows:
Intermediate Uptrend based on at least 20 trading days: Score 2
(Higher highs and higher lows)
Intermediate Neutral trend: Score 0
(Not up or down)
Intermediate Downtrend: Score -2
(Lower highs and lower lows)
Outperformance relative to the S&P 500 Index: Score: 2
Neutral Performance relative to the S&P 500 Index: 0
Underperformance relative to the S&P 500 Index: Score –2
Above 20 day moving average: Score 1
At 20 day moving average: Score: 0
Below 20 day moving average: –1
Up trending momentum indicators (Daily Stochastics, RSI and MACD): 1
Mixed momentum indicators: 0
Down trending momentum indicators: –1
Technical scores range from -6 to +6. Technical buy signals based on the above guidelines start when a security advances to at least 0.0, but preferably 2.0 or higher. Technical sell/short signals start when a security descends to 0, but preferably -2.0 or lower.
Long positions require maintaining a technical score of -2.0 or higher. Conversely, a short position requires maintaining a technical score of +2.0 or lower
Changes Last Week
Happy New Year to our Chinese Friends
New Year occurs on February 1st this year. Chinese exchanges are closed for most of this week. Historically, the Shanghai Composite Index has moved lower just before Chinese New Year when it reaches a seasonal low prior to a significant upside move to the middle of April.
The Shanghai Composite Index appears to be following its traditional seasonal pattern this year.
Technical Notes released on Friday at
The US Dollar has broken out, following seasonal norms for this time of year and placing itself in a position of a headwind against risk assets. equityclock.com/2022/01/27/… $USDX $UUP $EURUSD $USDCAD #USDOLLAR
Natural Gas ETN $UNG moved above $16.19 resuming an intermediate uptrend.
Industrial SPDRs $XLI moved below $97.11 extending an intermediate downtrend.
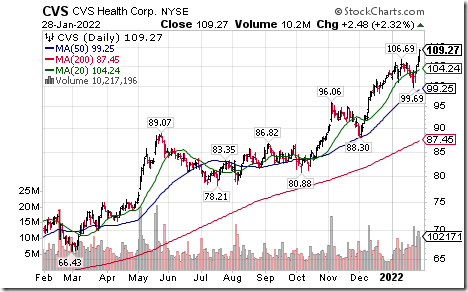
CVS Health $CVS moved above $106.69 to an all-time high extending an intermediate uptrend.
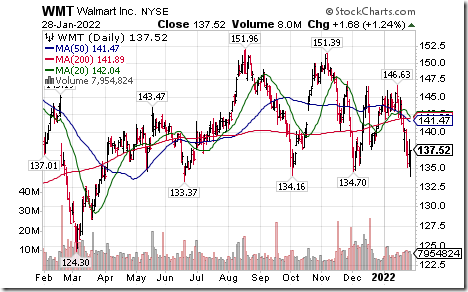
Walmart $WMT a Dow Jones Industrial Average stock moved below $134.16 completing an intermediate topping pattern.
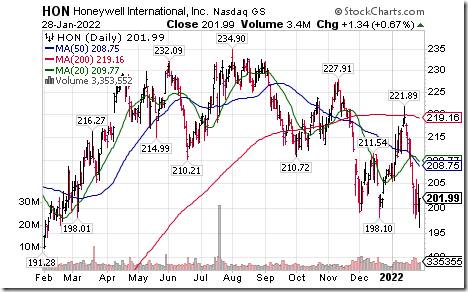
Honeywell $HON an S&P 100 stock moved below $198.10 extending an intermediate downtrend.
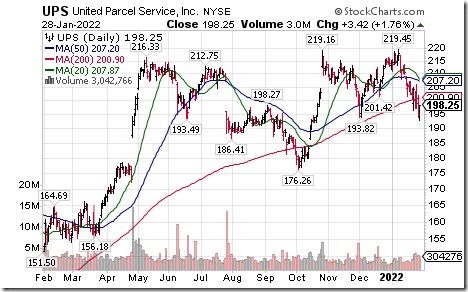
United Parcel Services $UPS an S&P 100 stock moved below $193.82 completing a double top pattern.
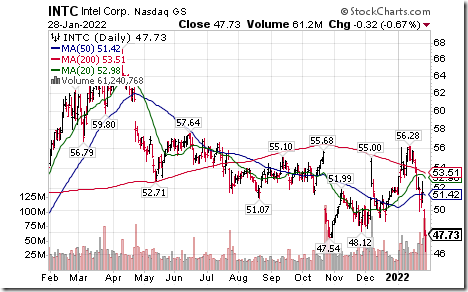
Intel $INTC a Dow Jones Industrial Average stock moved below $45.54 extending an intermediate downtrend.
Lam Research $LRCX a NASDAQ 100 stock moved below $533.84 extending an intermediate downtrend.
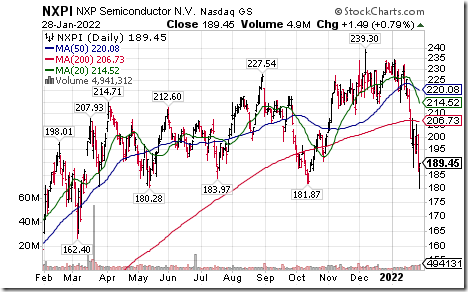
NXP Semiconductor $NXPI a NASDAQ 100 stock moved below $181.87 extending an intermediate downtrend.
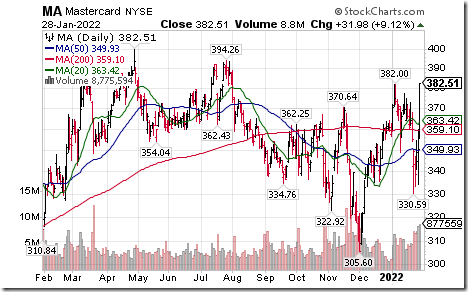
MasterCard $MA an S&P 100 stock moved above $382.00 extending an intermediate uptrend. Seasonal influences are favourable. If a subscriber to EquityClock, see seasonality charts at charts.equityclock.com/mast…
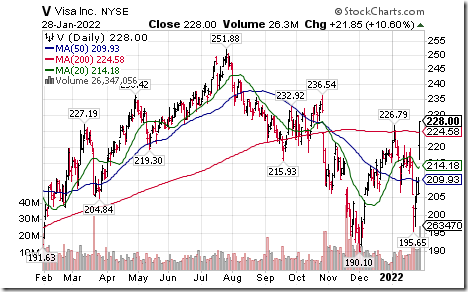
Visa $V an S&P 100 stock moved above $226.79 extending an intermediate uptrend. Seasonal influences are particularly favourable to the end of February. If a subscriber to EquityClock, see seasonality chart at charts.equityclock.com/visa…
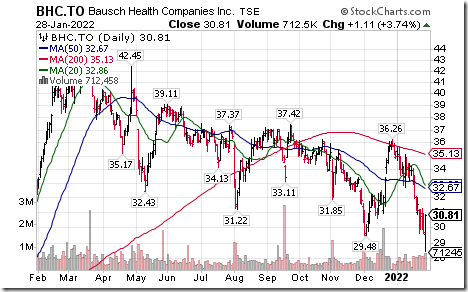
Bausch Health $BHC.CA a TSX 60 stock moved below Cdn$29.48 extending an intermediate downtrend.
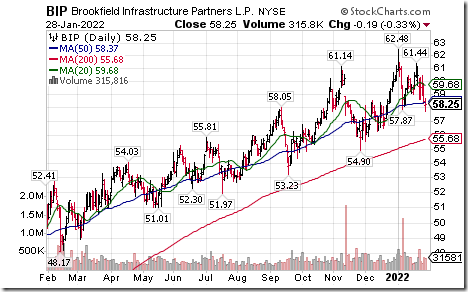
Brookfield Infrastructure $BIP a TSX 60 stock moved below US$57.87 completing a double top pattern.
S&P 500 Momentum Barometers
The intermediate term Barometer added 8.22 to 36.47 on Friday and 5.80 last week to 36.47. It remains Oversold, but showing early signs of bottoming.
The long term Barometer gained 6.61 to 48.50 on Friday and fell 4.61 last week to 48.50. It remains Neutral, but shows early signs of bottoming.
TSX Momentum Barometers
The intermediate term Barometer added 5.66 on Friday and 6.98 last week to 43.05. It changed on Friday from Oversold to Neutral on a recovery above 40.00. Trend may be starting to move higher.
The long term Barometer added 2.93 on Friday and slipped 0.44 last week to 49.33. It remains Neutral.
Disclaimer: Seasonality and technical ratings offered in this report and at
www.equityclock.com are for information only. They should not be considered as advice to purchase or to sell mentioned securities. Data offered in this report is believed to be accurate, but is not guaranteed
This post was originally publised at Vialoux's Tech Talk.


